| Information |  | |
Derechos | Equipo Nizkor
| ||
| Information |  | |
Derechos | Equipo Nizkor
| ||
20Dec16
Defense Acquisitions: How and Where DOD Spends and Reports Its Contracting Dollars
Back to topContents
Introduction
How Much DOD Spends on Contract ObligationsTotal DOD Spending on Research, Development, Test, and Evaluation (RDT&E)
The Global Environment for R&DWhere DOD Obligates Contract Dollars
Reliability of Data on Contract Obligations
Figures
Figure 1. Contract Obligations by Agency
Figure 2. DOD Total Obligation Authority, FY2000-FY2015
Figure 3. DOD vs. Rest of Government Contract Obligations, FY2000-FY2015
Figure 4. DOD Contract Obligations by Major Category
Figure 5. DOD Contract Obligations Dedicated to R&D, FY2000-FY2015
Figure 6. DOD RDT&E vs. Non-RDT&E Outlays, FY2000-FY2015
Figure 7. Comparison of R&D Expenditures 1960-2013
Figure 8. Federal and U.S. Expenditures
Figure 9. Growth in Gross Domestic Expenditures on R&D for Selected Nations, 2000-2013
Figure 10. DOD Combatant Commands' Areas of Responsibility
Figure 11. Contract Obligations in Iraq and Afghanistan Theaters
Figure 12. Percentage of DOD Contract Obligations Performed in the United States
Figure 13. DOD Contract Obligations for Work Performed in Combatant Command Areas of Responsibility
Figure 14. DOD's Proportion of Total U.S. Government Contract Work Performed Overseas
Figure A-1. Discrepancy in Different Methods for Calculating Total Contract Obligations, FY2000-FY2015
Figure B-1. Change in DOD Contract Obligations by PSC CodeTables
Table 1. Trends in Contract Obligations
Table 2. Nations with the Largest Gross Domestic Expenditures on R&D, 2013
Table 3. Obligations for Contracts Performed Overseas
Table C-1. Top 20 Foreign Countries, by Place of PerformanceAppendixes
Appendix A. FPDS Background, Accuracy Issues, and Future Plans
Appendix B. Obligations Trends by PSC
Appendix C. Top 20 Foreign Countries Where DOD Obligates Contracting Dollars
Summary
The Department of Defense (DOD) has long relied on contractors to provide the U.S. military with a wide range of goods and services, including weapons, vehicles, food, uniforms, and operational support. Without contractor support, the United States would be currently unable to arm and field an effective fighting force. Costs and trends associated with contractor support provides Congress more information upon which to make budget decisions and weigh the relative costs and benefits of different military operations–including contingency operations and maintaining bases around the world.
Total DOD Contract Obligations
Obligations occur when agencies enter into contracts, employ personnel, or otherwise commit to spending money. The federal government tracks money obligated on federal contracts through a database called the Federal Procurement Data System-Next Generation (referred to as FPDS). There is no public database that tracks DOD contract outlays (money expended from the Treasury) as comprehensively as FPDS tracks obligations.
In FY2015, DOD obligated more money on federal contracts ($274 billion in current dollars, or $283 billion in inflation-adjusted FY2017 dollars) than all other federal government agencies combined. DOD's contract obligations were equal to 7% of all mandatory and discretionary federal spending. Services accounted for 44% of total DOD contract obligations, goods for 47%, and research and development (R&D) for 9%. This distribution is in contrast to the rest of the federal government, which obligated a larger portion of contracting dollars on services (53%), than on goods (38%) and research and development (9%) combined.
According to FPDS data, from FY2000 to FY2015, DOD contract obligations increased from $187 billion to $283 billion (FY2017 dollars). The increase in spending, however, has not been steady. DOD contract obligations were marked by an annualized increase of 14.8% in current dollars between FY2000 and FY2008, followed by an annualized decrease of 5.0% from FY2008 to FY2015. The rise and fall of DOD contract spending may make budgeting more difficult than in the rest of the federal government, which has had more gradual increases and less drastic cuts.
For almost 20 years, DOD has dedicated an ever-smaller share of its contracting dollars to R&D, with such contracts dropping from 18% of total contract obligations in FY1998 to 9% in FY2015.
Understanding the Limitation of FPDS Data
Decision-makers should be cautious when using obligation data from FPDS to develop policy or otherwise draw conclusions. In some cases, the data itself may not be reliable. In some instances, a query for particular data may return differing results, depending on the parameters and timing.
All data have imperfections and limitations. FPDS data can be used to identify broad trends and produce rough estimates, or to gather information about specific contracts. Some observers say that despite its shortcomings, FPDS data are substantially more comprehensive than what is available in most other countries in the world. Understanding the limitations of data–knowing when, how, and to what extent to rely on data–helps policymakers incorporate FPDS data more effectively into their decision-making process.
The General Services Administration (GSA) is undertaking a multi-year effort to improve the reliability, precision, retrieval, and utility of the information contained in FPDS and other federal government information systems. This effort, if successful, could significantly improve DOD's ability to engage in evidence- and data-based decision-making.
Introduction
The Department of Defense (DOD) has long relied on contractors to provide the U.S. military with a wide range of goods and services, including weapons, vehicles, food, uniforms, and operational support. Without contractor support, the United States would not be able to arm and field an effective fighting force. Costs and trends associated with contractor support provides Congress more information upon which to make budget decisions and weigh the relative costs and benefits of different military operations–including contingency operations and maintaining bases around the world.
This report examines (1) how much money DOD obligates on contracts, (2) what DOD is buying, and (3) where that money is being spent. This report also examines the extent to which these data are sufficiently reliable to use as a factor when developing policy or analyzing government operations.
Related CRS reports include CRS Report R44454, Defense: FY2017 Budget Request, Authorization, and Appropriations, by Pat Towell and Lynn M. Williams; CRS Report R43566, Defense Acquisition Reform: Background, Analysis, and Issues for Congress, by Moshe Schwartz; CRS Report R43074, Department of Defense's Use of Contractors to Support Military Operations: Background, Analysis, and Issues for Congress, by Moshe Schwartz; and CRS Report R44329, Using Data to Improve Defense Acquisitions: Background, Analysis, and Questions for Congress, by Moshe Schwartz.
How Much DOD Spends on Contract Obligations
When Congress appropriates money, it provides budget authority–the authority to enter into obligations. Obligations occur when agencies enter into contracts, submit purchase orders, employ personnel, or otherwise legally commit to spending money. Outlays occur when obligations are liquidated (primarily through the issuance of checks, electronic fund transfers, or the disbursement of cash). |1|
How Are Government Contract Data Tracked? The Federal Procurement Data System–Next Generation (FPDS)–is a central database of U.S. government-wide procurement. The purpose of FPDS is to provide data that can be used as "a basis for recurring and special reports to the President, the Congress, the Government Accountability Office, Federal executive agencies, and the general public." |2| The contract data in this report come from the FPDS database.
FPDS generally reports information on contracts that exceed the micro-purchase threshold, defined in 48 C.F.R. §2.101. |3| As of October 2015, the micro-purchase threshold is generally $3,500 (meaning that contract actions above this amount must be reported to FPDS). |4| FPDS does not include data from judicial branch agencies, the legislative branch, certain DOD components, or select executive branch agencies–such as the Central Intelligence Agency and National Security Agency. |5| Unless otherwise indicated, all data in this report are derived from FPDS.
Due to concerns over data reliability (see below), data from FPDS are used in this report to identify broad trends and rough estimations. FPDS contains data from 1978 to the present. For a more detailed discussion on how FPDS operates, see Appendix A.
In FY2015, the U.S. federal government obligated $438 billion of contracts for the acquisition of goods, services, and research and development. The $438 billion obligated on contracts was equal to approximately 12% of total FY2015 federal budget outlays of $3.7 trillion. |6| As noted in Figure 1, in FY2015, DOD obligated more money on federal contracts ($274 billion) than all other federal agencies combined. DOD's obligations were equal to 7% of all federal government spending.
Figure 1. Contract Obligations by Agency
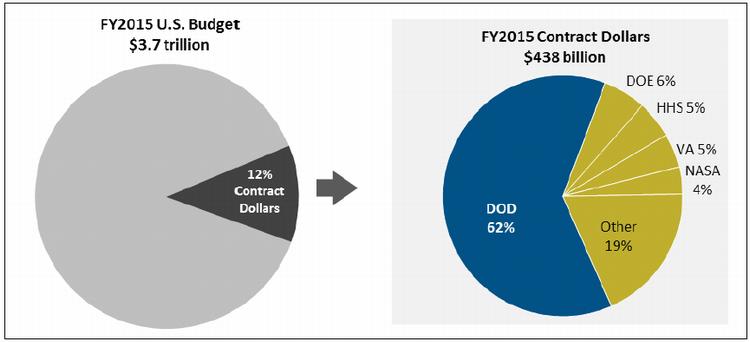
Source: Federal Procurement Data System-Next Generation, April 2016. Figure created by CRS.
From FY2010 to FY2015, the federal government obligated both a smaller amount of money and a smaller percentage of the overall budget to contract acquisitions. In addition, the DOD share of overall contract obligations decreased relative to the rest of the federal government (see Table 1).
Table 1. Trends in Contract Obligations
FY2010 FY2015 Total government contract obligations (FY2017 dollars) $599 billion $452 billion Total contract obligations as percent of budget 15% 12% DOD share of contract obligations 68% 62% DOD contract obligations as percentage of federal spending 10.5% 7.4% Source: CRS analysis of FPDS, OMB, and DOD Comptroller data.
Trends in DOD Contract Obligations
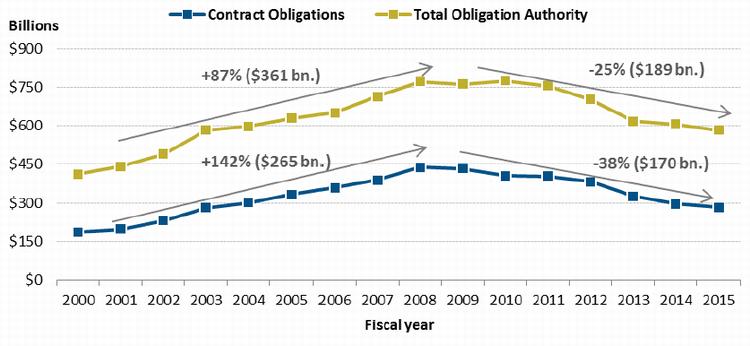
From FY2000 to FY2015, adjusted for inflation (FY2017 dollars), DOD contract obligations increased from $187 billion to $283 billion. |7| However, the increase in spending has not been steady. DOD contracting was marked by a steep increase in obligations from FY2000 to FY2008 (an increase of $265 billion or 142%), followed by a drop in obligations (a decrease of $170 billion or 38%) from FY2008 to FY2015 (see Figure 2).
Contract obligation trends are generally consistent with–but still steeper than–overall DOD obligation authority trends. For example, DOD total obligation authority (including contracts as well as all other obligations) increased significantly from FY2000 to FY2008, and decreased from FY2008 to FY2015 (see Figure 2).
Figure 2. DOD–Total Obligation Authority, FY2000-FY2015
FY2017 Dollars
Source: Office of the Under Secretary of Defense (Comptroller), Department of Defense, National Defense Budget Estimates for FY2017, "Department of Defense TOA - By Public Title," Table 6-1, 2016. Figure created by CRS.
Some analysts believe that this trend of rapid contract spending increases (averaging 14.8% annual increases), followed by a relatively sharp cut in contract spending (averaging 5.0% annual decreases), puts DOD at increased risk of making short-term budget decisions (aimed at meeting budget caps) that could cause long-term harm.
These analysts argue that, even without changing long-term budget reduction targets, DOD should make more strategically informed decisions. |8| Limits on DOD funding resulting from the Budget Control Act could result in cuts that are not strategically thought out. |9| A more gradual reduction in spending, or additional funding in select budget categories, could help DOD make more gradual spending reductions and more considered choices. This could potentially minimize any hazardous, long-term effects of budget cuts. Addressing budget cuts, former Pentagon comptroller Robert Hale wrote that one option for Congress is to
approve more funding in at least some budget categories and raise the budget caps to accommodate the boosted funding. This could be accomplished in a mini budget deal (as opposed to the forever elusive "grand bargain") that, hopefully for at least a few years, would effectively eliminate the threat of sequestration in favor of considered choices (italics added). |10|
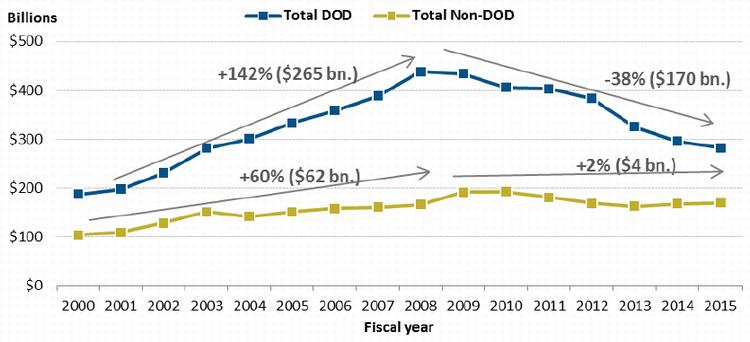
The rise and fall of DOD contract spending may make budgeting more difficult than in the rest of the federal government, which has had more gradual increases and less drastic spending cuts (see Figure 3). |11|
Figure 3. DOD vs. Rest of Government Contract Obligations, FY2000-FY2015
FY2017 Dollars
Source: CRS analysis of FPDS data. Figure created by CRS.
What DOD Buys
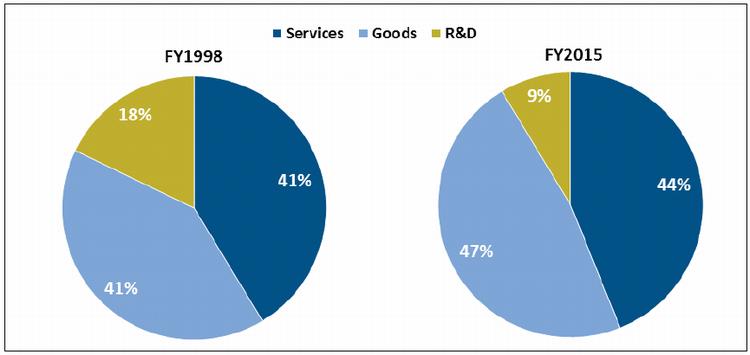
In FY2015, 44% of total DOD contract obligations were for services, 47% for goods, and 9% for research and development (R&D) (see Figure 4). This is in contrast to the rest of the federal government (excluding DOD), which obligated a significantly larger portion of contracting dollars on services (53%) than on goods (38%) or research and development (9%).
How Are Contracts Categorized?
FPDS categorizes contracts by product or service codes. According to FPDS, "These product/service codes are used to record the products and services being purchased by the Federal Government. In many cases, a given contract/task order/purchase order will include more than one product and/or service. In such cases, the product or service code data element code should be selected based on the predominant product or service that is being purchased. For example, a contract for $1000 of lumber and $500 of pipe would be coded under 5510, Lumber & Related Wood Materials."
Because FPDS contracts are associated with only a single product or service code–even when the contract involves substantial deliveries of other products or services–the analysis in this report should be used only to identify broad overall trends.
Source: U.S. General Services Administration Office of Governmentwide Policy, Federal Procurement Data System Product and Service Codes Manual, August 2015 Edition, October 1, 2015, p. 6, at https://www.fpds.gov/downloads/top_requests/PSC_Manual_FY2016_Oct1_2015.pdf.
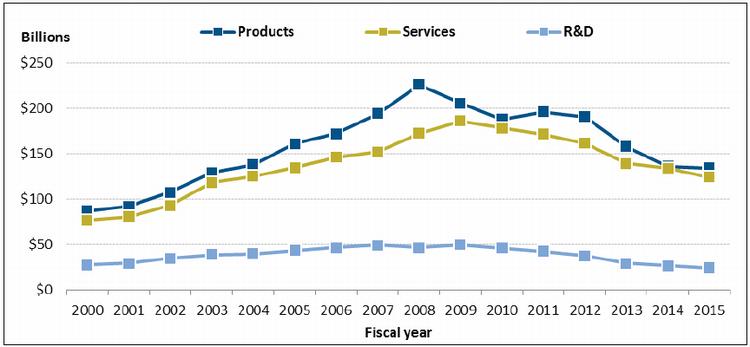
For almost 20 years, DOD has dedicated an ever-smaller share of contracting dollars to R&D, with such contracts dropping from 18% of total contract obligations in FY1998 to 9% in FY2015. (For a breakout of DOD obligation trends by product service code, see Appendix B.)
Figure 4. DOD Contract Obligations by Major Category
Source: CRS analysis of FPDS data. Figure created by CRS.
The relative decrease in R&D contracts manifests as both a percentage of overall spending and in terms of constant dollars. Despite increased spending on R&D from FY2000 to FY2007, adjusted for inflation (in FY2017 dollars), DOD obligated less money on R&D contracts in FY2015 ($24 billion) than it invested more than 15 years earlier ($31 billion in FY1998). In contrast, over the same period, DOD obligations to acquire both goods and services are substantially higher than they were 15 years ago (see Figure 5).
Figure 5. DOD Contract Obligations Dedicated to R&D, FY2000-FY2015
FY2017 Dollars
Source: CRS analysis of FPDS data. Figure created by CRS.
Total DOD Spending on Research, Development, Test, and Evaluation (RDT&E)
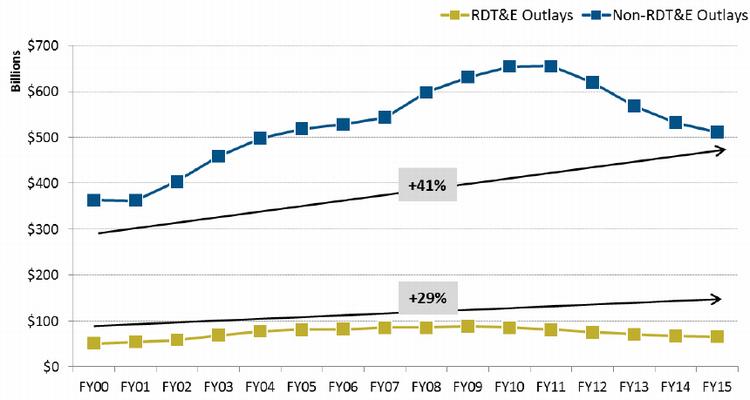
Research and development contracting is but a portion of overall DOD investment in RDT&E. |12| For example, DOD uses grants to support much of its research at universities. More than half of DOD's basic research budget is spent at universities |13| and represents the major contribution of funds in some areas of science and technology, such as mechanical engineering and electrical engineering. |14| When taken as a whole, the R&D picture looks somewhat different. Total outlays for RDT&E |15| increased 73% in constant dollars from FY2000 to FY2009, before dropping 25% from FY2009 to FY2015. |16| However, as reflected in Figure 6, over the last 15 years, RDT&E outlays increased at a slower rate (29%) than non-RDT&E (41%).
"R&D" versus "RDT&E"
"R&D" is defined in FPDS's Product and Service Codes and refers to individual DOD contract action obligations. It includes only contract procurement–employee salaries and other non-contracted expenditures are unavailable in FPDS.
"RDT&E" is defined by appropriations law and can be used to describe either appropriations or outlays. RDT&E may encompass salaries and other expenditures not involving contract procurement. For this reason, RDT&E outlay totals are greater than DOD's R&D obligation totals–roughly 2.75 times higher in FY2015, for instance. These definitions of R&D and RDT&E may be neither wholly inclusive nor exclusive of one another–they can be interpreted as different ways to measure similar concepts.
The term RDT&E is specifically relevant to U.S. defense appropriations law–in a global context, it does not have any particular meaning. Internationally, organizations such as the OECD use the term "R&D" as a general way of describing research and development spending.
Figure 6. DOD RDT&E vs. Non-RDT&E Outlays, FY2000-FY2015
FY2017 Dollars
Source: National Defense Budget Estimates for FY 2017, Department of Defense Outlays by Public Title, Table 6-11.
The Global Environment for R&D
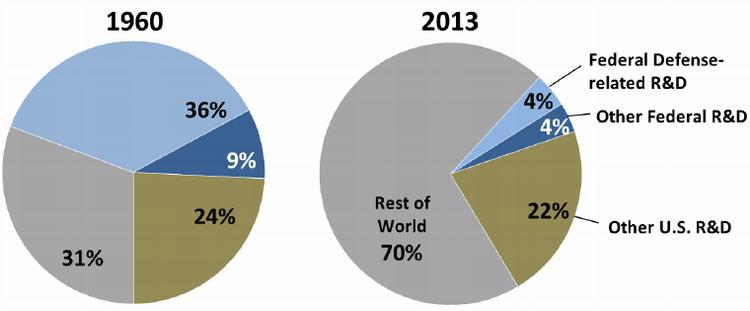
The profile of DOD R&D spending takes place against a backdrop of increasing R&D investments by foreign nations and private industry. As reflected in Figure 7, between 1960 and 2013, the U.S. share of global R&D expenditures fell from 69% to 30%, and U.S. federal defense-related R&D's share dropped from 36% to 4%.
Figure 7. Comparison of R&D Expenditures 1960-2013
Source: 1960: U.S. and Rest of World (ROW) shares based on data from U.S. Department of Commerce, Office of Technology Policy, The Global Context for U.S. Technology Policy, Summer 1997. 2012: U.S. data from National Science Foundation, Science and Engineering Indicators 2016, http://www.nsf.gov/statistics/2016/nsb20161, and U.S. R&D Increased in 2013, Well Ahead of the Pace of Gross Domestic Product, NSF 15-330, September 8, 2015. ROW share from Organization for Economic Cooperation and Development, Main Science and Technology Indicators, https://stats.oecd.org/Index.aspx?DataSetCode=MSTI_PUB. Figure created by CRS.
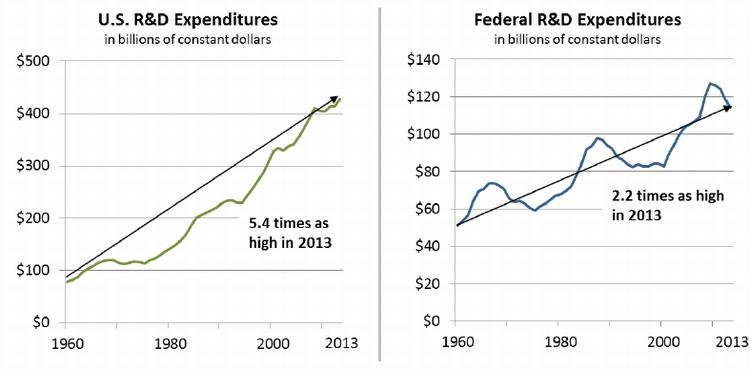
The reduction in U.S. and federal government shares of global R&D did not result from decreased U.S. spending, but from the increased public and private R&D spending of other nations in aggregate. In constant dollars, federal R&D funding in 2013 was 2.2 times its 1960 level, while total U.S. R&D funding in 2013 was 5.4 times its 1960 level (see Figure 8).
Figure 8. Federal and U.S. Expenditures
Source: National Science Foundation, Science and Engineering Indicators 2016, http://nsf.gov/statistics/2016/nsb20161. Figure created by CRS.
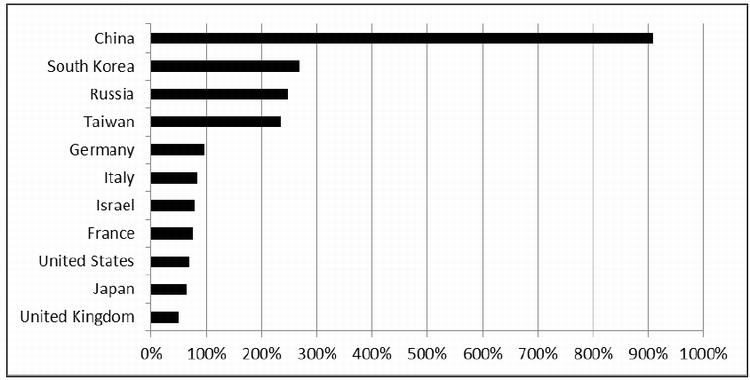
In recent years, China has increased its R&D expenditures at a rapid pace to become the second-largest funder of R&D among nations. Figure 9 shows the growth in R&D expenditures for selected nations since 2000, as reported to the Organization for Economic Cooperation and Development (OECD), and illustrates the rapid growth of China's R&D investments relative to those of other nations.
Figure 9. Growth in Gross Domestic Expenditures on R&D for Selected Nations, 2000-2013
Source: CRS analysis of OECD 2013 Gross Expenditures on R&D (GERD) data. Figure created by CRS.
While the growth shown in Figure 9 is for total R&D funding, not all of which is defense-related, these trends have raised concerns among many defense analysts and senior DOD leaders, such as Under Secretary of Defense Frank Kendall, who testified in January 2015 that:
[O]ver the past few decades, the U.S. and our allies have enjoyed a military capability advantage over any potential adversary.... The First Gulf War put this suite of technologies and the associated operational concepts on display for the world to observe and study. The First Gulf War also marked the beginning of a period of American military dominance that has lasted about a quarter of a century and served us well in several conflicts. We used the same capabilities, with some notable enhancements, in Serbia, Afghanistan, Libya and Iraq. It has been a good run, but the game isn't one sided, and all military advantages based on technology are temporary...
The rise of foreign capability, coupled with the overall decline in U.S. research and development investments, is jeopardizing our technological superiority. |17|
The United States remains the world's single largest funder of R&D, spending 37% more than the next highest funder (China) in 2013 (see Table 2). Global R&D is highly concentrated among a few nations. The 10 nations listed in Table 2 accounted for more than 85% of global R&D reported to the OECD for 2013.
Table 2. Nations with the Largest Gross Domestic Expenditures on R&D, 2013
in billions of current purchasing power parity (PPP) U.S. dollars
Nation Amount United States $457.0 China 333.5 Japan 162.3 Germany 102.6 South Korea 68.1 France 58.0 United Kingdom 41.7 Russia 36.6 Chinese Taipei 30.7 Italy 28.1 Source: CRS analysis of OECD 2013 Gross Expenditures on R&D (GERD) data.
Notes: Purchasing power parity is an economic analysis tool used to adjust international currencies to a common currency (in this case, U.S. dollars) based on each currency's domestic purchasing power.Despite continued U.S. leadership, the gap between the United States and China has been decreasing in recent years. Michael Dumont, Principal Deputy Assistant Secretary of Defense for Special Operations/Low Intensity Conflict, reportedly stated:
Many of our adversaries have acquired, developed and even stolen technologies that have put them on somewhat equal footing with the West in a range of areas... the U.S. government no longer has the leading edge developing its own leading edge capabilities, particularly in information technology. |18|
In the early 1960s, the federal government funded approximately twice as much R&D as U.S. industry and thus played a substantial role in driving U.S. and global technology pathways. Today, U.S. industry funds more than twice as much R&D as the federal government. This transformation has had, and continues to have, implications for federal R&D strategy and management and for the efficacy of the DOD acquisition system. As one general officer stated, whereas the military used to go to industry and tell them to create a technology to meet a requirement, increasingly the military is going to industry and asking them to adapt an existing commercial technology to military requirements. |19|
Where DOD Obligates Contract Dollars
DOD relies on contractors to support operations worldwide, including operations in Afghanistan, permanently garrisoned troops overseas, and ships docking at foreign ports. Because of its global footprint, this report will look at where DOD obligates contract dollars in two ways:
1. by geographic region, and
2. domestic vs. overseas.
What Is Place of Performance?
FPDS defines place of performance as "the location of the principal plant or place of business where the items will be produced, supplied from stock, or where the service will be performed." |20| Foreign place of performance is defined as work produced, supplied, or performed primarily outside of the United States or its territories.
According to DOD, FPDS is required to collect only the predominant place of performance for contract actions. Because FPDS lists only one country for place of performance, contracts listed as being performed in one country can also involve substantial performance in other countries. In 2012, GAO noted that FPDS's inability to provide more granular data entry and analysis limited the "utility, accuracy, and completeness" of the data. |21| In more recent years, however, GAO has determined that FPDS data are "sufficiently reliable for examining trends" in DOD contracting. |22|
By Geographic Region
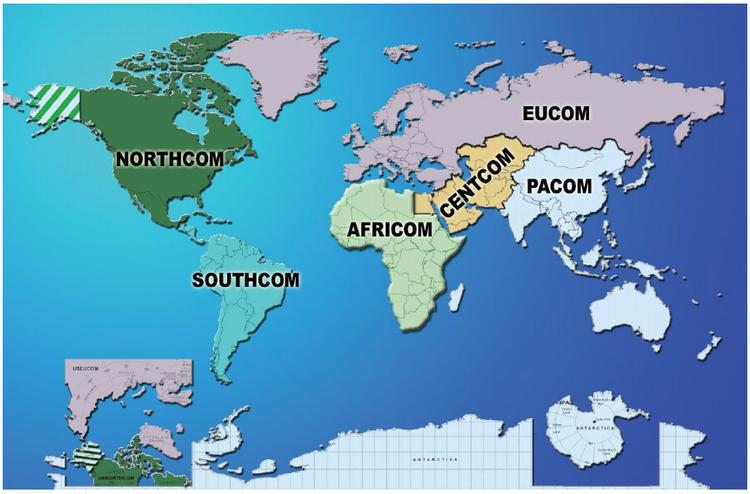
DOD divides its geographic responsibilities among six Unified Combatant Commands: |23|
1. U.S. Northern Command (NORTHCOM), |24|
2. U.S. African Command (AFRICOM),
3. U.S. Central Command (CENTCOM), |25|
4. U.S. European Command (EUCOM),
5. U.S. Pacific Command (PACOM), which includes Hawaii and a number of U.S. territories, |26| and
6. U.S. Southern Command (SOUTHCOM). |27|Figure 10. DOD Combatant Commands' Areas of Responsibility
Source: Map published by Defense Procurement and Acquisition Policy, "Areas of Responsibility" at: http://www.acq.osd.mil/dpap/pacc/cc/areas_of_responsibility.html.
These commands do not control all DOD contracting activity that occurs within their respective geographic regions. For example, Transportation Command (TRANSCOM), headquartered at Scott Air Force Base, IL, may contract with private companies to provide transportation services within CENTCOM's Area of Responsibility (AOR). For purposes of this report, DOD contract obligations are categorized by the place of performance, not the DOD component that signed the contract or obligated the money. For example, all contract obligations for work in the CENTCOM AOR will be allocated to CENTCOM, regardless of which DOD organization signed the contract.
In FY2015, 91.8% of DOD contracts were performed in NORTHCOM (which includes the Bahamas, Canada, and Mexico). DOD obligated 3.7% of total contract work in CENTCOM, followed by PACOM (2.3%), EUCOM (1.8%), AFRICOM (0.2%), and SOUTHCOM (0.1%).
Domestic vs. Overseas
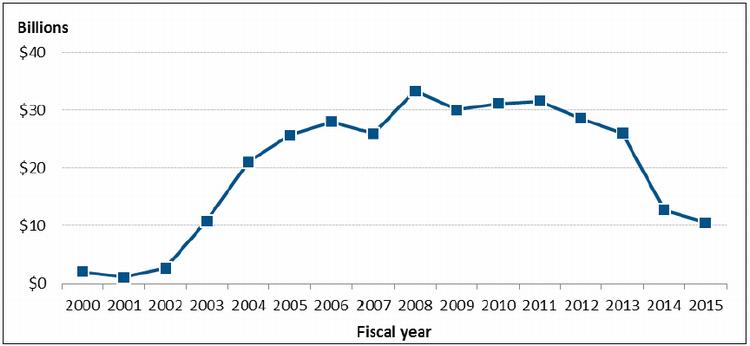
Over the last seven years, DOD obligations for domestic contracts dropped by 35%, from a high of $403 billion in FY2008 to some $261 billion in FY2015; obligations for overseas contracts dropped by 56%, from $49 billion in FY2008 to $22 billion in FY2015. The drop in overseas obligations stems primarily from drawdowns in the Iraq and Afghanistan theaters, where contract obligations decreased from $33 billion in FY2008 to $10 billion in FY2015 (Figure 11). |28|
Figure 11. Contract Obligations in Iraq and Afghanistan Theaters
FY2017 Dollars
Source: CRS Analysis of FPDS data. Figure created by CRS.
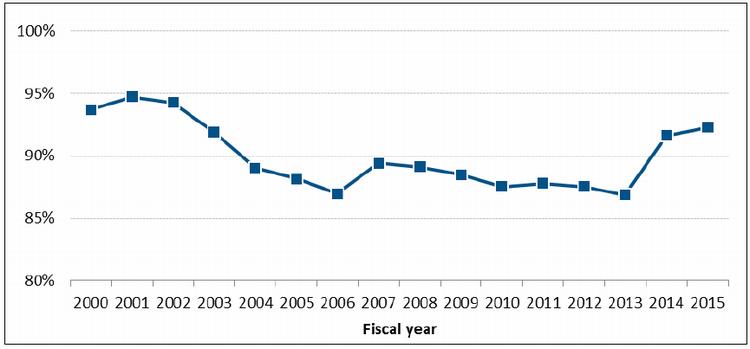
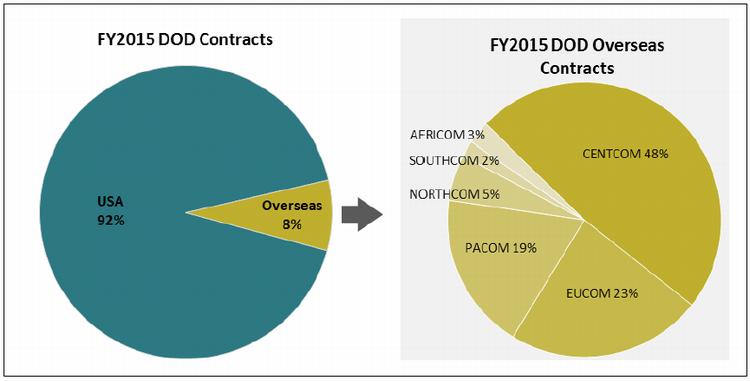
Concurrent with the drawdowns in Iraq and Afghanistan, in recent years the share of DOD contract obligations performed in the United States has increased. In FY2015, 92% of DOD contract obligations were for work performed in the United States, the highest percentage since FY2002 (see Figure 12). |29|
Figure 12. Percentage of DOD Contract Obligations Performed in the United States
(Note that for ease of visualization, axis encompasses only 80% to 100%)
Source: CRS analysis of FPDS data. Figure created by CRS.
Despite the drawdown in Iraq and Afghanistan, in FY2015 DOD contract obligations for work performed overseas were still primarily steered to CENTCOM (48%), followed by EUCOM (23%), PACOM (19%), NORTHCOM (5%), SOUTHCOM (2%), and AFRICOM (3%) (Figure 13). Of the top 20 countries where DOD contractors perform work abroad, nine were in CENTCOM, six were in EUCOM, two were in PACOM, two were in NORTHCOM, and one was in AFRICOM (see Appendix C).
Figure 13. DOD Contract Obligations for Work Performed in Combatant Command Areas of Responsibility
Source: CRS Analysis of FPDS data. Figure created by CRS.
However, a significant shift in where contracting dollars are allocated appears to be underway. Fewer dollars are being obligated in CENTCOM and EUCOM, whereas more dollars are being directed toward PACOM (see Table 3).
Table 3. Obligations for Contracts Performed Overseas
FY2017 Dollars
Unified Combatant Command FY2008 FY2015 Change CENTCOM $33,450,053,445 $10,589,929,321 -68.3% EUCOM $10,651,131,915 $5,050,977,934 -52.6% PACOM $3,076,002,712 $4,056,713,288 31.9% NORTHCOM $1,351,958,905 $1,180,782,016 -12.7% AFRICOM $318,448,938 $582,466,878 82.9% SOUTHCOM $424,656,228 $407,316,425 -4.1% Source: CRS Analysis of FPDS data, April 2016.
Note: FY2008 was selected as the point of comparison because FY2008 is the high point of DOD contract obligations.
a. Does not include contracts performed in the United States and its territories.This trend appears to be consistent with the 2015 National Military Strategy, which discussed moving "forward with the rebalance to the Asia-Pacific region, placing our most advanced capabilities and greater capacity in that vital theater." |30| The National Military Strategy also called for strengthening "institutions across Africa, aimed at fostering stability, building peacekeeping capacity, and countering transregional extremism." |31| For more on the pivot to the Pacific, see CRS Report R42448, Pivot to the Pacific? The Obama Administration's "Rebalancing" Toward Asia, coordinated by Mark E. Manyin.
DOD Overseas Obligations vs. Rest of Government
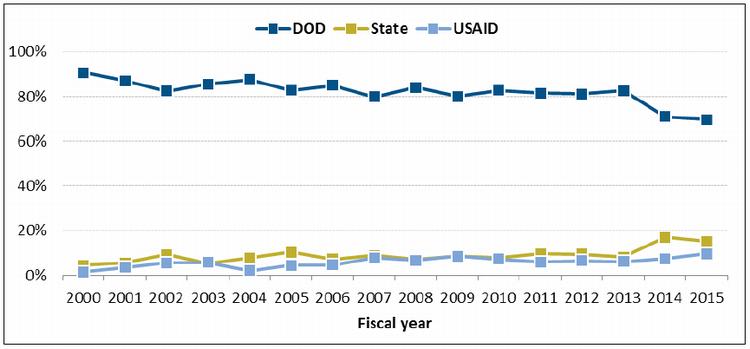
DOD's share of total government obligations for contracts performed abroad has trended down from 91% in FY2000 to 70% in FY2015. Over the same period, combined Department of State and USAID contract obligations increased from 6% to 25% of all U.S. government overseas obligations (see Figure 14).
Figure 14. DOD's Proportion of Total U.S. Government Contract Work Performed Overseas
Source: CRS Analysis of FPDS data. Figure created by CRS.
Notes: USAID was established as an independent agency in I96I, but receives overall foreign policy guidance from the Secretary of State.A number of analysts have argued that as a result of its larger budget and workforce, DOD often undertakes traditionally civilian missions because other agencies do not have the necessary resources to fulfill those missions. |32| Some argue that more resources should be invested into civilian agencies to allow them to play a larger role in conflict prevention, post-conflict stabilization, and reconstruction. In 2010, the Senate Foreign Relations Committee majority staff wrote, "The civilian capacity of the U.S. Government to prevent conflict and conduct post-conflict stabilization and reconstruction is beset by fragmentation, gaps in coverage, lack of resources and training, coordination problems, unclear delineations of authority and responsibility, and policy inconsistency." |33|
Many of these analysts have argued that to achieve its foreign policy goals, the United States needs to take a more whole-of-government approach that brings together the resources of, among others, DOD, the Department of State, and USAID–and government contractors. Then-Secretary of Defense Robert Gates echoed this approach when he argued, in 2007, for strengthening the use of soft power in national security through increased nondefense spending. As Secretary Gates stated:
What is clear to me is that there is a need for a dramatic increase in spending on the civilian instruments of national security–diplomacy, strategic communications, foreign assistance, civic action, and economic reconstruction and development.... We must focus our energies beyond the guns and steel of the military, beyond just our brave soldiers, sailors, Marines, and airmen. We must also focus our energies on the other elements of national power that will be so crucial in the coming years. |34|
Contract obligations since FY2000 may indicate a shift toward a whole-of-government approach to achieving foreign policy objectives.
Reliability of Data on Contract Obligations
The GAO, CRS, and other organizations have raised some concerns about the accuracy of DOD procurement data retrieved from the Federal Procurement Data System (FPDS). For detailed information on the history of FPDS data validity concerns, recent and current issues, and planned changes to the system, see Appendix A.
Appendix A. FPDS Background, Accuracy Issues, and Future Plans
According to the Federal Acquisition Regulation, FPDS can be used to measure and assess "the effect of Federal contracting on the Nation's economy and ... the effect of other policy and management initiatives (e.g., performance based acquisitions and competition)." |35| FPDS is also used to meet the requirements of the Federal Funding Accountability and Transparency Act of 2006 (P.L. 109-282), which requires all federal award data to be publicly accessible.
Congress, legislative and executive branch agencies, analysts, and the public all rely on FPDS as the primary source of information for understanding how and where the federal government spends contracting dollars. Congress and the executive branch rely on the information to help make and oversee informed policy and spending decisions. Analysts and the public rely on the data in FPDS to conduct analysis and gain visibility into government operations.
Data reliability is essential to the utility of FPDS. As GAO has stated, "[R]eliable information is critical to informed decision making and to oversight of the procurement system." |36| According to officials within the White House's Office of Federal Procurement Policy, "[c]omplete, accurate, and timely federal procurement data are essential for ensuring that the government has the right information when planning and awarding contracts and that the public has reliable data to track how tax dollars are being spent." |37| If the data contained in FPDS are not sufficiently reliable, the data may not provide an appropriate basis for measuring or assessing federal contracting, making policy decisions, or providing transparency into government operations. The result could be the implementation of policies that squander resources and waste taxpayer dollars. According to GAO, "[f]ederal agencies are responsible for ensuring that the information reported in [the FPDS] database is complete and accurate." |38|
History of FPDS
On August 30, 1974, Congress enacted the Office of Federal Procurement Policy Act, which established an Office of Federal Procurement Policy (OFPP) within OMB and required the establishment of "a system for collecting, developing, and disseminating procurement data which takes into account the needs of Congress, the executive branch, and the private sector." |39| One of the goals of establishing a system for tracking procurement data was to "promote economy, efficiency, and effectiveness in the procurement of property and services." |40|
In February 1978, the OFPP issued a government-wide memorandum that designated the Department of Defense as the executive agent to operate the Federal Procurement Data System. |41| Agencies were instructed to begin collection of procurement data on October 1, 1978, and to report the data to DOD in February 1979. |42| Since 1982, the GSA has operated the system on behalf of the OFPP. |43| Today, FPDS is the only government-wide, system that contains all publicly available federal procurement data. FDPS data are used by other federal-spending information resources, including USASpending.gov.
Almost from FPDS's inception, the GAO expressed concerns about the accuracy of the information in the database. |44| OMB attempted to eliminate many of the errors in FPDS by introducing a successor system–the Federal Procurement Data System-Next Generation (FPDS), which began operation on October 1, 2003. |45| FPDS was to "rely less on manual inputs and more on electronic 'machine-to-machine' approaches." |46| Despite the systems update, GAO said "[i]nformation in FPDS can only be as reliable as the information agencies enter though their own systems." |47|
In September 29, 2009, testimony before the Senate Homeland Security and Governmental Affairs Subcommittee on Contracting Oversight, William T. Woods, GAO's Director of Acquisition and Sourcing Management, said the following about FPDS information:
Our past work has found that federal contracting data systems, particularly FPDS-NG, contain inaccurate data. FPDS-NG is the primary government contracting data system for obligation data. Despite its critical role, GAO and others have consistently reported on FPDS-NG data quality issues over a number of years. |48|
A 2012 GAO report reiterated its finding that DOD needs to "obtain better data on its contracted services to enable it to make more strategic workforce decisions and ensure that it maintains appropriate control of government operations." |49|
Data Reliability Concerns Persist
According to GSA, agencies are required to validate their data annually. Agency statements regarding data accuracy are independent of the FPDS systems and outside the authority of GSA. For DOD specifically, components (at the service branch level) are required to submit to Defense Procurement and Acquisition Policy (DPAP) an annual certification of reported data, summary of data verification and validation efforts, and Agency FPDS Data Quality Certifications. |50|
GAO has repeatedly raised concerns over the accuracy, limitations, and reliability of the data contained in the FPDS database. |51| According to GAO, FPDS often contains data with limited "utility, accuracy, and completeness." |52| The Office of Management and Budget (OMB) has also released guidance requiring executive branch agencies to implement GAO recommendations seeking to improve FPDS data quality. |53| Continued concerns raised over the reliability of data have prompted many analysts to rely on FPDS primarily to identify broad trends and make rough estimations. According to one GAO report:
DOD acknowledged that using FPDS-NG as the main data source for the inventories has a number of limitations. These limitations include that FPDS-NG does not provide the number of contractor FTEs performing each service, identify the requiring activity, or allow for the identification of all services being procured. |54|
Officials from the GSA, the agency that administers FPDS, stated that data errors in FPDS do not substantively alter the larger context of 1.4 million actions and billions of dollars of obligations entered into the system by DOD every year. Officials have also indicated that whenever possible and feasible, steps are taken to improve the reliability and integrity of the data contained in FPDS. For example, in FY2011, CRS reported on specific data reliability concerns regarding contracts listed as having been performed overseas that were actually performed in the United States. |55| DOD addressed the data error by reviewing past data and correcting coding errors. |56| To prevent similar coding errors in the future, a rule change was implemented requiring agencies to adopt three-letter International Organization for Standardization (ISO) codes when coding a particular country into FPDS. |57|
Other data deficiencies appear more consequential. According to DOD officials, the obligations for FY2008 are "artificially higher by $13B and the FY09 number is artificially lower by $13B" due to over-obligation on a single contract. DOD went on to note that the money obligated in FY2008 was never spent and that "this is a known error and even had a note in FPDS for a while." |58| Such an error, particularly without an easily identifiable notation, significantly affects analyses of DOD spending trends, including the analysis in this report.
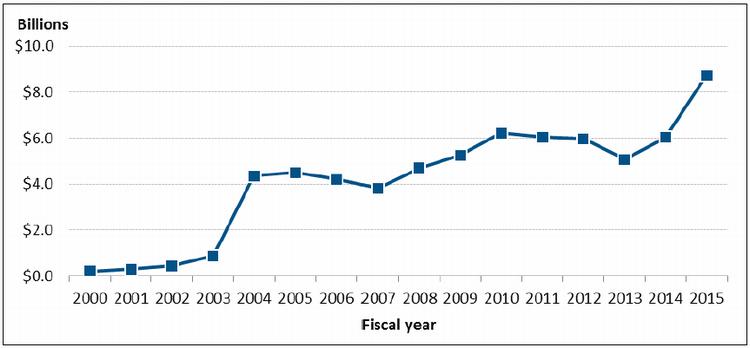
In a more recent example of data inconsistency within FPDS, CRS identified a discrepancy of approximately $9 billion in FY2015 when users employed different methods to extract data from the FPDS database. Although the two methods presumably access the same dataset, in some cases when data were extracted using the system's "standard report," it produced a total dollar value significantly lower than that extracted when using the system's "ad hoc report." The reason for the data discrepancy appears to be that in cases when an agency does not report the place of performance of the contract, the "standard report" omits the contract from search results entirely. |59| Those accessing the data, however, could be unaware of the omissions.
When asked about this particular data discrepancy, GSA stated that the difference was a "feature of the data." |60| CRS extracted FPDS data via both the "standard report" and the "ad hoc report" for all fiscal years available and calculated the resulting discrepancies over time. Figure A-1 shows the dollar value of the discrepancy between the two search methods.
Figure A-1. Discrepancy in Different Methods for Calculating Total Contract Obligations, FY2000-FY2015
(not adjusted for inflation)
Source: CRS analysis of FPDS data.
Notes: The discrepancy occurs when a user searches for total contracting obligations and requests that the online system sort the data by the place in which the contract was performed. In some cases, when a user employs the "standard report," option within the database, the search yields a lower result than when a user employs the "ad hoc report." Both reports, however, presumably access the same underlying data source to produce their results. The reason for the data discrepancy appears to be that in cases when an agency does not report the place of performance of the contract, the "standard report" omits the contract from search results entirely.Another recent issue affecting FPDS data reliability is that of the Defense Commissary Agency (DeCA), which stopped reporting most of its action obligations in FY2013. Between FY2012 and FY2013, DeCA stopped reporting all procurement of brand-name goods for resale–about $5 billion per year total. Over that period, CRS analysis of FPDS's reported change in Department of Defense contract obligations showed a decrease of approximately $53 billion. The actual reduction, however, was closer to $48 billion because of the obligations that DeCA was no longer reporting. In FY2015, DeCA also ceased reporting procurement of non-brand-name goods for resale, leading to a further annual decrease in reported DOD contract obligations of about $1 billion. |61|
In early 2016, CRS noted discrepancies in reported contract obligations associated with public-private competitions under OMB Circular A-76. |62| Despite a prohibition on new public-private competitions under Circular A-76 (see P.L. 111-8, the FY2009 Omnibus Appropriations Bill), FPDS reported a large number of contracts in this category in each subsequent fiscal year. DOD reported that A-76 contracts, for example, represented approximately 1% of all contract obligations in FY2013, FY2014, and FY2015 (roughly $3 billion in each fiscal year). |63| When asked for clarification, DOD's Defense Procurement and Acquisition Policy office stated that the majority of these contract obligations were in fact coding errors in FPDS. |64| As of September 2016, CRS observed that DOD's FPDS-reported A-76 obligations were restated, to approximately $150 million per year from FY2013-FY2015.
Despite the limitations of FPDS, imperfect data may be better than no data. Some observers say that despite its shortcomings, FPDS is one of the world's leading systems for tracking government procurement data. FPDS data can be used to identify some broad trends and rough estimations, or to gather information about specific contracts. Understanding the limitations of data–knowing when, how, and to what extent to rely on data–could help policymakers incorporate FPDS data more effectively into their decision-making process.
GSA Efforts to Improve FPDS
According to GSA, a number of data systems, including FPDS, are undergoing a significant overhaul. The FPDS overhaul is a multi-year process, expected to improve the reliability, precision, retrieval, and utility of the information contained in the data systems. Part of the effort includes focus groups with stakeholders, including agency decision-makers and congressional staff, to solicit feedback on how to improve the reliability, usability, and relevance of the data stored in the systems being updated. CRS analysts participated in focus groups. While no date has been set for completing this effort, officials believe that the upgrades will be implemented sometime in 2017 or 2018.
The extent to which GSA and federal agencies succeed in their efforts to improve the accuracy, reliability, and usability of FPDS will determine whether Congress and senior executive branch officials will have access to reliable and timely data that can be used to make budget and policy decisions.
Appendix B. Obligations Trends by PSC
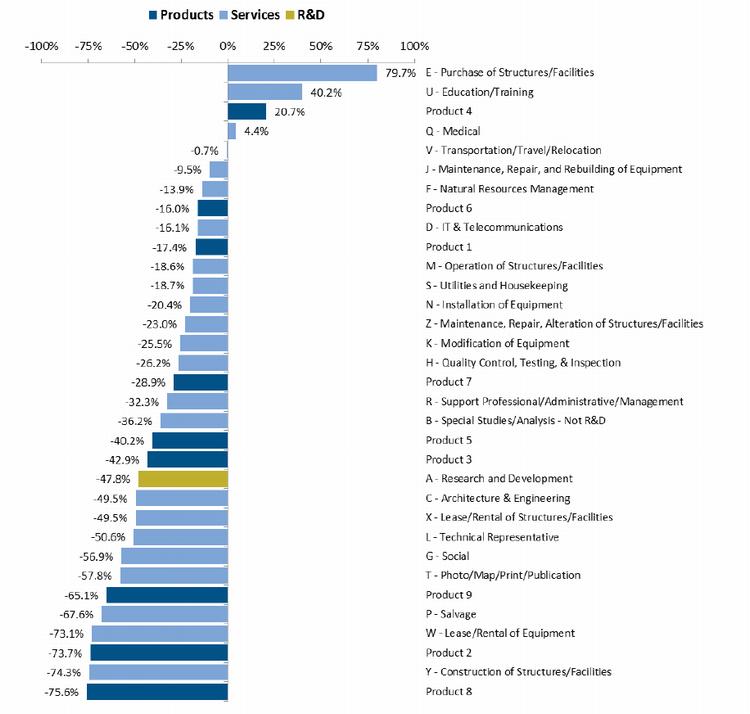
Product and service codes (PSCs) are used "to describe the products, services, and research and development (R&D) purchased by the federal government." |65| FPDS sorts contract obligations into 33 overarching PSCs: nine product codes, 23 service codes, and one R&D code. Each of the nine product codes are represented by numbers from 1 -9. Each of the service codes is represented by a single letter, and R&D is represented by the letter "A." Figure B-1 depicts changes in DOD contract obligations by PSC, from FY2008-FY2015.
Each of the 33 PSCs for services has a description identifying the types of contracts contained in the category; the nine PSCs for products do not have a description. Without a clear and logical system for categorizing products into overarching PSC categories–including descriptions for each category–sorting such data is of limited value. To better understand what is contained in each product category, see the notes for Figure B-1.
Figure B-1. Change in DOD Contract Obligations by PSC Code
(Adjusted for inflation, percentage change between FY2008 and FY2015)
Source: Figure created by CRS.
Notes: Each two number code listed below corresponds to one of the nine product codes represented in the figure. Codes beginning with a 1 are in the Product 1 category; codes beginning with a 2 are in the Product 2 category, etc. Services are self-explanatory (see descriptions in figure).12 - Fire Control Equipment
13 - Ammunitions and Explosives
14 - Guided Missiles
15 - Aircraft and Airframe Structural Components
16 - Aircraft Components and Accessories
17 - Aircraft Launching/Landing/Ground Handling Equip.
18 - Space Vehicles
19 - Ships, Small Craft, Pontoons, and Floating Docks
20 - Ship and Marine Equipment
22 - Railway Equipment
23 - Ground Vehicles, Motor Vehicles, Trailers, Cycles
24 - Tractors
25 - Vehicular Equipment Components
26 - Tires and Tubes
28 - Engines, Turbines, and Components
29 - Engine Accessories
30 - Mechanical Power Transmission Equipment
31 - Bearings
32 - Woodworking Machinery and Equipment
34 - Metalworking Machinery
35 - Service and Trade Equipment
36 - Special Industry Machinery
37 - Agricultural Machinery and Equipment
38 - Construction, Mining, Excavating, Highway Maint.
39 - Materials Handling Equipment
40 - Rope, Cable, Chain, and Fittings
41 - Refrigeration, Air Conditioning Equip.
42 - Fire Fighting, Rescue, and Safety Equipment
43 - Pumps and Compressors
44 - Furnace/Steam Plant/Drying Equip, Nuclear Reactors
45 - Plumbing, Heating, and Sanitation Equipment
46 - Water Purification and Sewage Treatment Equipment
47 - Pipe, Tubing, Hose, Fittings
48 - Valves
49 - Maintenance and Repair Shop Equipment
51 - Hand Tools
52 - Measuring Tools
53 - Hardware and Abrasives
54 - Prefabricated Structures and Scaffolding
55 - Lumber, Millwork, Plywood, and Veneer
56 - Construction and Building Materials
58 - Communications, Detection and Coherent Radiation
59 - Electrical and Electronic Equipment Components
60 - Fiber Optics Materials and Components
61 - Electric Wire, and Power and Distribution Equipment
62 - Lighting Fixtures and Lamps
63 - Alarm, Signal, and Detection Systems
65 - Medical, Dental, and Veterinary Equipment
66 - Instruments and Laboratory Equipment
67 - Photographic Equipment
68 - Chemicals and Chemical Products
69 - Training Aids and Devices
70 - ADP Equipment Software, Supplies, Equipment
71 - Furniture
72 - Household/Commercial Furnishings and Appliances
73 - Food Preparation and Serving Equipment
74 - Office Machines
75 - Office Supplies and Devices
76 - Books, Maps, and Other Publications
77 - Musical Instruments
78 - Recreational and Athletic Equipment
79 - Cleaning Equipment and Supplies
80 - Brushes, Paints, Sealers, and Adhesives
81 - Containers, Packaging, and Packing Supplies
83 - Textiles/Leather/Furs/Apparel/Shoes/Tents/Flags
84 - Clothing, Individual Equipment, and Insignia
85 - Toiletries
87 - Agricultural Supplies
88 - Live Animals
89 - Subsistence (Food)
91 - Fuels, Lubricants, Oils, and Waxes
93 - Nonmetallic Fabricated Materials
94 - Nonmetallic Crude Materials
95 - Metal Bars, Sheets, and Shapes
96 - Ores, Minerals, and Their Primary Products 99 - Miscellaneous
Appendix C. Top 20 Foreign Countries Where DOD Obligates Contracting Dollars
Table C-1. Top 20 Foreign Countries, by Place of Performance
FY2017 dollars
Rank 2008 Rank 2015 Country FY2015 FY2008 Unified Combatant Command 2 1 Afghanistan $3,166,769,972 $5,968,667,913 CENTCOM 1 17 Iraq $241,643,677 $15,177,845,112 CENTCOM 17 2 Saudi Arabia $2,028,670,135 $317,070,425 CENTCOM 4 3 Germany $2,028,661,586 $2,937,166,840 EUCOM 3 4 Kuwait $1,942,070,872 $4,163,319,093 CENTCOM 10 5 Japan $1,818,727,734 $856,523,801 PACOM 6 6 South Korea $1,573,340,049 $1,479,993,769 PACOM 8 7 United Arab Emirates $1,251,771,816 $1,119,358,573 CENTCOM 38 8 Bahamas $655,719,810 $54,378,165 NORTHCOM 7 9 Bahrain $534,313,012 $1,125,015,692 CENTCOM 9 10 Canada $458,581,511 $1,082,062,152 NORTHCOM 5 11 United Kingdom $430,560,130 $1,831,150,224 EUCOM 12 12 Italy $352,267,295 $667,456,686 EUCOM 19 13 Spain $327,010,388 $212,393,737 EUCOM 18 14 France $323,553,505 $241,094,507 EUCOM 15 15 Qatar $314,043,615 $395,948,762 CENTCOM 25 16 Djibouti $264,634,684 $148,145,390 AFRICOM 22 18 Israel $214,733,118 $173,476,684 CENTCOM 30 19 Jordan $197,561,082 $77,883,341 CENTCOM 23 20 Turkey $196,617,296 $163,029,406 EUCOM Source: FPDS, April 2016.
[Source: By Moshe Schwartz, John F. Sargent Jr., Gabriel M. Nelson and Ceir Coral, Congressional Research Service, R44010, Washington D.C., 20Dec16. Moshe Schwartz is a Specialist in Defense Acquisition; John F. Sargent Jr. is a Specialist in Science and Technology Policy; Gabriel M. Nelson is a Research Assistant; Ceir Coral is a National Defense Fellow.]
Notes:
1. CRS Report 98-721, Introduction to the Federal Budget Process, coordinated by James V. Saturno. The Government Accountability Office (GAO) defines an obligation as "a definite commitment that creates a legal liability of the government for the payment of goods and services ordered or received, or a legal duty on the part of the United States that could mature into a legal liability by virtue of actions on the part of the other party beyond the control of the United States. Payment may be made immediately or in the future. An agency incurs an obligation, for example, when it places an order, signs a contract, awards a grant, purchases a service, or takes other actions that require the government to make payments to the public or from one government account to another." U.S. Government Accountability Office, A Glossary of Terms Used in the Federal Budget Process, GAO-05-734SP, September 1, 2005. [Back]
2. Federal Acquisition Regulation "Subpart 4.6–Contract Reporting," Section 4.602, at https://www.acquisition.gov/far/html/Subpart%204_6.html. [Back]
3. U.S. General Services Administration, "Reportable/Nonreportable Contract Actions," at https://www.fpds.gov/help/Reportable_Nonreportable_Contract_Actions.htm.= [Back]
4. Electronic Code of Federal Regulations, 48 C.F.R. §2.101 - Definitions: http://www.ecfr.gov/cgi-bin/text-idx?node=sp48.1.2.2_11. [Back]
5. U.S. Government Accountability Office, Defense Contracting: Improved Policies and Tools Could Help Increase Competition on DOD's National Security Exception Procurements, GAO-12-263, January 2012, p. 11, at http://www.gao.gov/assets/590/587681.pdf. Based also on CRS review of data found in FPDS-NG. [Back]
6. Office of Management and Budget, Budget of the U.S. Government, Fiscal Year 2017, Historical Tables. Budget data based on outlays. Given the difference between outlays and obligations, this comparison is only intended to illustrate a rough magnitude of contract obligations within the context of overall federal government spending. Another method to quantify contracting as a percentage of government spending would be to compare contract obligations to the $3.795 trillion Net Obligations Incurred (offsetting collections and receipts) for all branches, as found in Office of Management and Budget, Fiscal Year 2017 Object Class Analysis: Budget of the U.S. Government, Fiscal Year 2017, Table 3-Bridge From Gross to Net Obligations. This alternate method would not appreciably alter the results provided in this report.
For an overview of the distinction between budget authority, obligations, and outlays, see CRS In Focus IF10453, The Federal Budget: Understanding Fiscal Outcomes, by Grant A. Driessen and D. Andrew Austin. [Back]
7. Deflators for converting into constant dollars derived from Office of the Under Secretary of Defense (Comptroller), Department of Defense, National Defense Budget Estimates for FY2017, "Department of Defense Deflators - TOA By Category 'Total Non-Pay,'" Table 5-5, p. 58-59, April 2016, at http://comptroller.defense.gov/Budget-Materials. [Back]
8. Discussing the need to prioritize spending and make strategically informed decisions when cutting defense spending, Todd Harrison wrote
CSBA has conducted a number of strategic choices exercises throughout the defense community challenging participants to develop a BCA-constrained strategy and defense program. Rather than simply cutting programs and forces to meet budget constraints, most teams have used the cuts as a forcing mechanism to rebalance DOD's portfolio of capabilities. While the strategies and associated priorities pursued by teams have differed, a common theme has been the need to make strategically informed investment and divestment decisions rather than just shrinking the size of the current force.
See Todd Harrison, Analysis of the FY 2015 Defense Budget, Center for Strategic and Budgetary Assessments, September 5, 2014, p. 30, at http://csbaonline.org/research/publications/analysis-of-the-fy2015-defense-budget. [Back]
9. For more information on the Budget Control Act, see CRS Report R42506, The Budget Control Act of 2011 as Amended: Budgetary Effects, by Grant A. Driessen and Marc Labonte. [Back]
10. Robert Hale, "Sequestration: Don't Believe All the Hype," Breaking Defense, February 19, 2015, at http://breakingdefense.com/2015/02/sequestration-dont-believe-all-the-hype. [Back]
11. In response to a CRS query on the nature of the rise and fall in DOD contract obligations, DOD said: "DOD funding exhibit cycles of increases and decreases. We are just now coming off a decrease, and that is affecting contract obligation levels. Funding cycles (and, more importantly, near-term changes such as sequestration) make budgeting difficult because DOD capabilities (acquisition programs, force structure, military personnel, operational support) often take many years to change" [sic]. [Back]
12. For a more detailed discussion of RDT&E spending, see CRS Report R44516, Federal Research and Development Funding: FY2017, coordinated by John F. Sargent Jr. [Back]
13. National Science Foundation, National Center for Science and Engineering Statistics, Survey of Federal Funds for Research and Development, FYs 2014-16, Data Tables, Table 31, April 20, 2016, https://ncsesdata.nsf.gov/fedfunds/2014/html/FFS2014_DST_031.html. [Back]
14. Department of Defense, Office of the Under Secretary of Defense for Acquisition, Technology, and Logistics, Report of the Defense Science Board Task Force on Basic Research, January 2012, p.9, http://www.acq.osd.mil/dsb/reports/BasicResearch.pdf. [Back]
15. RDT&E budget activities are broad categories reflecting different types of RDT&E efforts. The seven RDT&E budget activities are Basic Research, Applied Research, Advanced Technology Development, Advanced Component Development and Prototypes, System Development and Demonstration, RDT&E Management Support, and Operational System Development. [Back]
16. Not all RDT&E categories have followed the same pattern. According to Todd Harrison, analyst from the Center for Strategic and Budgetary Assessments: "Two areas of RDT&E funding have trended upward throughout the overall budget cycle: classified R&D and basic research. While both are cut slightly in FY 2015, they remain well above their pre-build-up levels." Todd Harrison, Analysis of the FY 2015 Defense Budget, Center for Strategic and Budgetary Assessments, 2014, pp. 24-25. [Back]
17. Written Statement of Under Secretary of Defense Frank Kendall, U.S. Congress, House Committee on Armed Services, A Case for Reform: Improving DOD's Ability to Respond to the Pace of Technological Change, 114th Cong., 1st sess., January 28, 2015. [Back]
18. Stew Magnuson, "DOD Official: Government Has Lost its Technological Edge Over Opponents," National Defense Magazine, January 27, 2015, at http://www.nationaldefensemagazine.org/Pages/default.aspx. [Back]
19. Based on discussion with CRS analyst, May 8, 2013. [Back]
20. General Services Administration, Federal Procurement Data System-Next Generation (FPDS) Data Element Dictionary, version 1.4, p. 98, June 22, 2016, at https://www.fpds.gov/downloads/Version_1.4_specs/FPDSNG_DataDictionary_V1.4.pdf. [Back]
21. U.S. Government Accountability Office, Defense Acquisitions: Further Actions Needed to Improve Accountability for DOD's Inventory of Contracted Services, GAO-12-357, April 2012, Highlights, at http://www.gao.gov/assets/590/589951.pdf. [Back]
22. U.S. Government Accountability Office, DOD Service Acquisition: Improved Use of Available Data Needed to Better Manage and Forecast Service Contract Requirements, February 2016, at http://www.gao.gov/assets/680/675276.pdf. [Back]
23. U.S. Department of Defense, "Unified Combatant Commands: Unified Command Plan," at: http://www.defense.gov/Military-Services/Unified-Combatant-Commands. [Back]
24. NORTHCOM includes the United States, Mexico, Canada, and the Bahamas. [Back]
25. CENTCOM includes Middle Eastern and central Asian countries, such as Egypt, Israel, Iraq, Afghanistan, Iran, Tajikistan, and Uzbekistan. [Back]
26. U.S. territories in PACOM include American Samoa, Guam, Wake Island, and Johnson Atoll. [Back]
27. SOUTHCOM includes South American countries. [Back]
28. Based on Congressional Budget Office (CBO) methodology, the Iraqi theater includes Iraq, Bahrain, Jordan, Kuwait, Oman, Qatar, Saudi Arabia, Turkey, and the United Arab Emirates. See Congressional Budget Office, Contractors' Support of U.S. Operations in Iraq, August 2008, p. 3. For purposes of this analysis, the Afghan theater includes Afghanistan, Kazakhstan, Kyrgyzstan, Pakistan, Tajikistan, Turkmenistan, and Uzbekistan. [Back]
29. For purposes of this report, U.S. territories (including American Samoa, Guam, Northern Mariana Islands, Puerto Rico, the U.S. Virgin Islands, Johnston Atoll, and Wake) are deemed domestic spending. For a list of U.S. territories, see http://www.doi.gov/oia/islands/politicatypes.cfm. [Back]
30. 2015 National Military Strategy, p. 9, http://www.jcs.mil/Portals/36/Documents/Publications/2015_National_Military_Strategy.pdf. [Back]
32. In FY2009, the height of DOD spending during the conflicts in Iraq and Afghanistan, DOD had a base budget of $515.4 billion, more than 13 times the combined budgets of the Department of State, the U.S. Agency for International Development (USAID), and other foreign affairs agencies. In addition, DOD had a total workforce of more than 2.4 million, nearly 70 times the combined workforce of the Department of State and USAID. As a result of resource allocation, the Commission on Wartime Contracting in Iraq and Afghanistan stated that "Defense has become heavily engaged in stabilization and reconstruction–tasks seen as more akin to development than warfighting". See: Commission on Wartime Contracting in Iraq and Afghanistan, Transforming Wartime Contracting, Controlling costs, reducing risks, August 31, 2011, p. 132. [Back]
33. Senate Foreign Relations Committee, Discussion Paper on Peacekeeping, Majority Staff, April 8, 2010. [Back]
34. Remarks delivered by Secretary of Defense Robert M. Gates at Manhattan, KS, November 26, 2007. [Back]
35. FAR Subpart 4.602(2) and 4.602(4). [Back]
36. U.S. General Accounting Office, Reliability of Federal Procurement Data, GAO-04-295R, December 30, 2003, p. 1, at http://www.gao.gov/assets/100/92399.pdf. [Back]
37. Daniel I. Gordon, Improving Federal Procurement Data Quality–Guidance for Annual Verification and Validation, Executive Office of the President, Office of Federal Procurement Policy, Washington, DC, May 31, 2011, at http://www.whitehouse.gov/sites/default/files/omb/procurement/memo/improving-data-quality-guidance-for-annual-verification-and-validation-may-2011.pdf. [Back]
38. Government Accountability Office, Opportunities Remain to Incorporate Lessons Learned as Availability of Spending Data Increases, September 2013, at http://www.gao.gov/assets/660/657826.pdf. [Back]
39. P.L. 93-400, §6(d)(5). [Back]
40. Ibid., §2. The section also states that Congress has a policy interest in "avoiding or eliminating unnecessary overlapping or duplication of procurement and related activities" and in "coordinating procurement policies and programs of the several departments and agencies." [Back]
41. U.S. General Accounting Office, The Federal Procurement Data System–Making it Work Better, April 18, 1980, p. 3, at http://archive.gao.gov/f0202/112171.pdf. [Back]
43. Letter from Katherine V. Schinasi, Managing Director, Acquisition and Sourcing Management, Government Accountability Office, to The Honorable Joshua B. Bolten, Director, Office of Management and Budget, September 27, 2005, GAO-05-960R, p. 2, at http://www.gao.gov/new.items/d05960r.pdf. [Back]
44. For example, in an October 1979 letter to former Representative Herbert E. Harris, II, then-Comptroller General Elmer B. Staats wrote of FPDS that "the extent of completion and accuracy varies for the different agencies involved." Moreover he wrote, "the Federal Procurement Data System relies on the integrity of many individuals to prepare the Individual Procurement Action reports ... and to prepare them correctly." Letter from Elmer B. Staats, Comptroller General of the United States, to The Honorable Herbert E. Harris, II, Chairman, Subcommittee on Human Resources of the Committee on Post Office and Civil Service, October 12, 1979, GAO/PSAD-79-109, pp. 1-2, at http://archive.gao.gov/d46t13/110552.pdf. In an August 19, 1994 report, GAO wrote "we found that the [Federal Procurement Data] Center does not have standards detailing the appropriate levels of accuracy and completeness of FPDS data.... [U]sers have identified instances where contractor names and dollar amounts were erroneous. We believe developing standards for FPDS data accuracy and completeness, then initiating a process to ensure that these standards are met, would improve data accuracy and completeness." U.S. General Accounting Office, OMB and GSA: FPDS Improvements, GAO.AIMD-94-178R, August 19, 1994, p. 2, at http://archive.gao.gov/t2pbat2/152380.pdf. In a September 27, 2005, report, GAO wrote that "GSA has not informed users about the extent to which agencies' data are accurate and complete. This lack of confirmation perpetuates a lack of confidence in the system's ability to provide quality data." Letter from Katherine V. Schinasi, Managing Director, Acquisition and Sourcing Management, Government Accountability Office, to the Honorable Joshua B. Bolten, Director, Office of Management and Budget, September 27, 2005, GAO-05-960R, at http://www.gao.gov/new.items/d05960r.pdf. [Back]
45. Letter from William T. Woods, Director, Acquisition and Sourcing Management, Government Accountability Office, to The Honorable Joshua B. Bolten, Director, the Office of Management and Budget, December 30, 2003, p. 3, at http://www.gao.gov/new.items/d04295r.pdf. FPDS was designed, maintained, and updated by Global Computer Enterprises, Inc., through a contract with GSA. [Back]
46. Ibid. According to GAO, most agencies were "expected to have computerized contract writing systems that [would] allow for direct submission of data to FPDS. Reliability of data [were] expected to improve because agency submissions to FPDS-NG [would] be based on data already in the contract writing systems, reducing or eliminate separate data entry requirements. The system provides for immediate data verification to detect errors. If errors are detected, agency procurement officials will have the opportunity to correct them immediately while the information is still readily available." [Back]
48. U.S. Government Accountability Office, Federal Contracting: Observations on the Government's Contracting Data Systems, GAO-09-1032T, September 29, 2009, p. 3, at http://www.gao.gov/new.items/d091032t.pdf. [Back]
49. U.S. Government Accountability Office, Defense Acquisitions: Further Actions Needed to Improve Accountability for DOD's Inventory of Contracted Services, GAO-12-357, April 2012, Highlights, at http://www.gao.gov/assets/590/589951.pdf. [Back]
50. U.S. Department of Defense, "Federal Procurement Data System (FPDS) Contract Reporting Data Improvement Plan," Section 4.0 Step 10, January 12, 2010: http://www.acq.osd.mil/dpap/pdi/eb/docs/OSD_Data_Improvement_Plan_v1-3.pdf.
Agency FPDS Data Quality Certification documents can be found on DPAP's website. See the FY2016 version at: http://www.acq.osd.mil/dpap/pdi/eb/docs/FY16_OSD_Data_Improvement_Cert_(ffinal)_Exhibit_J_%2020160121.doc. [Back]
51. See U.S. Government Accountability Office, Improvement Needed to the Federal Procurement Data System-Next Generation, GAO-05-960R, September 27, 2005, at http://gao.gov/assets/100/93613.pdf; U.S. Government Accountability Office, Federal Contracting: Observations on the Government's Contracting Data Systems, GAO-09-1032T, September 29, 2009, at http://www.gao.gov/assets/130/123442.pdf; U.S. Government Accountability Office, Continued Management Attention Needed to Enhance Use and Review of DOD's Inventory of Contracted Services, GAO-13-491, May 23, 2013, at http://gao.gov/assets/660/654814.pdf. [Back]
52. U.S. Government Accountability Office, Defense Acquisitions: Further Actions Needed to Improve Accountability for DOD's Inventory of Contracted Services, GAO-12-357, April 2012, Highlights, at http://www.gao.gov/assets/590/589951.pdf. See also, U.S. Government Accountability Office, Federal Contracting: Observations on the Government's Contracting Data Systems, GAO-09-1032T, September 29, 2009, at http://gao.gov/assets/130/123442.pdf. In addition to this testimony, GAO has repeatedly made recommendations to improve FPDS data quality and reliability, including, for example, recommending that "OMB work with agencies to implement systems for contract writing that connect directly to FPDS-NG and provide confirmation of agencies' review and verification of the accuracy and completeness of their data in FPDS-NG." (U.S. Government Accountability Office, Data Transparency: Oversight Needed to Address Underreporting and Inconsistencies on Federal Award Website, GAO-14-476, June 2014, p. 9, at http://www.gao.gov/assets/670/664536.pdf. [Back]
53. Office of Management and Budget, "Memorandum for Chief Acquisition Officers, Senior Procurement Executives, and Small Agency Council Members: Improving Acquisition Data Quality - FY 2008 FPDS Data," M-08-04, (Washington, D.C.: May 9, 2008), at https://georgewbush-whitehouse.archives.gov/omb/memoranda/fy2008/m08-04.pdf; and Office of Management and Budget, Memorandum for Chief Acquisition Officers, Senior Procurement Executives, and Small Agency Council Members: Improving Federal Procurement Data Quality - Guidance for Annual Verification and Validation," at http://www.whitehouse.gov/sites/default/files/omb/procurement/memo/improving-data-quality-guidance-for-annual-verification-and-validation-may-2011.pdf. [Back]
54. U.S. Government Accountability Office, Defense Acquisitions: Further Actions Needed to Improve Accountability for DOD's Inventory of Contracted Services, GAO-12-357, April 2012, p. 2.
The term "FTE" refers to "full-time equivalent"–an estimate of the number of full-time employees that would be equivalent to the work done on a given service contract. [Back]
55. For example, contract obligations performed in Texas were incorrectly coded as having taken place in Turkmenistan. Both Texas and Turkmenistan shared the same two letter code. The coding error occurred when TX was mistakenly entered into the country-code data field rather than the state-code data field, thus marking the place of performance as Turkmenistan. CRS found 32 instances where foreign locations shared the same two letter code as a U.S. state or territory. From FY2005 to FY2010, more than $1.4 billion in contract obligations listed as having been performed overseas may have been performed in the United States. This error was first identified in a news article published in Eurasianet.org. See Deirdre Tynan, "Turkmenistan: Memo to Pentagon - Austin and Ashgabat Are on Different Continents," EURASIANET.org, July 5, 2011, at http://www.eurasianet.org/node/63803. See CRS Report R41820, Department of Defense Trends in Overseas Contract Obligations, by Moshe Schwartz and Wendy Ginsberg. [Back]
56. CRS independently confirmed that data were adjusted. [Back]
57. Information provided via e-mail to the authors on January 29, 2013. To implement the use of the three-digit ISO country code standard, GSA modified FPDS to accept and return only ISO codes in the appropriate data elements and verified that the contractor charged with maintaining the system had the appropriate subscriptions with ISO to provide continuous country coding updates as they are released. The coding change document is available at https://www.fpds.gov/wiki/index.php/V1.4_SP_16.0. [Back]
58. Information provided to the author by email from DOD on March 31, 2015. [Back]
59. The data discrepancy appears only to occur when a user searches for data using the place of the contract's performance as a filter for responses. So, for example, the discrepancy would occur when a user employed the "standard report" to search for contracts that took place in Texas, and then ran the same search using the "ad hoc report." [Back]
60. GSA's full email response read as follows:
This apparent discrepancy is actually a feature of the data. Specifically, the difference that CRS is pointing out is due to the fact that IDVs are not required to have a place of performance, but can have obligated dollars against them. The Geographical Place of Performance Report requires a place of performance whereas the Federal Contract Dollars and Actions Report does not. The entire difference in the dollar amounts that CRS observed comes from dollars obligated against IDVs which do not have a Place of Performance.
Information provided from GSA to CRS via email on February 4, 2015. [Back]
61. Information provided by email from DOD on September 24, 2015. [Back]
62. Circular A-76, most recently updated in 2003, affected public-private competition policies for U.S. government procurement of commercial services. A moratorium on DOD A-76 competitions has been in effect since FY2008. For more information, see CRS Report R40854, Circular A-76 and the Moratorium on DOD Competitions: Background and Issues for Congress, by Valerie Bailey Grasso, and CRS Report "DOD A-76 Competitions" by Heidi Peters, Moshe Schwartz, and Gabriel Nelson. [Back]
63. These figures were retrieved from FPDS in early 2016. When CRS ran the same queries again in September 2016, DOD's reported A-76 obligations were reduced to only about $150 million per fiscal year. [Back]
64. Information provided to author by email from DOD. [Back]
65. For more information on PSC codes, see https://www.fpds.gov/downloads/top_requests/PSC_Manual_FY2016_Oct1_2015.pdf. [Back]
 | This document has been published on 06Jan17 by the Equipo Nizkor and Derechos Human Rights. In accordance with Title 17 U.S.C. Section 107, this material is distributed without profit to those who have expressed a prior interest in receiving the included information for research and educational purposes. |