| Information |  | |
Derechos | Equipo Nizkor
| ||
| Information | | |
Derechos | Equipo Nizkor
| ||
Jul12
Macroeconomic imbalances - Spain
EUROPEAN ECONOMY
Occasional Papers 103
CONTENTS EXECUTIVE SUMMARY AND CONCLUSIONS
2. MACROECONOMIC SITUATION AND POTENTIAL IMBALANCES
2.1. Macroeconomic scene setter
2.2. Causes and drivers of internal and external imbalances2.2.1. Housing market
2.3. Recent trends
2.2.2. Credit growth and private sector debt
2.2.3. External debt, deficits and competitiveness
2.2.4. Public debt
2.4. The adjustment capacity of the Spanish economy3. IN-DEPTH ANALYSIS OF SELECTED TOPICS
3.1. Saving-investment imbalance
3.1.1. On-going adjustment
3.2. Internal debt imbalance
3.1.2. Conclusions3.2.1.On-going adjustment
3.3. External debt
3.2.2. Assessment3.3.1. Composition and development of external indebtedness
3.4. Competitiveness and export performance
3.3.2. Assessment of the sustainability of Spain's external debt
3.3.3. Conclusions3.4.1. Price and cost competitiveness
3.5. Housing market imbalance
3.4.2. Productivity
3.4.3. The development of unit labour cost
3.4.4. Labour market and competitiveness
3.4.5. Export and import developments
3.4.6. On-going adjustment
3.4.7. Conclusions3.5.1. On-going adjustment
3.5.2. Financial sector and housing market
3.5.3. House prices developments
3.5.4. Conclusions
Executive summary and conclusions
This in-depth review takes a broad view of the Spanish economy in order to identify actual or potential imbalances and the possible macroeconomic risks which they may entail. As the main finding, this review shows the high degree of interconnection among the different imbalances characterising the Spanish economy.
With regard to the origin of the current imbalances, the existence of an abundant availability of external financing at low cost, allowed a significant increase of investment - notably in real estate - and consumption. This triggered a sharp rise in external deficits and private debt. A significant part of these financial resources was channelled into the non-tradable sector, especially the construction sector. Generous financing, combined with demographic pressures and incentives favouring housing investment, created significant housing demand, pushing up house prices and ultimately leading to a housing bubble.
The adjustment of these imbalances started in 2007 and is on-going. While the adjustment of flows (e.g. current account deficit, investment in construction, credit growth), has been relatively swift and is quite advanced in some areas, the adjustment of stocks, in particular the high levels of private and external debt, has been much more gradual and will take considerable time.
At the same time as these imbalances started to correct, significant new imbalances arose, notably in the labour market and in public finances. Indeed, unemployment soared following the downsizing of the construction sector and the cyclical adjustment in the rest of economy, which affected employment disproportionately, given the high degree of labour market duality between permanent and temporary workers and the centralised collective bargaining, which limits the sensitivity of wages to cyclical conditions. A comprehensive reform of the labour market adopted in February 2012 is aimed at addressing these issues by reducing severance pay and allowing for greater flexibility in collective bargaining. Public debt, which stood initially at a relatively low level, increased rapidly due to discretionary stimulus measures and the loss of the previous tax-rich base linked to the construction sector.
The banking sector remains burdened with sizeable exposures to the real estate and construction sectors, although additional measures were adopted recently to speed up the recognition of loan losses and to clean up balance sheets. The lending capacity of banks is constrained by a need to deleverage and re-capitalise as well as difficult access to finance. This, in turn, limits access to credit by the real economy and holds back the structural adjustment of the economy. As the adjustment proceeds, negative feedback loops between private and public sector deleveraging, compressed domestic demand, high levels of unemployment, further adjustment in the housing sector, and financial sector stability cannot be excluded. In addition, prolonged adjustment of these imbalances, due to their large size and scope, may create risks of negative spill-overs to other euro-area economies.
The main observations from this review are:
- Large accumulated private sector debt is a source of concern, especially with regard to the real estate and construction sectors. The size and scope of the necessary deleveraging implies subdued domestic demand in the medium-term with significant downside risks related to the high vulnerability of the private sector to interest rates increases associated with widening credit risk spreads. Consequently, economic growth is expected to be weak, with adverse implications for the debt repayment capacity of households and non-financial corporations. In this context, the potential risks of negative spill-overs to the financial sector are also pertinent. In addition, the reduction of private debt is a necessary condition for reducing external debt.
- The large external debt poses significant risks and needs to be brought back to a sustainable path. Large external financing needs increase the vulnerability of the Spanish economy to the changing conditions of access to finance and the interest burden. At the same time, continued build-up of unsustainable external debt positions and possible disorderly unwinding could create negative spill-overs to other euro-area economies. While the current account deficit has been reduced significantly, a shift to persistent current account surpluses will be required to restore the sustainability of the external position.
- Spain is in the process of regaining competitiveness. Spain has made important progress in terms of compensating for past losses of its price and cost competitiveness. However, a significant part of this adjustment has been due to cyclical factors, in particular the sharp reduction in employment which implied a strong improvement in measured productivity. A more structural, long-lasting, re-balancing of the economy requires that structural problems that are hampering growth and limiting competitiveness should be tackled. Spain lost some of its global market share for exports of goods and services in the past, mainly reflecting the integration of emerging export-oriented economies. But this decline was less pronounced than in the case of other euro-area countries. Moreover, Spain's export performance has been relatively resilient in the wake of the crisis. However, based on this performance, further improvements in external competitiveness and enlargement of the export base of Spanish economy are of key importance to strengthen the export-orientation of the Spanish economy. This is critical in order to mitigate the negative impact of the on-going deleveraging of the private and public sectors.
- House prices continue to fall in Spain. The bursting of the housing bubble exposed a significant oversupply of new housing, leading to an accumulation of a large stock of unsold houses. This - together with the selling pressures being exerted on banks by the new bank regulation measures with respect to their real estate repossessions - continues to exert downward pressure on house prices with potential adverse effects on private consumption and financial stability.
- •Public debt has become an emerging, rapidly-increasing, imbalance in Spain. While the share of public debt in GDP is still below the euro-area average, it is growing rapidly on the back of weak growth, rising interest payments and high budget deficits.
In this context, the in-depth review concludes that Spain is experiencing very serious macroeconomic imbalances, which are not excessive but need to be urgently addressed. In particular, macroeconomic developments, notably related to the significant level of private sector debt, the large negative external position and the financial sector, which were influenced by housing market developments, require close monitoring and urgent economic policy attention in order to avert any adverse effects on the functioning of the economy and of economic and monetary union.
The unwinding of these imbalances and the required structural adjustment of the economy depend on the flexibility of Spanish factor and product markets. The policy response of the Spanish government has been comprehensive and far-reaching. However, important challenges remain. In particular, policies aimed at increasing competitiveness and enlarging the export base of the Spanish economy, strengthening competition in product and service markets, further restructuring of the banking sector with a strong focus on troubled asset disposal, completing the adjustment of the housing sector and enhancing the scope of reforms in the labour market would support the further correction of imbalances.
On 14 February 2012, the European Commission presented its first Alert Mechanism Report (AMR), prepared in accordance with Article 3 of Regulation (EU) No. 1176/2011 on the prevention and correction of macroeconomic imbalances. The AMR serves as an initial screening device, helping to identify Member States that warrant further in-depth analysis to determine whether imbalances exist or risk of emerging. According to Article 5 of Regulation No. 1176/2011, these country-specific "in-depth reviews" should examine the nature, origin and severity of macroeconomic developments in the Member State concerned, which constitute, or could lead to, imbalances. On the basis of this analysis, the Commission will establish whether it considers that an imbalance exists and what type of policy follow-up it will recommend to the Council.
For Spain, the AMR stressed that, even though the adjustment of imbalances is on-going, the absorption of the large stocks of internal and external debt is pending. Improvements in competitiveness are necessary to face these challenges. Moreover, correcting the disequilibrium in the housing market is essential.
Against this background, Section 2 of this review looks in greater detail into these developments covering both external and internal dimensions. This is followed by specific focus sections on the saving-investment imbalance, private sector debt, external debt, competitiveness and export performance, and housing market developments (Section 3). Section 4 presents policy considerations.
2. MACROECONOMIC SITUATION AND POTENTIAL IMBALANCES
2.1. MACROECONOMIC SCENE SETTER
The onset of the international financial and economic crisis in 2008 exposed weaknesses in the growth pattern that characterised the Spanish economy during the preceding boom period. The Spanish economy recorded a long period of strong expansion between 1996 and 2007, with average real GDP growth of 3.7% per year and job creation of over 7 million. As a result of very low and even negative real interest rates, growth was heavily skewed towards domestic demand, and in particular residential investment, which contributed to the accumulation of high domestic and external imbalances.
The economic and financial crisis hit Spain hard. Between the beginning of the crisis (Q3-2008) and the end of 2011, real GDP dropped by over 3%. Moreover, the number of people employed fell by almost 2.5 million (12% of total employment) in the same period. More than half of these lost jobs had been in the construction sector.
After some stabilisation in 2011, the economy is projected to fall back into recession in 2012. In 2011, the Spanish economy grew by 0.7%, based exclusively on resilient net exports (contributing 2.5 pps. to GDP growth). On the back of very weak domestic demand and tight credit conditions real GDP is expected to contract by 1.8% in 2012 according to the Commission Services' 2012 Spring Forecast. High unemployment, deleveraging of households and non-financial corporations, and the need for fiscal consolidation are weighing heavily on domestic demand. Indeed, the on-going correction of accumulated imbalances will affect domestic demand adversely over the forecast horizon although a gradual improvement is expected starting in 2013. The strong growth contribution of net exports is partly due to this weakness in domestic demand, implying a sharp drop in imports. At the same time, export performance in the wake of the crisis has been strong and is proving to be a major stabilising factor. As a result, the current account deficit has been narrowing and is expected to be close to balance by 2013. In addition, wage growth is expected to be moderate and, in combination with the projected continued strong growth in labour productivity, will further reduce unit labour costs. The inflation differential with the euro area is expected to be negative, leading to some improvement in price competitiveness.
2.2. CAUSES AND DRIVERS OF INTERNAL AND EXTERNAL IMBALANCES
The long period of expansion of the Spanish economy was shaped by several factors that contributed to the intensity and duration of the boom. In particular, Spain's accession to the euro area led to the disappearance of its country risk premium, reflecting the view that the risks associated with devaluations, which had occurred relatively frequently with the Spanish peseta in the ERM, were no longer relevant with a single currency. This produced two important effects. On the one hand, Spanish interest rates fell sharply |1|. On the other hand, capital inflows increased as foreign investors were more willing to take advantage of investment opportunities offered by Spain. As a result, the external financial constraint for the Spanish economy virtually disappeared.
The relatively high returns offered by the Spanish economy were in turn linked to the on-going catching-up process and Spain's lower starting position in terms of per capita income. In fact, part of this inflow of financial resources was used to increase the capital intensity of the Spanish economy, with investment in equipment increasing its weight on GDP by 1.4 pps. between 1995 and 2007, twice the euro-area average. In addition, an important share of these external financial resources went to the non-tradable sector, and more specifically to construction and real estate activities.
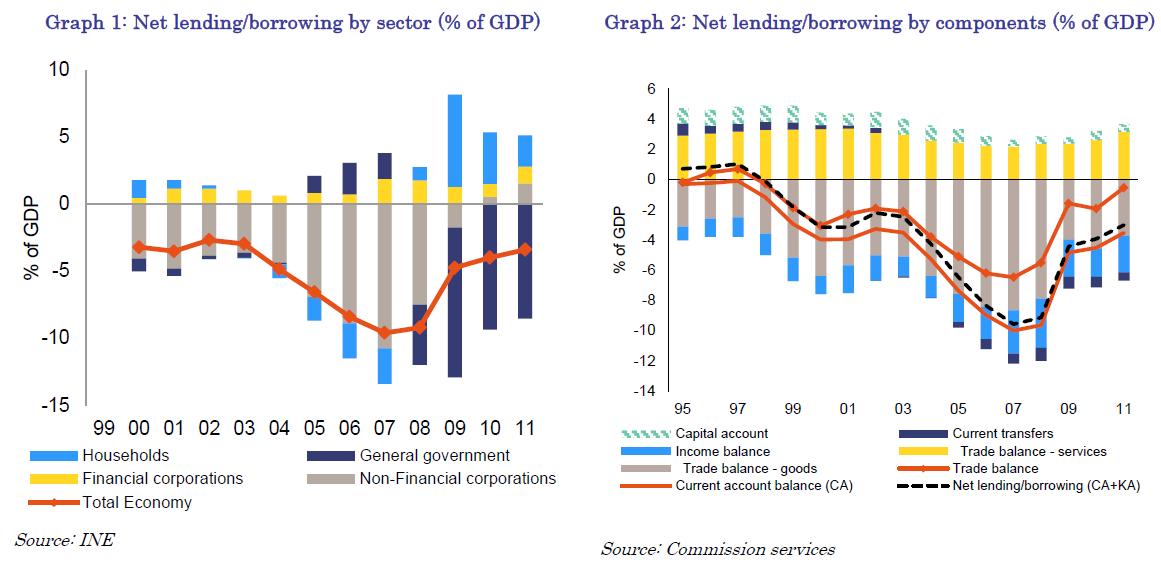
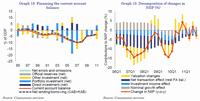
This huge increase of external financing was, unavoidably, accompanied by an increasing current account deficit (Graphs 1 and 2). Moreover, in the case of Spain, the main part of these financial resources was absorbed by the construction sector and not by the tradable sectors, implying a limited impact on future growth.
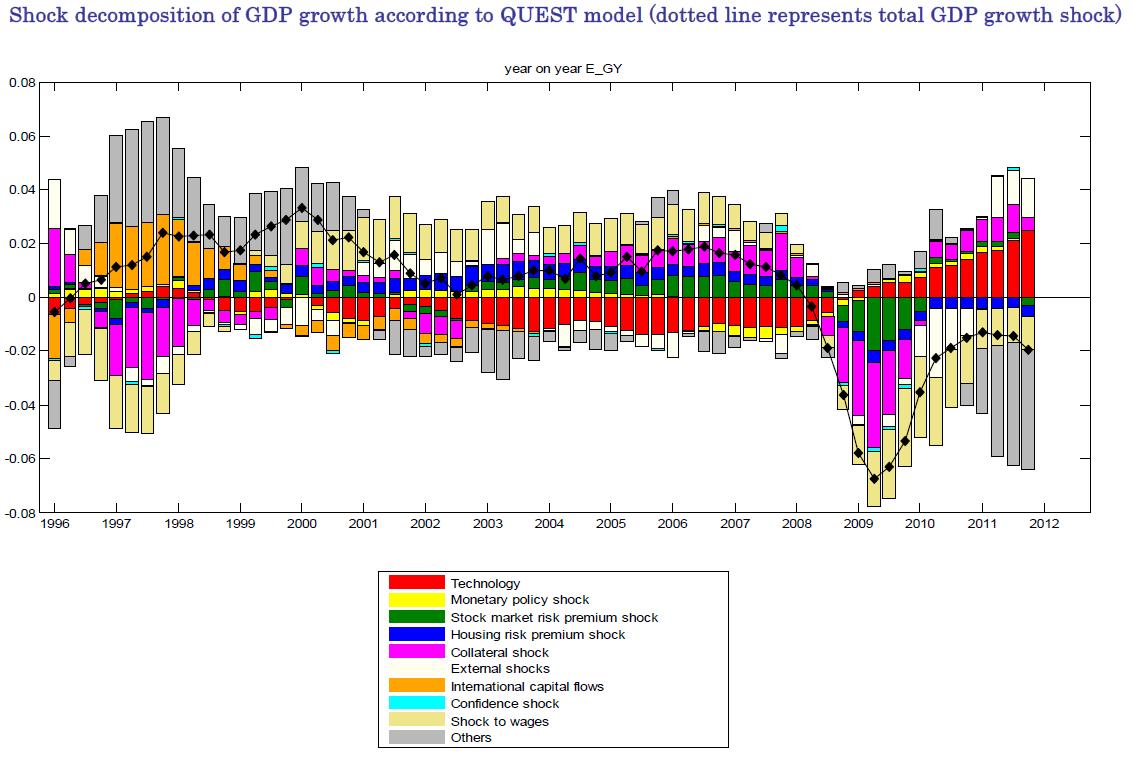
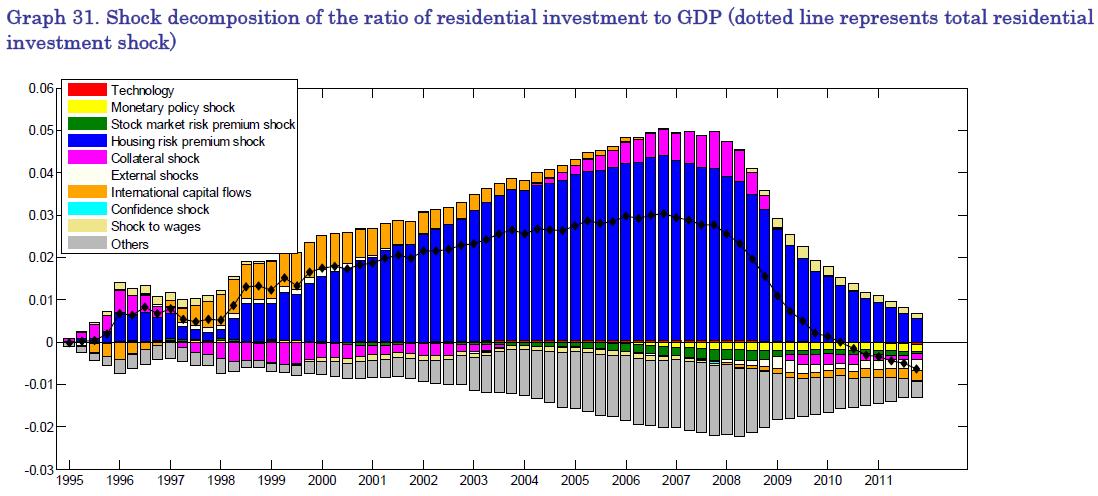
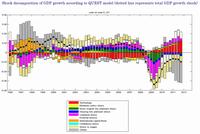
Box 1: THE SOURCES OF SPANISH BOOM PERIOD ACCORDING TO THE QUEST MODEL The EC's QUEST model estimated for Spain (Jan in't Veld et al. (2012)) provides evidence on the shocks that the Spanish economy suffered and that promoted the long expansion period. The following graph shows the decomposition of the shocks that caused a deviation of GDP from its steady-state growth. According to this model, in the years before the creation of the euro area, the shock for international capital flows played an important role in boosting economic activity. In the subsequent years, other factors took over this role, especially factors related to the labour market, which, inter alia, reflected the significant increase in population recorded in the expansion period. An additional factor that contributed to the prolongation of the period of expansion was the relaxation of credit conditions, which is reflected in the graph as collateral shock, especially in the period 2004-2008.
Click to enlarge
Additionally, the QUEST model obtains that the easy access to international financing with low interest rates had significant effects on business investment and household consumption throughout the period of expansion. In the case of business investment, international capital flows were the main driver that pushed investment beyond its steady state in the period 1998-2003. After 2003, easier financing conditions explain up to 80% of the total deviation. In the case of residential investment, international capital flows played an important role in the first few years of the housing boom, while the relaxation of credit conditions was the main driver (3/4 of total deviation) in the subsequent years.
Click to enlarge
The reduced cost of capital and easier access to credit, combined with policy incentives promoting house ownership, fuelled housing demand. Indeed, the reduction of the country risk premium and high availability of foreign capital implied very low nominal interest rates (and even negative real interest rates) during some periods. Housing supply followed but only with a lag. As a result, house prices started to accelerate since 1998, registering annual increases of more than 10% up to 2006 and smaller but positive rates of growth until the second half of 2008. The emerging housing boom was underpinned by demographic factors. Population growth -both total and working age -accelerated from 1999 to 2008, and the number of households rose. This had its origin in the entrance of the 1970s baby-boom cohorts into the labour force, an increase in female labour force participation, and large immigration flows. Thus, while the immigrant population accounted for 2% of total population in 1999, its weight reached 10% by 2007. Finally, economic growth started to generate significant job creation (averaging 3.7% of growth between 1997 and 2007), further adding to the demand for housing.
The combination of low interest rates, accessible financing |2|, demographic pressure, rising house prices and the perception that these higher prices would be sustained, making house purchases appear to be a safe investment, fed a housing bubble that produced a sharp increase in housing production and prices. House prices almost tripled between 1997 and early 2008, while production of housing more than doubled from the 1995 level. Over 6.5 million new homes were built between 1996 and 2009. As a result, the weight of investment in construction reached 22% of GDP in 2006-2007, compared with 15% in 1995. This represented a significant diversion of productive resources towards the construction sector. Construction employment reached 14% of total employment in 2007, compared with 9% in the years before the expansion period.
2.2.2. Credit growth and private sector debt
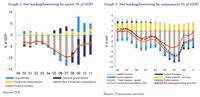
The transfer of financial resources to construction sector exceeded the scale of transfer of production factors, given that the financing needs of this sector are usually higher than in the rest of the economy. Indeed, in 1995, 39% of total MFI credit to enterprises and households was related to construction and housing (loans to construction companies, real estate and loans for the purchase and renovation of dwellings). In 2007, these loans accounted for 65% of total MFI credit, after growing at an annual average rate of 22%. This expansion of credit to the construction sector was significantly helped by the easing of financing conditions.
However, it was not only the credit associated with construction that rose sharply in the period of expansion. Credit to other productive activities and to household consumption also experienced a boom, with an average growth rate of 12% between 1997 and 2007. As a result, private sector debt rose appreciably. Specifically, it reached 227% of GDP in 2010, well above the threshold of the MIP scoreboard (160%).
2.2.3. External debt, deficits and competitiveness
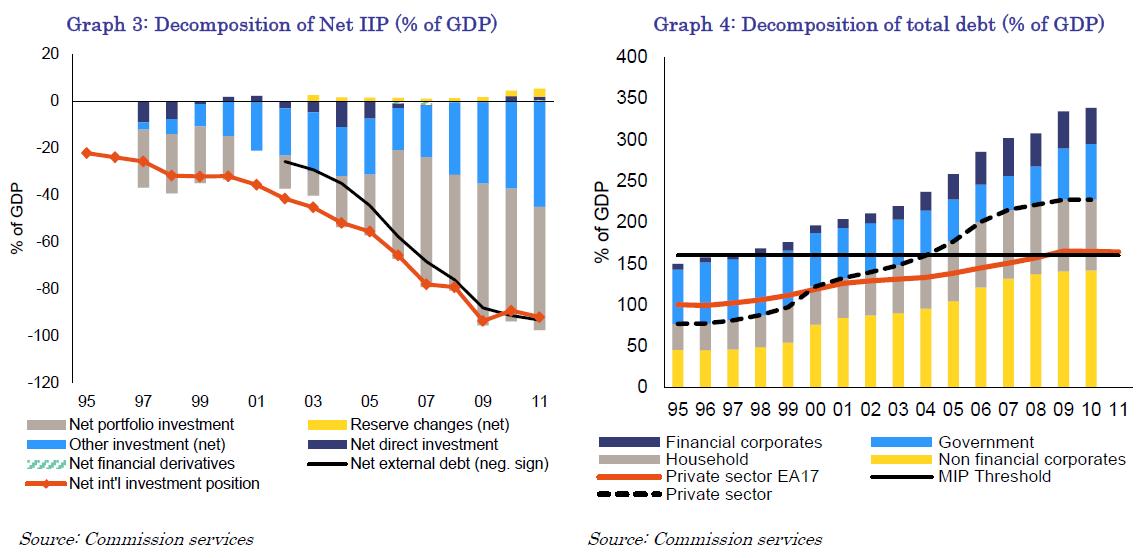
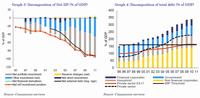
The level of total accumulated foreign debt reached 164% of GDP in 2010. However, external financing was not only used for internal operations in Spain, but also to finance investment by Spanish companies abroad. Consequently, the net international investment position (-89.5% in 2010) is lower than the volume of total external debt, but still above the scoreboard threshold of -35% (Graph 3).
Click to enlarge
The inflow of huge external financial resources, which financed consumption and to an even greater extent investment (Graph 4), resulted in the appearance of sustained and increasing external deficits. Indeed, the gap between imports and exports rose, as the strength of domestic demand pushed up imports.
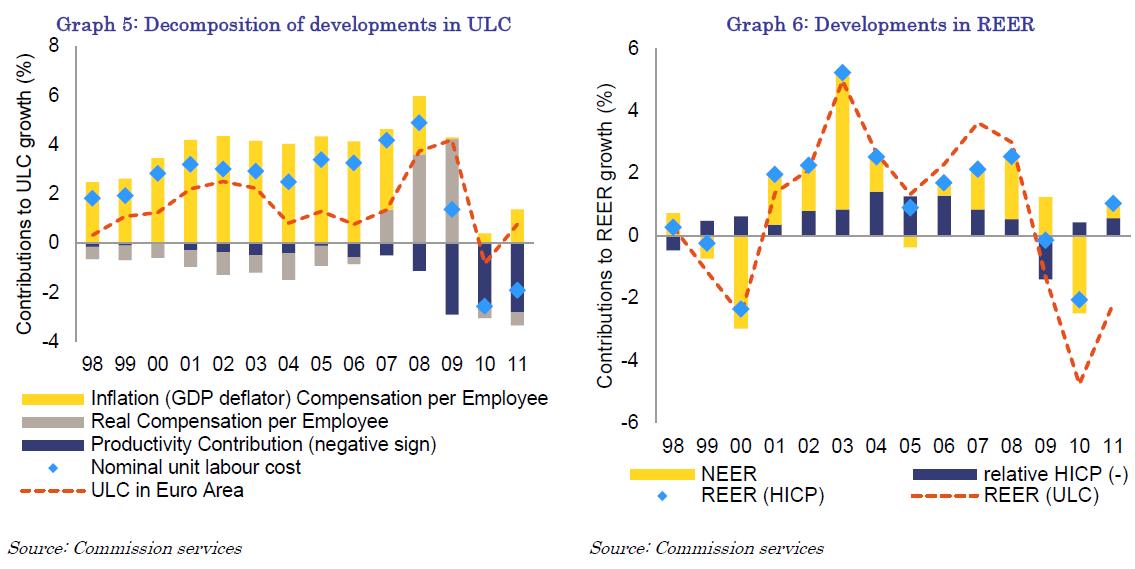
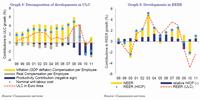
At the same time, foreign capital inflows and the induced domestic demand boom pushed up wages and prices, contributing to a steady deterioration in the cost and price competitiveness of the Spanish economy. The gap between wage growth (3.2% on average in the period 1996-2007) and a historically subdued productivity growth (0.4% on average in the period 1996-2007) widened and unit labour costs rose significantly (2.8% on average over the same period and more than double the euro-area average) (Graph 5). Thus, in the period 1999-2009, the REER (based on ULC) vis-a-vis IC35 appreciated by 16%, which imposed a drag on the expansion of Spanish exports. It addition, it was also an indication of a loss of competitiveness of Spanish products in the domestic market (Graph 6).
Click to enlarge
Public debt can be considered an emerging but also a rapidly increasing imbalance in Spain. It has only emerged in the last couple of years as, partially, a mirror image and a consequence of the on-going adjustment in the private sector. The other source of this rising debt is the misalignment between public expenditures and public revenues, which, during the housing boom, were based on a tax-rich base. The debt-to-GDP ratio was barely above the MIP scoreboard target of 60% in 2010, but it reached 68.5% already in 2011. While its level is still relatively low compared to other euro-area countries, the fast pace of its deterioration is a source of concern. In absolute terms, public debt has increased by about 70% since 2008 and is expected to increase further reaching close to 90% of GDP by 2013 despite on-going fiscal consolidation. One of the important effects of increasing fiscal deficits and growing public debt has been a significant increase of Spanish risk premia. However, this higher financing cost is not only limited to sovereign debt, but also affects the cost of financing of Spanish MFIs and ultimately of non-financial private sector.
The extended housing and credit booms between 1997 and mid-2008 were associated with the accumulation of various imbalances including: excessive weight of the construction sector, excessive credit growth to the private sector, sustained loss of competitiveness and, finally, excessive reliance on external financing. The turning point had already been reached in late-2006 and early-2007. Interest rates started increasing in 2006, which, combined with the already high degree of household indebtedness, led to an easing of demand for housing and credit. By that time, the affordability ratio associated with buying a house had increased to 46% of household disposable income (compared to 28% in 1999). This also affected private consumption, which started to decelerate in 2007. As the economy still grew by close to 4% in 2007, the adjustment was relatively soft. However, the economic and financial crises in 2008 triggered a much sharper correction. While some imbalances adjusted very rapidly, others were more persistent. Moreover, additional imbalances started to emerge in the wake of the crisis, notably in the labour market and with regards to public finances.
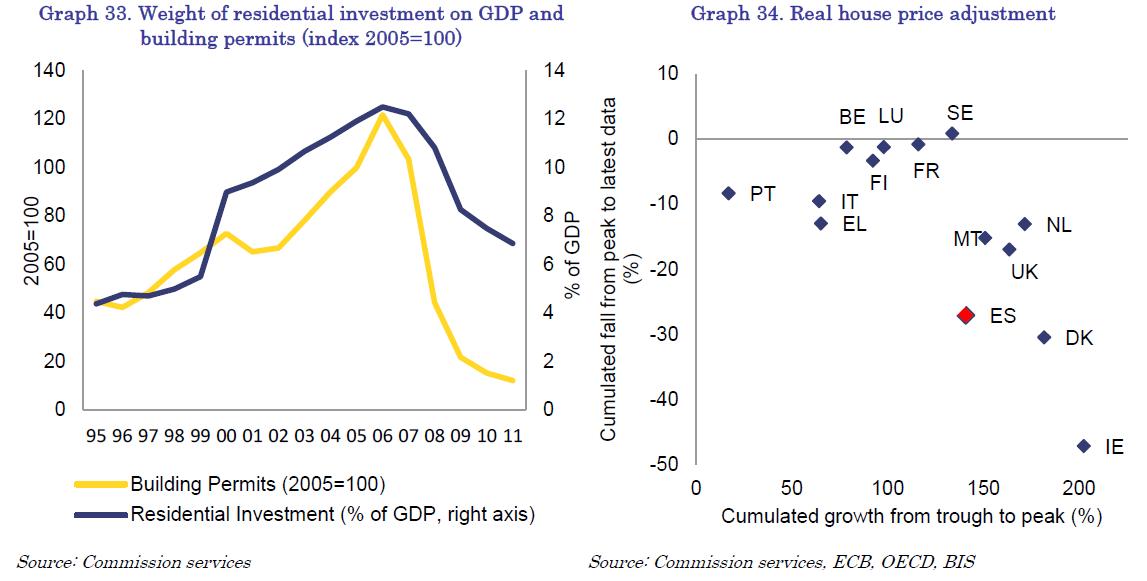
The adjustment in the construction sector has been very rapid since 2008. Over the period 2008-2011, the share of construction investment in total GDP fell below the pre-boom level (14%). Employment in the construction sector fell by around 1.4 million over the same period and the weight of construction in employment reached its lowest level since 1976. House prices have fallen by 29% (in real terms) since their peak and this decline gathered pace in the last quarter of 2011 when house prices registered a reduction of 11% (y-o-y). The drop in housing demand, which occurred from 2008 onwards along with the tightening of credit conditions, contributed to a contraction of credit throughout 2011. Finally, the current account deficit decreased from 9.6% of GDP in 2007 to 3.4% in 2011.
While the correction of imbalances in terms of flows has therefore progressed in the wake of the crisis, the adjustment of imbalances in terms of stocks has been much less. The stock of credit to the private sector has decreased by 10 pps. of GDP, but remains very high (213% of GDP). The net international investment position has continued to deteriorate in line with sustained current account deficits, reaching -92% of GDP in the third quarter of 2011 and well above the -35% scoreboard threshold value. Putting external debt on a downward path would require a shift to structural external surpluses for a prolonged period, based on further improvements in the competitive position of the Spanish economy. Since the beginning of the crisis, the loss in competitiveness during the expansion period has only partly been corrected.
Finally, the economic crisis has brought to the fore imbalances in the housing market. The fall in housing demand exposed a significant oversupply of new housing, the volume of which is estimated up to one million units. This reduces the availability of significant financial resources for alternative productive activities.
2.4. THE ADJUSTMENT CAPACITY OF THE SPANISH ECONOMY
The capacity of the Spanish economy to undergo the necessary adjustment will depend on the smooth functioning of its factor and product markets, in particular the labour market. Indeed, unemployment has emerged as a very significant imbalance of the Spanish economy as it rapidly increased following the downsizing of the construction sector. Up to now, labour market rigidities, including wage setting mechanisms -which restricted the responsiveness of wages to economic conditions - and a high degree of labour market duality, have been aggravating the crisis-induced surge in unemployment. The recently-adopted labour market reform aims to address these challenges. However, the employability of the large number of low-skilled workers made redundant in the construction sector still poses a challenge. The banking sector remains burdened with sizeable exposures to the real estate and construction sector, even though additional measures were adopted recently to speed up the recognition of losses and to clean up balance sheets. The lending capacity of banks is constrained by a need for further re-capitalisation and difficult access to finance. This limits access to credit by the real economy and holds back the structural adjustment of the economy. In addition, certain product market inefficiencies, including weak competition in professional services and the heterogeneity of administrative rules among regions, also hamper the re-allocation of resources.
The adjustment of large external and internal imbalances built up in the years prior to the crisis is propelling the Spanish economy through a period of subdued economic growth combined with very high unemployment. These developments, in turn, slow down the on-going deleveraging process and the adjustment in the housing sector. They also have adverse effects on the financial sector, thus reducing the flow of credit and putting an additional brake on economic growth. Moreover, due to the size and nature of the accumulated imbalances, Spain is vulnerable to external shocks, such as rises in interest rates. Such external shocks may have adverse effects on the on-going adjustment. In sum, as the adjustment of the economy progresses, negative feedback loops between private and public sector deleveraging, compressed domestic demand, high levels of unemployment, further adjustment in the housing sector, financial sector stability and credit availability cannot be excluded.
These imbalances may create negative spillovers to other euro-area economies. These spillovers can be transmitted through several channels, with trade and financial channels being the most important. Empirical evidence shows |3| that positive growth spillovers from Spain were significant for other large euro-area economies, including Germany, France, and Italy. However, following the burst of the property bubble, private sector deleveraging is depressing Spain's domestic demand and, thus, generating negative spill-overs.
Financial channels of transmission of shocks have gained prominence in the recent years with increasing financial integration. In the case of Spain, two possible financial channels could be identified. First, negative spillovers of Spain could be transmitted through the sovereign debt market. In particular, developments of Spanish sovereign bonds could impact on other euro-area sovereigns due to their increased correlation over time (see Box 2 for a more detailed discussion). In addition, countries characterized by a large exposure of their banking sector to Spain (such as Germany and France) may be more vulnerable to potential negative spillovers from Spain.
Box 2: Sovereign debt spillovers The euro-area sovereign debt crisis has shown the potential for spillover risks from debt accumulation in a monetary union. Highly interconnected financial markets, cross-border balance sheet exposures as well as the existence of bail-out provisions generally act as potential transmission channels. Indeed, developments over the past 3 years in the euro area highlight the link between market concerns over fiscal sustainability, increases in sovereign yields via risk premium effects and higher interdependence between Member States.
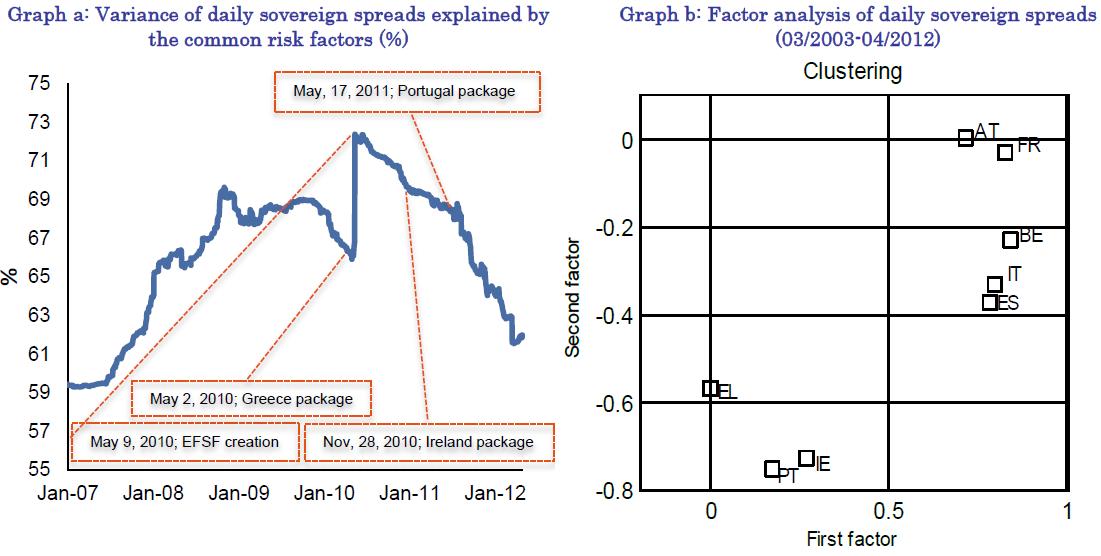
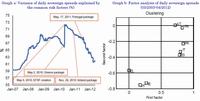
Financial stress widened sovereign spreads with respect to the German benchmark in peripheral countries at first and then seriously affected some core Member States. The potential for spillovers increased as the crisis unfolded and reached its peak in May 2010 with the creation of the European Financial Stability Facility (EFSF) as can be seen in Graph a by looking at the influence of common risks factors in explaining the variance in the daily changes of the spreads for selected Member States . The creation of the EFSF implicitly linked the different bond markets but also contributed to reduce the uncertainty around potential domino effects and the potential for contagion has dropped ever since.
Click to enlarge
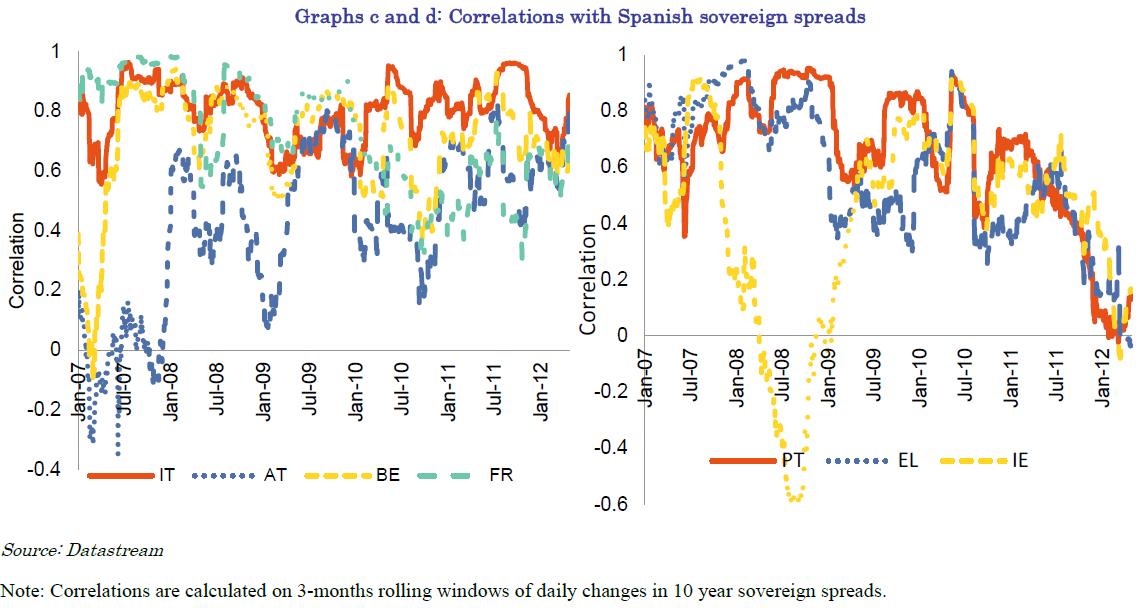
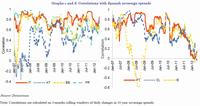
Countries witnessing hikes in their sovereign spreads are split into two groups according to factor analysis: programme countries on the one hand and other financially stressed countries on the other hand (Graph b). This picture is confirmed by looking at the correlations of the changes in the Spanish spreads with respect to the other countries in the sample (Graphs c and d). Spanish sovereigns are detached from programme countries as of April 2012, although the correlation with respect to the rest of the countries in the sample is high, signalling the potential for major spillovers through market reactions.
Click to enlarge
3. IN-DEPTH ANALYSIS OF SELECTED TOPICS
The previous section gave a general overview of the different imbalances in the Spanish economy, highlighting their interconnections. This section provides further, more in-depth analysis of the individual imbalances.
3.1. SAVING-INVESTMENT IMBALANCE
Massive private capital inflows into Spain for an extended period of time before and after euro-area accession are key to understanding the emergence of large internal and external imbalances. Initially, this external shock provided a boost to economic growth. Throughout the boom years, abundant and cheap financing led to an expansion in corporate and household (mainly residential) investment as well as household consumption. This, in turn, resulted in the emergence of recurrent and increasing current account deficits. Indeed, the gap between imports and exports increased, driven by buoyant domestic demand (see Section 3.4 on competitiveness and export performance for more details).
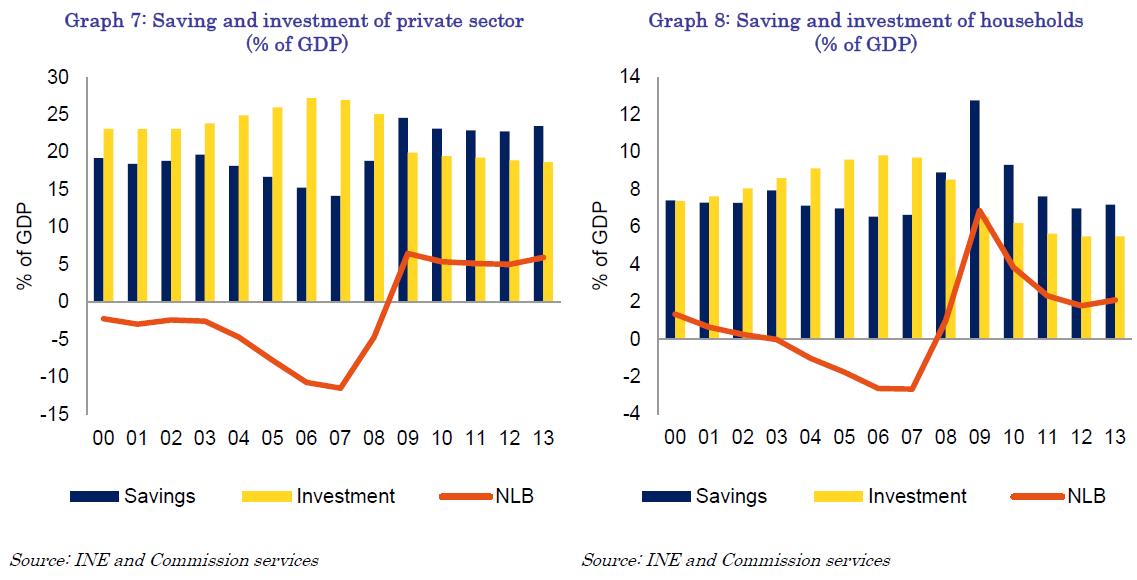
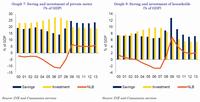
Households' savings and investment were in balance in the early 2000s, but the household investment increased significantly over time while their savings rate remained rather stable, leading to a widening of the saving-investment gap, which became particularly acute during the period 2004-2007 (Graph 8). The main factors driving the buoyant households' investment, in particular housing investment, included low interest rates and easy financing on the one hand and rising employment and wages feeding into increases of households' income and wealth, on the other hand. Sustained high demand for housing that lasted for a decade generated a seemingly never-ending upward trend for house prices, creating an impression of a virtually safe investment that kept feeding back into further demand. In addition, policy factors have also played a role. In particular, tax system favouring home ownership over renting (i.e. deductibility of mortgage interest payments), provided additional incentives for house purchases (see Section 3.5 on housing market imbalance for more details).
Click to enlarge
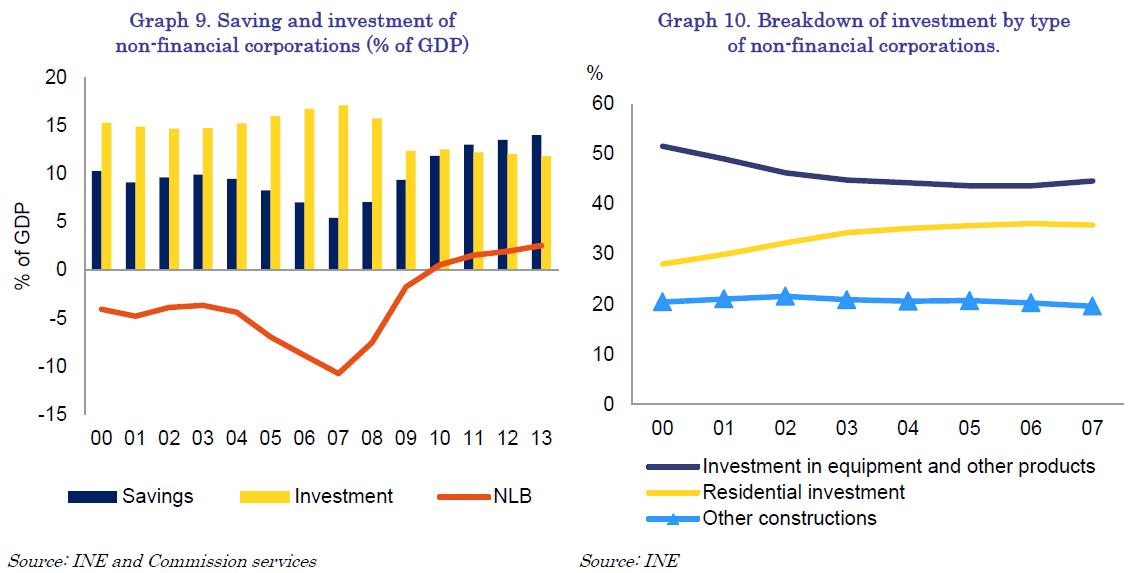
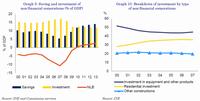
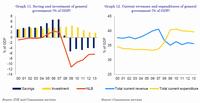
The situation was even more pronounced for non-financial corporations, with the gap between their saving and investment rates widening markedly, with investment being twice the size of saving in 20052008, both due to significantly higher investment but also due to lower savings rate (Graph 9). Most of the imbalance between savings and investment, as in the case of households, was driven by a significant increase of residential investment. Indeed, its share in total corporate investment increased by almost 10 pps. in 2000-2007 (Graph 10). In addition, as part of the catching-up process, the capital intensity of the Spanish economy increased. Indeed, the weight of investment in equipment on GDP increased by 1.4 percentage points between 1995 and 2007, twice the euro-area average. The main factors driving the rapid increase in corporate investment were the decline of risk premium and the optimistic macro-economic outlook for the Spanish economy, on the back of a long expansion period. However, the imbalance between savings and investment was also due to a reduction of savings. Indeed, the period characterized by the highest ratios of investment on GDP (2006-2007) was also the period with the lowest ratios of savings on GDP. Higher direct taxes as well as higher property incomes payments (mostly dividends) reduced gross disposable income of NFCs in those years, thus, reducing their capacity to save.
As a result of buoyant private investment in excess of savings, both household and non-financial corporation debt with Spanish financial institutions soared. This debt was, in turn, largely financed by savings from abroad, thus increasing the vulnerability of the Spanish economy to external financing conditions. As these conditions deteriorated suddenly, a rapid adjustment was prompted. By 2011, both the non-financial corporations and households ran a net lending position equivalent to around 1 and 2% of GDP, respectively (Graphs 8 and 9). Looking ahead, according to the Commission Services' 2012 Spring Forecast, both households and non-financial corporations are expected to remain net lenders over the forecast horizon (2012-2013).
Click to enlarge
While the household sector had adjusted already in 2008, the adjustment in the non-financial corporations took place only in 2010. This two year lag is mostly explained by the length of the cycle of the residential construction. Most of the adjustment so far occurred through investment, in particular construction investment, which fell by around 8 pps. from its peak in 2006 to 14% of GDP in 2011. Adjustment in terms of savings rate of households seems somewhat puzzling. After the initial jump of savings rate in 2009 to around 19% (a clear sign of initial overshooting), it has since declined to its long-run historical level of around 11%. Instead, given the large deleveraging needs of households faced with a large stock of accumulated debt, one would expect the savings rate to remain at an elevated level in the medium-term. However, the fall back to previous levels could be due to the fact that the most indebted households are also the ones with lowest levels of income (see Section 3.2 on internal debt for more details) and, thus, they may be unable to increase their savings significantly.
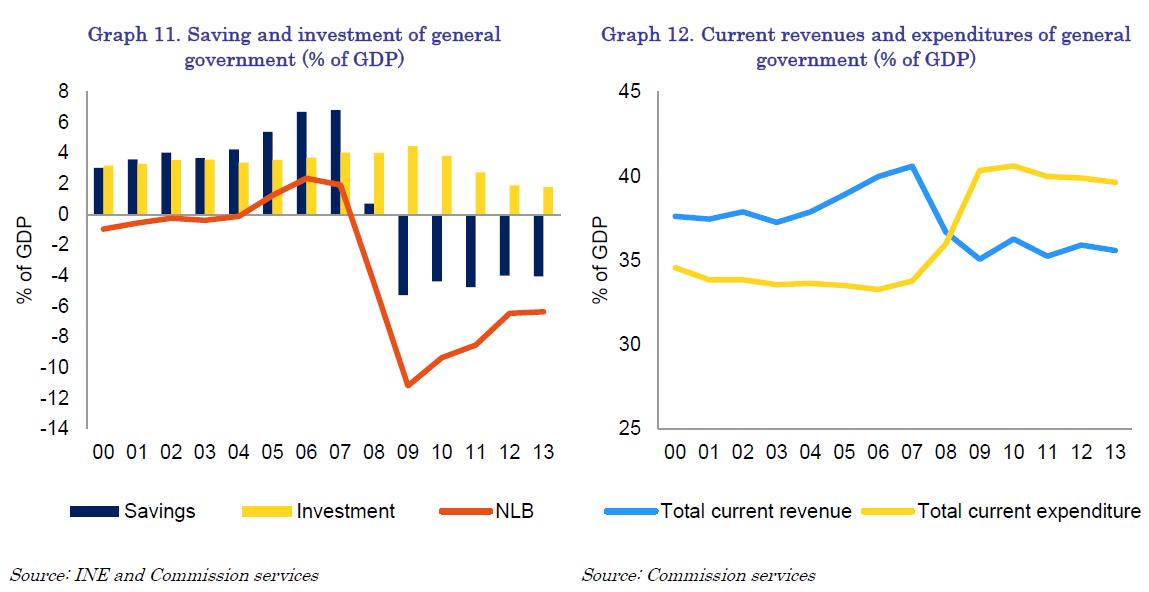
Public sector developments have mirror-imaged those in the private sector. The general government net borrowing position increased in the boom years (with investment less than saving), thus offsetting to some extent the debt accumulation in the private sector (Graph 11). The combination of a steady appreciation of the real effective exchange rate, the reduction of the risk premia and the increase in population in Spain was supportive of a demand-based growth model, highly rich in taxes. According to Martinez-Mongay et al. (2007), about 75% of the increase in tax revenues observed between 1995 and 2006 could have been transitory in nature. Booming domestic economy provided a steady stream of government revenues, recording a particularly steep increase in the tax revenues related to the housing market and private consumption (such as VAT but also corporate taxes). However, during the boom period, the government expenditures also increased significantly, and, as a result the government savings increased at a slower pace than the growth of its revenues (Graph 12). Indeed, as demonstrated by recent developments in public finance, the net lending position of the government proved insufficient to accommodate the disappearance of the extraordinary revenues on which this position was based. As a result, the government balance deteriorated rapidly from 2008 onwards as the government stepped in to support the domestic demand and economic growth in the context of significant private sector deleveraging. That led to the emergence of large government deficits and has significantly increased the public debt level. Despite the on-going fiscal consolidation, public debt is expected to further increase and reach close to 90% of GDP by 2013, according to the Commission Services' 2012 Spring Forecast (see also Section 2.1 of the Commission staff working document: Assessment of the 2012 national reform programme and stability programme for Spain (SWD 2012).. One of the important effects of increasing fiscal deficits and growing public debt has been a significant increase in Spanish risk premia demonstrated by a widening of the spread between Spanish and German government bond yields. This increasing risk premia may also impact the real economy, mostly through the financial sector (i.e. lending conditions for households and non-financial corporations).
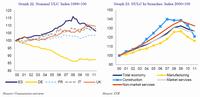
Box 3: Public debt sustainability Spanish sovereign debt has been experiencing renewed tensions. On 7 May 2012, the spread between the Spanish 10-year bonds and the German Bund in the secondary market reached 415 basis points, with the interest rate of 5.76%. These pressures have been translated into primary markets and the cost of the most recent issuances of Spanish debt has increased. Thus, the interest rate on 5-year bonds reached 5% (03/05/2012) and on 10-year bonds 5.85% (24/4/2012). These high levels of interest rates associated with the fast increase of public debt in the recent years raise the issue of public debt sustainability in Spain.
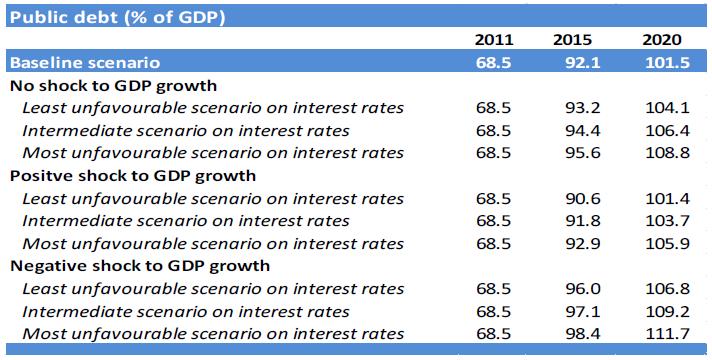
This box explores potential dynamics of debt evolution depending on different scenarios using alternative values for nominal GDP growth and interest rates. The baseline scenario is based on the Commission Services' 2012 Spring Forecast (2012-2013) and the macroeconomic scenario of the "2012 Ageing Report: Underlying assumptions and projection methodologies". As a general rule, the output gap is assumed to close in t+5, after which the potential growth rates converge linearly to the AWG baseline scenario by t+10. With regard to price growth, inflation converges linearly to 2% in 2016, when the output gap is closed, and remains constant thereafter. With regard to interest rates, the baseline scenario considers for 2012 as a whole similar levels to those observed so far (that is, 2% for short-term debt and 6% for long-term debt) and significant improvement in terms of financing costs in the following years.
In addition to the baseline scenario, more stressed conditions regarding the interest rates and the GDP growth are considered (resulting in 9 alternative 'stressed' scenarios). The following three scenarios for interest rates are considered:(1) 'least unfavourable' scenario is based on the assumption that the high financing cost observed in the last auctions remains in place for the rest of 2012 and for 2013, thus, the assumed interest rates are 6% for the long-term debt and 3.5% for the short-term debt; (2) 'intermediate' scenario raises these values to 7% and 5%, respectively; and (3) 'most unfavourable' scenario considers long-term rates of 8% and short-term rates of 6.5%. Two alternative GDP growth scenarios have been also considered. First scenario is based on a positive shock of 1 percentage point in 2013 onwards with respect the baseline scenario while the second one includes a negative shock of the same magnitude and the same time horizon.
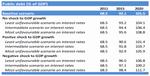
Click to enlarge
There are two key messages stemming from the results of the simulation exercise. First, even under the baseline scenario the ratio of public debt to GDP exceeds 100% in 2020. Second, under the worst-case scenario (i.e. negative shock on GDP combined with 'most unfavourable' assumption on the interest rates), the debt-to-GDP ratio remains around 112%, implying that the risk of government debt becoming unsustainable is relatively low. Nevertheless, in the absence of any policy intervention, the debt-to-GDP ratio is not expected to stabilize before 2020.
Increasing reliance on external financing to cover the large saving-investment gap has increased the vulnerability of the Spanish economy, in particular to external financing conditions and the interest rate changes. Indeed, this vulnerability has been illustrated by the recent episodes of large private capital outflows, which may be characterised as sudden stops (see Section 3.3.2 on external debt sustainability for more details). While the adjustment is on-going with both households and non-financial corporations moving into a net lender position, the speed of the adjustment of stocks has been rather slow. In that respect, policy challenges include increasing the savings rate and reducing some of the existing incentives for investment in the residential sector. Addressing these challenges would facilitate further rebalancing.
Click to enlarge
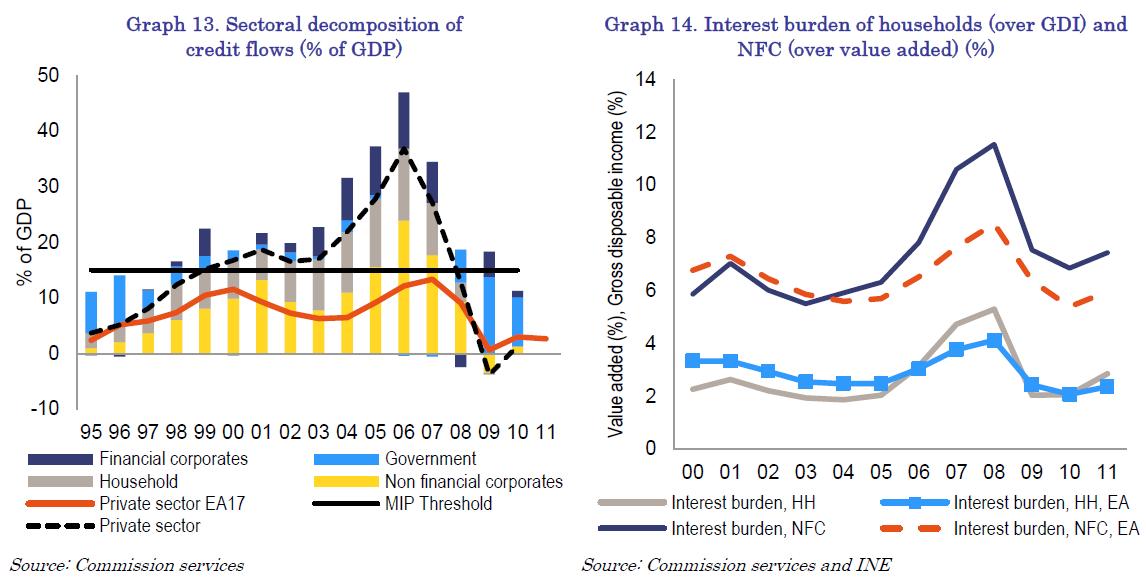
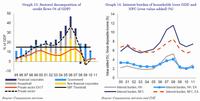
High levels of private sector debt may have significant and negative consequences for the domestic economy, especially linked to the greater sensitivity to changes in cyclical conditions, inflation and interest rates. In addition, a high degree of indebtedness may adversely affect growth and financial stability. In the case of the Spanish economy, private sector debt stood at 227% of GDP in 2010 compared to the MIP indicator threshold of 160%. This high stock of private debt is the result of previous high growth rates of credit during the boom period (Graph 13). According to the latest data (2011 Q4), loans to the private sector have been falling by 3.4% and private sector debt has come down to 213% of GDP.
High debt implies a high exposure of borrowers to changes in the financing conditions given that a majority of mortgages in Spain have variable interest. In the case of households, interest payments alone accounted for 2.9% of gross disposable income in 2011, but reached more than 5.3% in 2008, when interest rates rose. For corporations, 7.4% of their gross value added went to net interests payments in 2011, rising to 11.6% in 2008 (Graph 14). Consequently, for both households and non-financial corporations, the high level of debt may impose an important drag on consumption and profitability. In addition, to the extent that this high level of debt feeds into a deterioration of the financial situation of households and non-financial corporations, the stability of the financial sector could be threatened.
The high level of private debt was fuelled by both supply and demand factors. On the supply side, euro-area accession by Spain led to a reduction of the Spanish risk premium, leading to a prolonged period of low interest rates and easy access to finance. On the demand side, the long period of low interest rates paved the way for higher economic growth and, more importantly, triggered a housing boom.
As a result of the housing boom, private debt rose significantly. Construction and residential investment, in particular, are activities which use financial resources more intensively than the rest of economy. For households, bank loans grew by 18% on average during the period 1997-2007, 78% of the growth of loans came from house purchases. For corporations, bank lending increased by 16% on average over the same period, while corporations linked to construction and real estate activities accounted for half of growth of total credit to non-financial corporations.
Click to enlarge
Slightly more than one third of total outstanding private debt is held by households (amounting to 82% of GDP). As problematic as the headline household indebtedness is, the fact that more than 90% of this debt consists of mortgages, almost exclusively with variable interest rates, mainly linked to the Euribor. Hence, more than a third of total debt is long-term debt, with maturity periods of over 20 or 30 years, and very sensitive to variations in the Euribor. Corporate debt stands at 135% of GDP. A large share is concentrated in construction and real estate (43% of total debt of non-financial corporations). However, these loans contribute disproportionately to the increase in doubtful credits: according to the latest data (February 2012), over 70% of total doubtful credits are linked to real estate and construction activities.
The adjustment of the large stock of accumulated private sector debt has started and is on-going. However, further deleveraging is likely to take several years.
Households
Household indebtedness, measured as a share of financial assets, has fallen by around 5% from its peak (2009 Q1) |4|. Already in 2008, households moved to a small net lending position (amounting to around 1% of GDP) as they increased their savings and reduced investment (Graph 8). Since then, they have continued reducing their investment, which fell to below 6% of GDP in 2011 (compared to a peak of almost 10% of GDP in 2006). At the same time, the savings rate is now at its long-term historical average level of around 11% (see Section 3.1 on saving-investment imbalance for more details). All in all, the pace of adjustment up to now has been rather slow (below 2 pps. per year) despite its large size. In 2011 Q3, indebtedness stood at 133% of gross disposable income, compared to 80% in 2001.
Deleveraging of the household sector may come from three different sources.
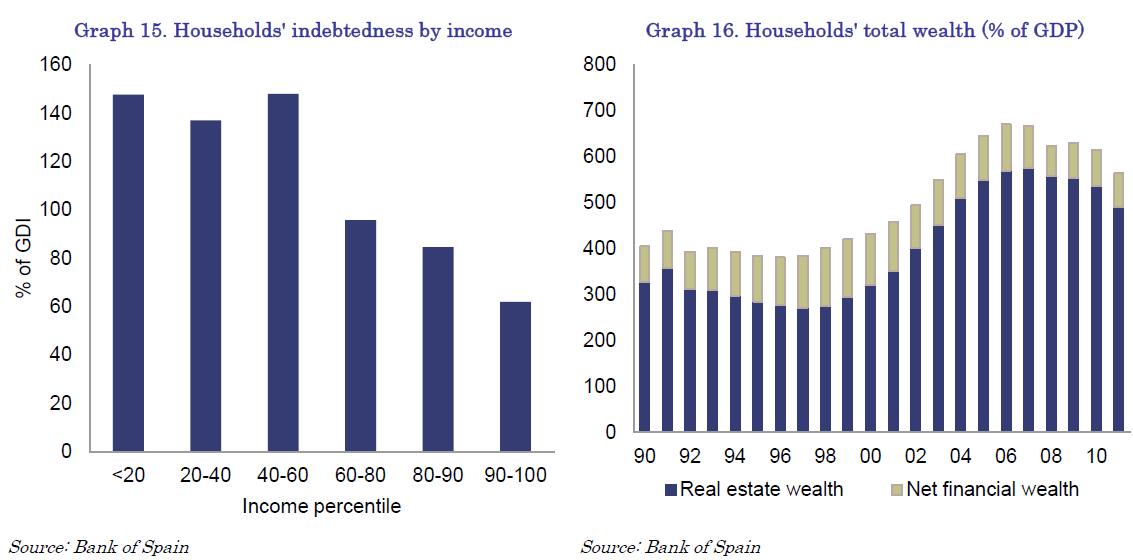
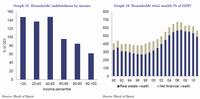
- First, deleveraging of households could happen through an increase of defaults. Currently, doubtful asset ratio of mortgage loans is relatively low, around 3%. However, in the current macroeconomic situation, where additional destruction of employment is expected at least in the short-term, the number of defaults may increase. This event has a high probability of occurrence if the distribution of households' debt by income level is considered. Indeed, according to the Household Financial Survey (HFS) 2008 |5|, households with low incomes (below the 20th percentile) were indebted to the tune of 140% of their income (Graph 15). This group of households is particularly exposed to increases in interest rates. Estimates based on the HFS for 2005 |6| suggest that if interest rates were to rise by 300 basis points, the share of households in the lowest percentile, whose financial burden is above 40% of their income, would increase from 31% to 37%.
- A second way for reducing households' indebtedness is through significant reduction of new credit. However, in order to reduce the huge stock of unsold new dwellings new financing to households will be necessary.
- Finally, households could also deleverage through an advance repayments of current mortgages. However, this option is not likely to result in a quick reduction of indebtedness. Indeed, in the current situation, there is little incentive for households to advance the repayment of their mortgages. The interest rates are relatively low, which is significant given that 99% of total mortgages have variable interest rates linked to Euribor |7|. Furthermore, repayments in advance of the term of the mortgage imply a penalty in terms of commission to be paid by households and would reduce (income) tax deductions in subsequent years. Finally, early repayment by the households with corresponding (liquid) assets would not reduce the economic risk for the banking sector as these are exactly the households that are 'safe', i.e. can afford their debt.
A significant increase in households' debt was driven to a large extent by the residential investment. As consequence, households have accumulated some wealth in terms of real estate assets. Indeed, 86% of their total net wealth is related to housing while the remaining 14% constitutes financial wealth (Graph 16). This can be considered as a mitigating factor given that households' liabilities are just 15% of their total wealth. Thus, even though the size of the accumulated debt is large, it appears manageable given a high level of households' solvency. On the other hand, this wealth depends on the development of house prices. Thus, a further significant fall in house prices would reduce the households' wealth.
Non-financial corporations
The deleveraging process of corporations is on-going, albeit at a relatively slow pace. Spanish NFCs are on average more indebted than the euro-area average. In 2010, the debt of Spanish NFCs amounted to around 141.6% of GDP, compared to 99.4% for the euro-area NFCs. Most of the adjustment took place in the corporations linked to the construction and real estate activities. Overall, the corporate debt-to-GDP ratio decreased by around 7 pps. between 2010 Q2 and 2011 Q4, with firms related to construction and real estate activities accounting for over 90% of this adjustment (6.7 pps. of GDP). Nonetheless, firms in this sector remain highly indebted: their current level of indebtedness is 2.4 times the corresponding level in 2000, compared to 1.5 times the level of 2000 for firms in other sectors |8|. Thus, the bulk of remaining adjustment will need to take place in firms linked to the construction and real estate activities following the pattern observed so far.
Click to enlarge
As in the case of households, the period of adjustment is expected to be long also in the corporate sector: evidence based on international experience suggests a range of time between 5 and 10 years (Aspachs-Bracons et al. (2011)). The usual process of adjustment, according to Ruscher and Wolff (2012), is through a reduction of liabilities, but also by increasing liquid assets. The funds required to change the relation between liabilities and assets would come from higher corporate savings and lower corporate investment. In the absence of higher gross value-added (which will be difficult to obtain in a period when investment is being curtailed), higher savings are achievable through lower labour costs or lower dividend payments. The implications of such a projected development of savings and investment are significant. According to the economic theory and empirical evidence, in the short term, internal demand is adversely affected by lower investment on the part of firms and lower consumption stemming from the reduced gross disposable income of households in the wake of lower compensation of employees. In the medium term, the lower level of corporate investment weighs on economic growth, thus prolonging the adjustment.
The process of adjustment process is underway, although the pace of the correction is slow and, given the size of the imbalances, the length of the adjustment is likely to be long. Indeed, non-financial corporations have increased their savings rate (to 13% of GDP compared to below 6% in 2007) and, more importantly, significantly reduced their investment (to around 12% of GDP compared to almost 17% in 2007), which allowed them to reach a net lending position in 2011 (0.8% of GDP), for the first time since 2003 (Graph 9).
The size and scope of the necessary adjustment implies subdued domestic demand in the medium-term with significant downside risks related to the high vulnerability of private sector to interest rates increases. Consequently, economic growth is expected to be weak, with adverse implications for the debt repayment capacity of households and non-financial corporations. In this context, there are potential risks of negative spillover effects to the stability of financial sector. Additionally, the reduction of private debt is a necessary condition for reducing external debt.
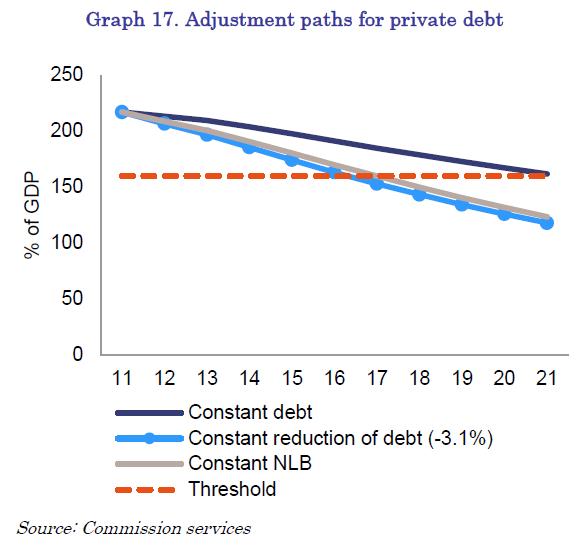
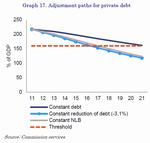
The pace of adjustment depends on several factors: first, the evolution of GDP itself; second, the financing capacity of households and non-financial corporations; and, third, the channelling of new financial resources towards reducing liabilities or increasing financial assets. Graph 17 illustrates different adjustment paths for private debt. Nominal GDP is assumed to grow at the potential real output growth rate projected by Commission services augmented by an increase in prices of around 2% every year. With regard to the evolution of liabilities of private sector, three scenarios are considered: a) financial liabilities remain constant, in nominal terms, during the whole period; b) financial liabilities shrink at the same pace as in 2011 Q3 (-3.1%); c) the net lending position of households and non-financial corporations remains constant over the whole period in terms of GDP, and equal to the last observed value, namely 4.5% of GDP in 2011 Q3, and all these resources are used to reduce financial liabilities.
If financial liabilities were to be maintained at their value in 2011 Q3 for subsequent years, the indebtedness ratio would not reach the scoreboard threshold until 2021, i.e. ten years later. Furthermore, the second and third scenarios yield similar paths, reaching the threshold within one year of each other. In the third scenario (the net lending position stays constant as a share of GDP over subsequent years), the scoreboard threshold would be reached in 2017, i.e. six years later. However, in order to assess this result properly, it should be noted that the underlying assumption on the evolution of net lending capacity is favourable. Indeed, the current net lending capacity, 4.5 pps. of GDP, prevails in a context of very low investment rates by households and corporations, a low level of household consumption and low profit distribution (i.e. dividends) of corporations.
Click to enlarge
The long period of economic boom of the Spanish economy was accompanied by an increasing current account deficit, the three-year average of which reached 6.5% of GDP in the 2010 against the MIP scoreboard threshold of 4%. As a consequence, the net international investment position (NIIP) has been deteriorating: it registered -89.5% in 2010, thus substantially in excess of the MIP scoreboard threshold of -35%. This large external imbalance represents a significant vulnerability for the Spanish economy in terms of both potential financing problems and the interest burden.
3.3.1. Composition and development of external indebtedness
Massive private capital inflows into Spain for an extended period of time following euro-area accession are key to understanding the emergence of large internal as well as external imbalances. On the external side, such capital flows helped to accommodate the sustained and increasing current account deficits. The current account position of a country can be viewed in two alternative ways, either as the sum of the net trade balance and net income from abroad (external dimension) or as the difference between domestic savings and investment (internal dimension). From the internal point of view, persistent current account deficits were driven by an excess of investment, especially housing investment, whereas domestic savings remained rather stable (see Section 3.1 on saving-investment imbalance for more details).
From the external viewpoint, the large current account deficits in the boom years were mainly driven by trade deficits in goods arising from dynamic growth of imports, while the growth of exports remained relatively stable. The increasing import penetration of the domestic market was supported by a buoyant domestic demand. In addition, large capital inflows led to an internal appreciation, which, in the absence of a national currency, manifested itself in an increase of prices and wages. This resulted in a persistent positive differential between domestic and import price inflation, thus, reducing Spain's price competitiveness (for more details see Section 3.4 on the competitiveness and export performance). Since 2007, the trade deficit has been substantially corrected by a significant rise in exports of goods and services and marked decline of imports, thus bringing the trade balance close to equilibrium (Graph 2).
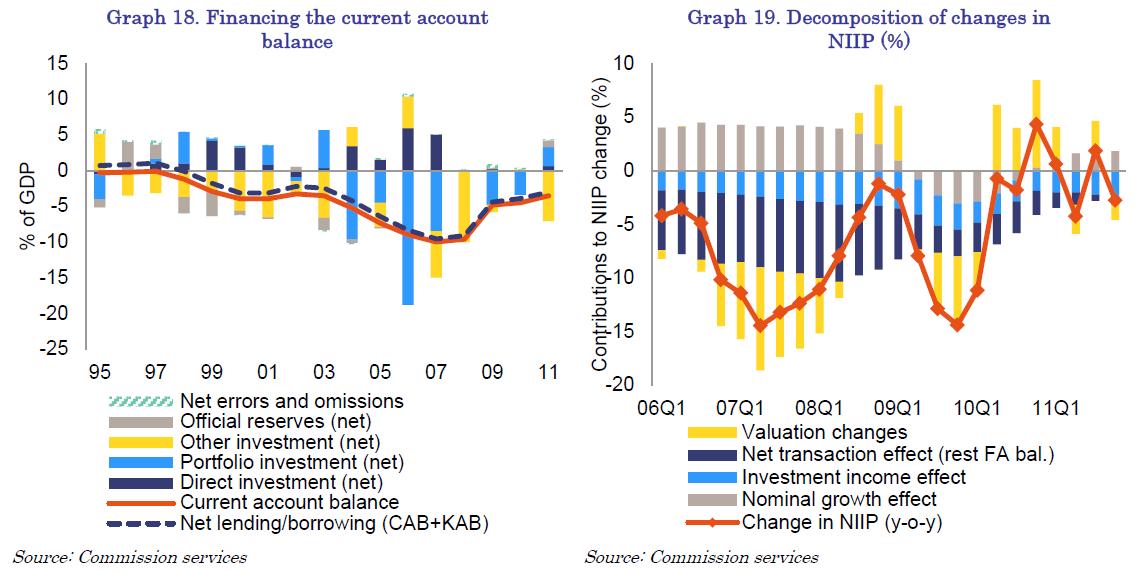
In addition to its significant size, the composition of Spain's NIIP further increases the vulnerability of Spanish economy to external shocks (see Graph 3 on the composition of NID? and Graph 18 on the financing of the external deficit). Indeed, external liabilities are concentrated in portfolio investment (both equity and debt) and "other" investment (accounting for 67% of total external liabilities). With regard to portfolio investment, Spain has a negative position in debt (mostly due to liabilities related to bonds), while its equity position improved sharply in the last few years and turned positive in 2010. In addition, the large negative position in "other" investment arises mainly from bank loans. The high weight of these financial instruments increases the vulnerability of the economy to external shocks as they are more volatile and sensitive to changes in the investor confidence. Furthermore, loans and bonds are non-state-contingent (i.e. they have to be serviced whatever the economic situation of the debtor) unlike equity (i.e. dividends are paid only if the economic situation of the "debtor" allows it). Finally, the large weight of external debt implies a significant burden in terms of interest payments. The high degree of vulnerability of Spain's external position is also illustrated by the so-called 'solvency ratio', which is the ratio of assets held abroad to foreign liabilities (excluding direct investments in both cases). This ratio halved from around 0.8 in the early 1990s to about 0.4 at present, indicating that Spain could cover only 40% of its external liabilities in case of the sudden stop in external financing.
Click to enlarge
In terms of maturity, gross external debt (GED) held by non-financial actors is almost exclusively long-term. Total GED amounted to around 165% of GDP in Spain in end-2011. Short term debt (mostly currency and deposits) amounted to about 56% of Spain's GDP, almost exclusively concentrated in the financial system (including banks and the central bank).
The vulnerability of Spain's external position has been highlighted by recent episodes of large private capital outflows. Capital flows in the euro area can be decomposed into private capital flows and other/public flows (including Eurosystem financing). According to S. Merler and J. Pisani-Ferry (2012), Spain experienced two episodes of private capital outflows - in spring 2010 and summer 2011 -, which could qualify as sudden stops. Since these private capital outflows were compensated by equally large public capital inflows, the sudden stops are not evident from the official balance of payment statistics.
Moreover, the composition of Spain's foreign asset and liability portfolios also has implications in terms of valuation effects (Graph 19). Spain suffered from large negative valuation effects in the period 2001-2007, which contributed to a rapid deterioration of Spain's NIIP (defined as the sum of the cumulative current account deficits and valuation effect). The negative valuation effect, estimated to be around 25% of GDP (Goldman Sachs (2011)), can be decomposed further into an exchange rate effect and a price effect. Since Spain has maintained a net asset position in foreign currency, any euro appreciation generates negative valuation effects. In addition, Spain's past large negative net equity position has resulted in additional negative valuation effects during periods when equity prices were rising. In turn, since 2007, the valuation effects have been mostly positive, and are estimated at between 10-15% of GDP. Hence, in the case of Spain, the valuation effect has played a stabilising role since it turned negative in 'good' times and positive in 'bad' times. However, due to some changes in the composition of the foreign portfolio (in particular, the shift to a net equity position), valuation effects may be more limited in the future.
3.3.2. Assessment of the sustainability of Spain's external debt
The correction of the external imbalances started in 2008 with the burst of the housing and credit booms in the wake of the on-going crisis. The current account deficit has been shrinking in line with a strong decline in imports (mostly due to a very weak domestic demand) and a strong export performance (for more details see Section 3.4 on the competitiveness and export performance). Indeed, according to the latest available data, the current account deficit declined to 3.4% of GDP in 2011 and this downward trend is expected to continue in the medium-term. According to the Commission Services' Spring Forecast, current account will be close to balance by 2013.
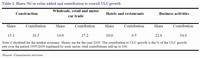
In order to better understand the likely persistence of this downward trend, it is important to assess how much of this adjustment has been due to structural changes and how much is driven by purely cyclical developments. One important structural change is the downsizing of the housing and construction sector, which also has significant implications for the trade balance. Indeed, construction activity generally contributes to a trade deficit due to the associated imports of foreign goods; both construction materials and household equipment. Furthermore, construction sector does not export. Considering the direct and indirect import content of construction production, the downsizing of this sector would explain around one-sixth of the adjustment of external deficit (6 pps. of GDP between 2007 and 2011) |9|. Thus, so far, cyclical factors seem to have played a greater role in the adjustment of the trade deficit. In particular, the rapid decline in imports was caused mainly by weak domestic demand rather than by a structural shift of domestic demand away from imported goods and services. Also, the observed improvement in average productivity has been largely cyclical in nature to the extent it was driven by a steep fall in employment.
The key question concerns the size of the current account adjustment that will be required to improve the sustainability of Spain's external position. As a minimum, one needs to consider the size of the current account adjustment necessary to stabilise NIIP-to-GDP ratio. In case of Spain, it can be argued that the current ratio of NIIP to GDP - around -90% of GDP - is excessive and merely stabilising this at current levels will not be sufficient to secure market financing. Accordingly, the pertinent question is what should be the size of the current account adjustment to bring the NIIP-to-GDP ratio to the -35% of GDP threshold included in the MIP scoreboard.
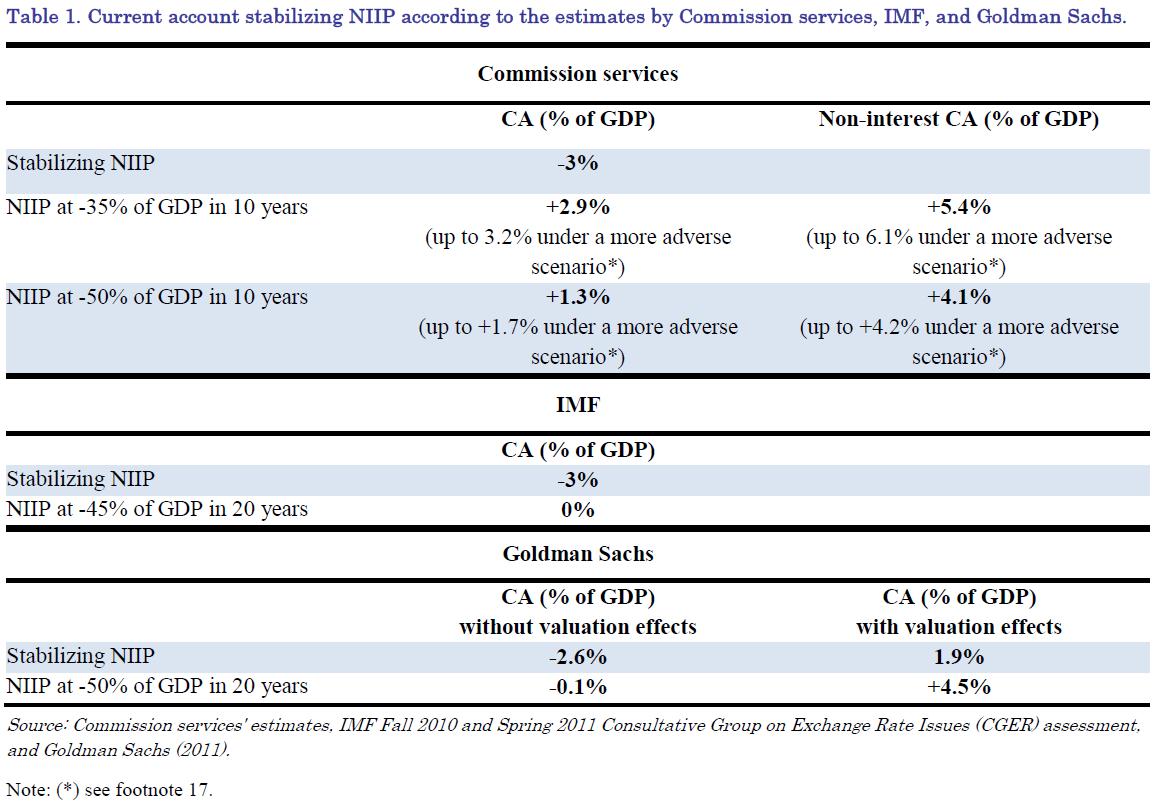
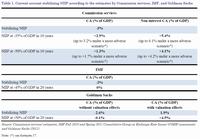
According to the Commission services' estimates, assuming 3.4% nominal growth in Spain, a current account deficit of 3% of GDP would stabilize the NIIP at the current level. In order to reduce the NIIP position to the MIP threshold of -35% of GDP by 2022, under a baseline scenario, Spain would have to run an average current account surplus of 2.9% of GDP or 5.4% if the income balance is excluded (the income balance consists mainly of interest income and will remain negative in Spain's case owing to the negative NIIP - see Table 1. If a more gradual adjustment path is considered (i.e. reducing NIIP to -50% of GDP by 2022), the required CA surplus declines to 1.3 and 4.1, respectively. In addition, the range of estimates increases when more negative assumptions regarding the nominal growth and interest rates are considered |10|. According to Commission services' estimates |11|, despite a significant adjustment since 2007, Spanish REER appears still somewhat overvalued with respect to the 'equilibrium' REER level that would be needed to equalise the underlying current account with the current account norm.
According to the IMF estimates, Spain would need to maintain a balanced current account in order to reduce its NIIP to -45% of GDP by 2031 (implied REER depreciation is around 18%). Alternative estimates from Goldman Sachs, over a similar 20-year horizon, point to a possible impact resulting from the valuation effects. In order to achieve a NIIP of -50% of GDP, assuming an average 3% nominal GDP growth and without considering the valuation effects, the necessary adjustment would require a sustained balanced current account (as in the IMF estimates). However, under the same assumptions but including valuation effects, the required adjustment is much larger and would require a persistent current account surplus of around 4.5% of GDP over the whole period. The corresponding price adjustment (REER depreciation) is estimated to be around 20%. This estimate should be considered an upper bound given that future negative valuation effects may be smaller than it was the case in 2001-2007 period considered by Goldman Sachs.
While it is clear that estimates of the CA balance necessary to reduce the current NIIP position vary (due to different assumptions on real growth and interest rates as well as on the assumed target and timeline for the adjustment), there is no doubt that a significant reduction of the current NIIP would require at a minimum a balanced CA over the next two decades. Therefore, while the narrowing of the current account deficit observed in the last few quarters is a positive sign, it is far from what would be required to bring Spain's external position into sustainable territory. In particular, a transition from current account deficits to balance or even surplus requires a deep, structural re-adjustment of the Spanish economy.
Click to enlarge
External surpluses could be achieved by either expenditure reduction (reducing domestic demand) or expenditure switching through improvements in competitiveness. Expenditure switching would involve switching production towards the tradable sector and switching domestic demand towards a higher share of non-imported goods and services. Such expenditure switching should affect not only final goods but also intermediate inputs. Indeed, Spain is characterised by a relatively high import content of its exports compared to its main European peers (see Cabrero and Tiana (2012)). The lack of vertical integration of Spanish firms and/or the lower competitiveness of Spanish intermediate suppliers, possibly due to their small size, could explain this result. As a result, an increase in Spanish exports also has a relatively large positive impact on Spanish imports and, hence, the net (positive) impact on the trade balance is reduced. In addition, Spain faces several other obstacles to reducing its trade balance (see Section 3.4 on the competitiveness and export performance).
In addition, a shift to current account surpluses requires a structural adjustment in terms of saving and investment decisions of all the sectors of Spanish economy (see Section 3.1 for more details on saving-investment imbalance).
The large imbalance in Spain's external position increases the vulnerability of the Spanish economy in terms of both potential financing problems and the interest burden. While the flow adjustment in terms of current account balance has been significant, it is far from sufficient. In order to restore the sustainability of its external position, Spain needs to move into a persistent current account surplus. A preferred adjustment path would involve a switch of resources from non-tradable to tradable sectors. That can be achieved by increasing the competitiveness of Spanish economy and further improving its export performance.
3.4. COMPETITIVENESS AND EXPORT PERFORMANCE
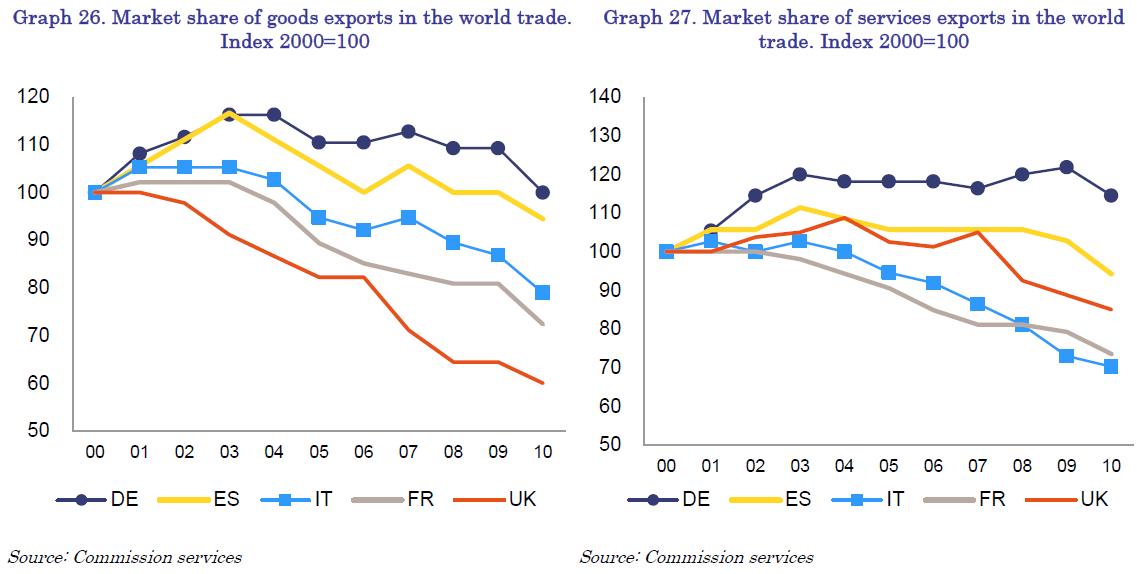
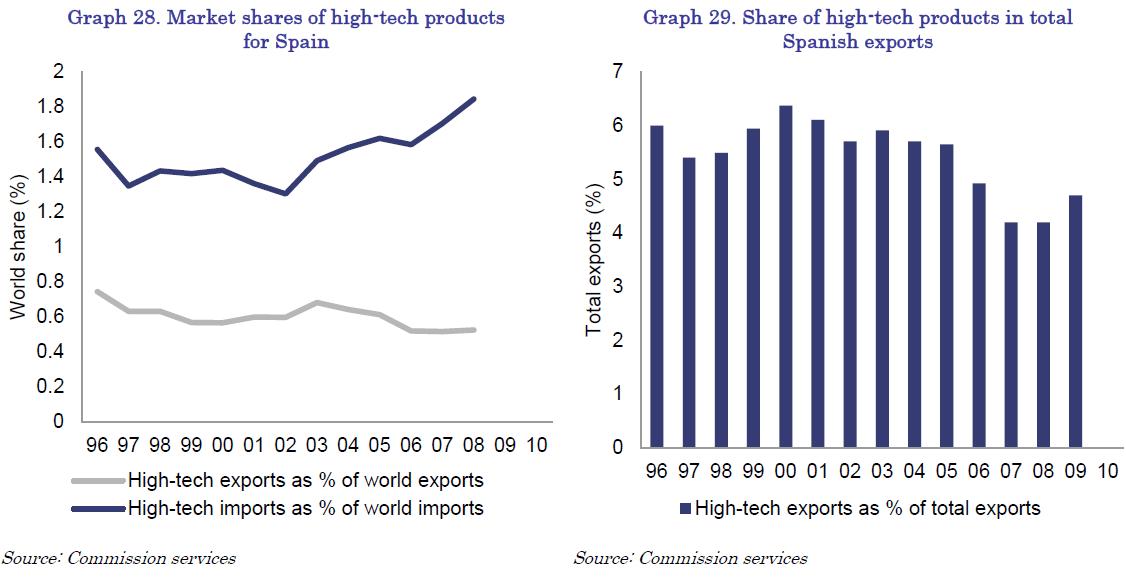
The external performance of the Spanish economy within the monetary union has been mixed. Spanish price competitiveness deteriorated significantly due to growth of wages in excess of productivity growth, resulting in an appreciation of its unit labour costs. However, ex-post competitiveness, that is the evolution of Spanish exports' market share, was relatively favourable compared to other euro-area economies (although it declined by 11.6% in 2006-2010, according to the MIP scoreboard, compared to the threshold of -6%).
3.4.1. Price and cost competitiveness
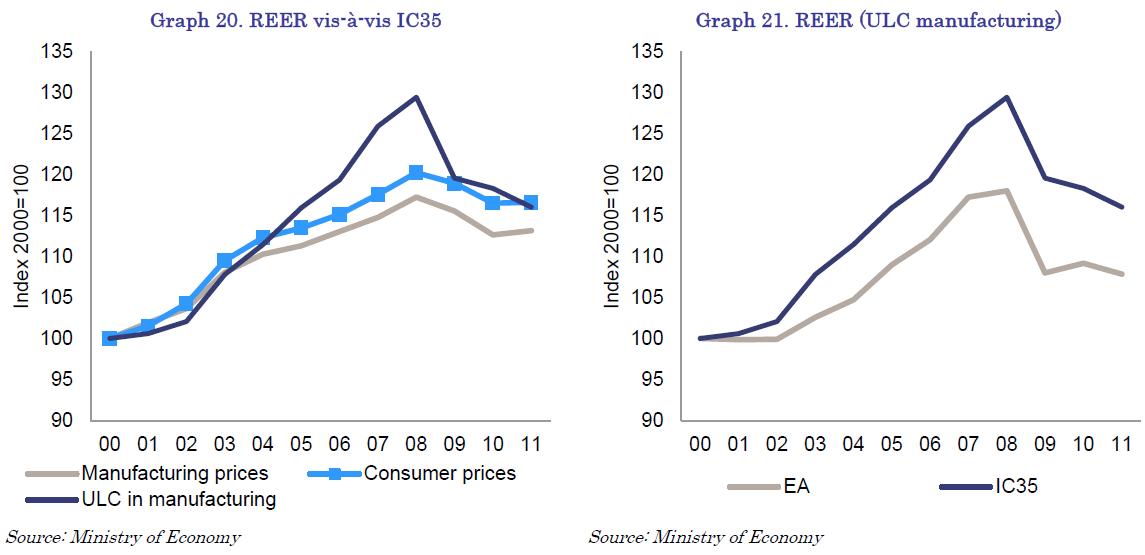
According to different proxies, Spanish economy lost its price competitiveness between 2000 and 2008 |12|. More specifically, the accumulated REER appreciation was around 20%, with the exception of the REER based on unit labour costs vis-a-vis IC35, in which case the accumulated lost was 29% (Graphs 20 and 21) |13|. The relatively worse development of price competitiveness vis-a-vis IC35 rather than vis-a-vis the euro-area countries mainly reflects the appreciation of euro in that period (around 24% against the US dollar). All in all, independently of the indicator used, the loss of competitiveness for the Spanish economy was significant. The following sub-sections describe in greater detail the factors behind this loss of competitiveness.
Click to enlarge
Very low productivity growth, 0.4% on average, and high growth of wages, 3.6% on average, over the period of 1999-2008, lie behind the deterioration of price competitiveness recorded during the same period. Low labour apparent productivity levels, generally below those of other EU countries were partly the result of the large share of construction sector in Spanish GDP. This sector tends to be characterized by below-average productivity since it is very labour intensive. However, other sectors of the Spanish economy also experience relatively low productivity, with manufacturing having the largest gap compared to the euro-area average. Indeed, according to Fedea-McKinsey (2010), productivity levels in Spain's manufacturing sector are 15% below those in EU-15 and 40% below the United States. During the boom period, growth in Spain was driven mainly by strong growth in labour utilisation, while productivity (measured by TFP) had a negative contribution. The main reasons for such a poor performance include the highly fragmented business fabric, significant net migration, which contributed to job creation in low skills and low productivity sectors, and institutional factors including relatively limited spending on R&D and innovation as well as an onerous regulatory environment for businesses.
Where firm structure is concerned, more than half of workers in Spain are employed in small companies (below 50 employees) compared to 23% in Germany and 32% in France. Even more strikingly, over 90% of firms are micro-firms (less than 9 employees and with a turnover below EUR 2 million) compared to 83% in Germany. These very small companies tend to be characterised by lower levels of productivity; thus, a larger share of smaller companies also implies a lower average level of productivity. At the same time, it is worth noting that large Spanish companies are equally, or even more, productive compared to their European peers. Indeed, Fedea-McKinsey, op. cit. demonstrate that Spain would have a 30% higher level of productivity than Germany if it maintained current productivity levels but changed its company-size mix to resemble that of Germany. In a similar vein, Altomonte et al. (2011) estimate that Spain's exports would be 25% higher if it had the same industrial fabric as Germany. There are several explanatory factors behind firm distribution in Spain, from the sector specialization pattern to possible regulation with lock-in effects that act as a barrier to firms' growth.
3.4.3. The development of unit labour cost
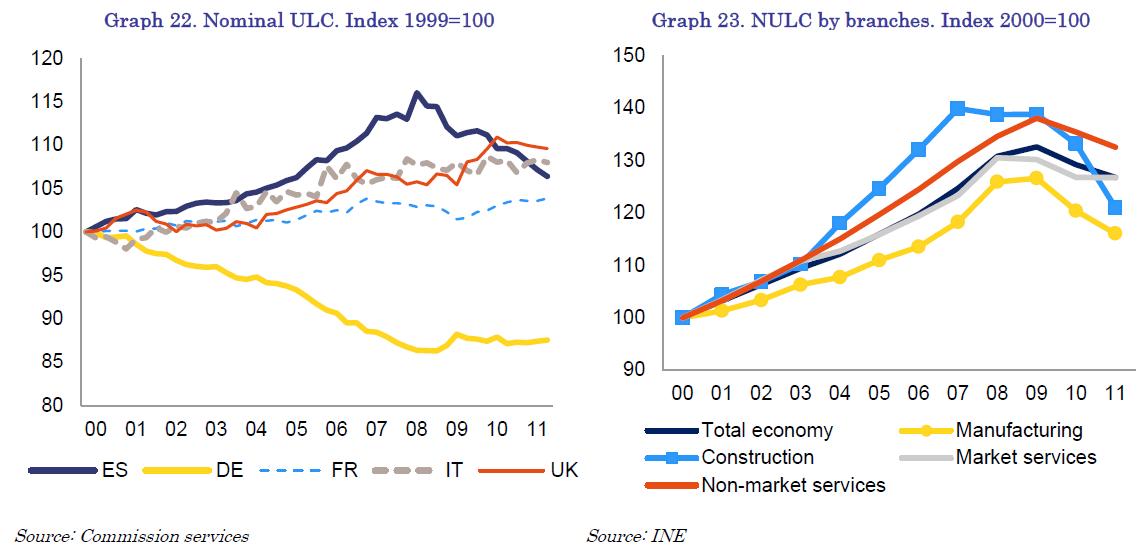
In the boom years, Spain's price and cost competitiveness deteriorated sharply driven by high growth of wages well above the corresponding increases in productivity, and leading to growth of ULC exceeding the euro-area average (Graph 22). High growth of wages was supported by a booming domestic economy and decreasing unemployment. Apart from cyclical factors, the evolution of wages was also influenced by the collective bargaining system and by the structure of the labour market, more generally.
Click to enlarge
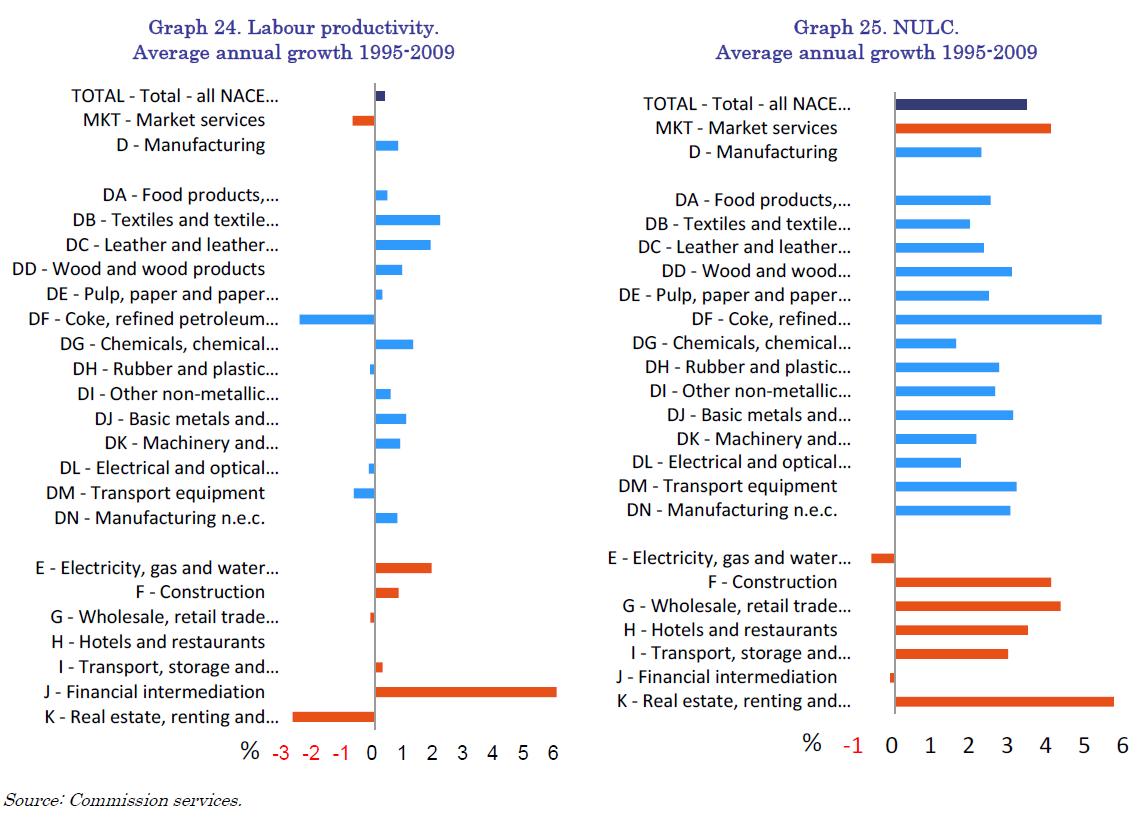
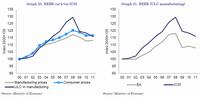
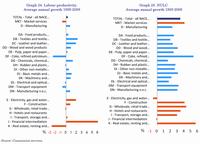
The phenomenon of strong ULC increases across most sectors over the period 1995-2009 contributed to the loss of aggregated competitiveness in Spain. The only two exceptions were: "financial intermediation" and "electricity, gas and water supply" (Graph 24). In addition, market services experienced significantly higher ULC growth than manufacturing. It might be argued that cost developments in services - being mostly non tradable - are of little relevance when considering international competitiveness. However, services are an important input in manufacturing exports and could worsen the external competitiveness of goods to the extent that the deteriorations in the cost competitiveness of services are passed through to the final cost of tradables. Indeed, the services content of manufacturing exports in Spain is close to one third of the exports value and this share has increased over years |14|. In addition, empirical analysis shows that labour productivity of domestic services has a significant impact on export growth (about one-fourth of the effect of the REER) |15|.
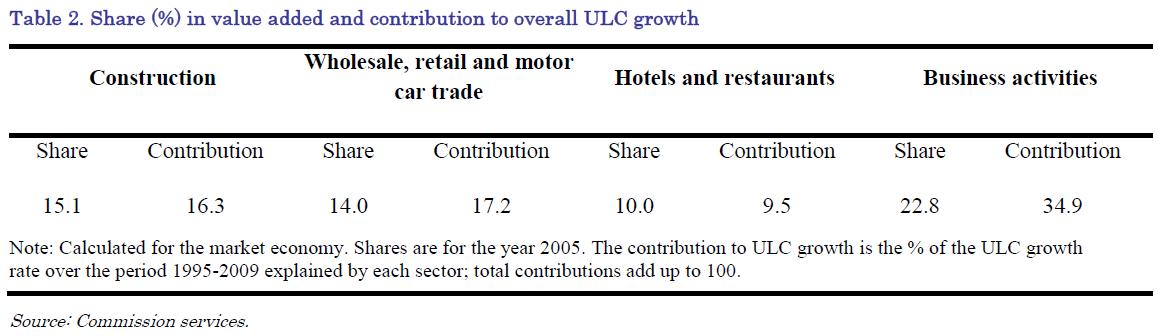
Four services sectors - representing close to 60% of the market economy's value added - accounted for almost 80% of aggregate ULC growth in Spain between 1995 and 2009 (Table 2). In addition, services are characterized by a higher share of labour costs in the total output values as compared to manufacturing (Graph 25). That implies that the impact of wage developments on total costs in services is relatively more important.
Click to enlarge
3.4.4. Labour market and competitiveness
The collective bargaining system, which prevailed in Spain until the reform enacted on 10 February of this year, created additional rigidities in the responsiveness of wages to economic and firm-specific conditions since wage agreements took place mainly at industry and provincial levels. Empirical evidence (e.g. Izquierdo et al. (2003)) suggests that wage increases tend to be higher at the intermediate level (i.e. provincial industry level) than at the national and company levels |16|, while the wage distribution is more compressed compared to fully centralised or fully decentralised levels. In addition, the predominance of provincial and industry agreements left little room for negotiations at the level of the individual firm. Moreover, the so-called "ultra-actividad" clause |17| reduced the opportunities for renewing a contract without improving its conditions. Finally, wage indexation was also present in most collective agreements, although it was not prescribed by law. Both "ultra-actividad" and wage indexation contributed to a further acceleration of wages in the context of a booming economy.
Click to enlarge
The duality of the Spanish labour market was rooted in high employment protection for regular permanent contracts and low protection for temporary contracts coupled with a high turnover rate in temporary jobs and low conversion rates from temporary to permanent contracts. It induced firms to respond to economic fluctuations through high turnover at the margins of the labour market. The volatility created by the dual labour market generated strong job creation in booms and exacerbated job destruction during recessions. In addition, this system facilitated job creation in less-productive industries, which required less-qualified workers, which are over-represented among temporary workers. Finally, this duality had a pervasive impact on the wage developments, reducing the responsiveness of wages to the economic conditions. This was particularly acute in 2009, but also to a lesser extent in 2010 when Spain entered into a recession and the unemployment soared while the impact on wages was much more muted. As the job destruction was concentrated among the temporary workers, characterised by lower wages as well as lower bargaining power as compared to the permanent workers, its impact on wages was somewhat limited. All in all, the duality of the Spanish labour market contributed to a lower productivity as well as pervasive wage dynamics. Recently adopted labour market reform aims to reduce the duality and to increase the responsiveness of wages to firm-specific conditions (see the Box 4 on the summary of the labour market reform and Section 2.3 of the SWD 2012 for more detailed discussion).
Box 4: Labour market reform - summary and assessment On 10 February 2012, Spain adopted a comprehensive labour market reform which entails substantial changes to employment protection and collective bargaining. The reform was adopted through a Royal Decree law and entered into force immediately with its publication. In addition, a legislative proposal adopted by the government is currently under discussion in Parliament and takes additional steps in the same direction followed by recent reforms, while introducing some new elements notably regarding collective dismissals and employment protection in SMEs.
Salient features of the reform
Changes to employment protection aim to foster job creation and reduce labour market duality by lowering the gap in employment protection between permanent and temporary contracts. The reform reduces the severance payment for unjustified dismissals from 45 to 33 days per year of service, up to a maximum of 24 months. The reform also removes the worker's right to receive wages for the whole duration of a process against unfair dismissal (the so-called "salarios de tramitacion") in case the courts accept an appeal. The conditions for justified dismissals on economic grounds, which imply a reduced severance pay of 20 days per year of service, are clarified and made more specific, with a view to reduce legal uncertainty.
A new labour contract for SMEs and targeted subsidies aim to promote job creation in small businesses. The reform introduces new open-ended contract for SMEs with less than 50 employees, which includes a trial period of 1 year, incentives of up to EUR 3000 for hiring first-job workers below 30 years of age, a tax deduction equivalent to 50% of the unemployment benefits to which the hired worker is entitled, and additional hiring subsidies for young and long-term unemployed. Most of the incentives are conditional on keeping the worker for at least 3 years.
Changes to collective bargaining increase flexibility at firm level and give precedence to firm-level bargaining. Employers have the possibility to opt out from collective agreements for economic (fall in revenues or sales for at least 2 consecutive quarters), technical or organisational reasons via an agreement with workers' representatives. Moreover, firm-level collective agreements (concluded with union representatives) effectively prevail over other levels on a wide range of issues, including working conditions, wages, paid overtime, working time and other elements covered by higher level agreements. The indefinite extension of expired and not-renewed collective agreements (so-called "ultra-activity") is limited to a maximum of 2 years. In the absence of mediation and/or arbitration procedures, the collective agreement will no longer be in force and the higher-level collective agreement will apply instead.
Active labour market policy measures aim to improve employability and provide financial incentives for hiring employees. Temporary work agencies are allowed to operate as recruitment and placement agencies alongside the public employment service. Employees with seniority of at least one year are entitled to 20 hours of professional training per year in the form of a paid leave for training. The age limit to conclude apprenticeship and training contracts is raised to 30 years as long as the unemployment rate remains above 15%.
Assessment
The labour market reform represents a decisive progress, more ambitious than previous reforms in this area. The reform contributes to increasing labour market flexibility by providing for greater flexibility at company level and by setting conditions for a more rapid adjustment of wages. Notably, the reform includes a sizeable reduction in the costs of dismissals for permanent contracts both directly through lower severance payments in case of unfair dismissals and indirectly via a broadening of the definition of justified dismissals.
The effects of the reform are however made uncertain by a number of elements. First, the elimination of the "express" dismissal and of the prior administrative authorisations for collective dismissals might lead to an increase of legal disputes. Second, the reform re-establishes the limitations introduced by the 2010 reform on the renewal of temporary contracts. Specifically for SMEs, the new contracts with extended trial periods can become a substitute for temporary contracts. It remains to be seen, however, to what extent this will lead to a greater use of permanent contracts and greater employment stability. The possibility for a worker to be hired with consecutive apprenticeship contracts, which can be terminated at zero costs, goes in the opposite direction of that envisaged by the reform. The costs of dismissal for permanent contracts also remain high compared to those for temporary contracts. Finally, financial incentives for employment creation risk being a costly and inefficient labour market instrument.
Greater decentralisation of collective bargaining is an important element to improve the flexibility of the labour market. The priority given to firm level agreements, by allowing firms to derogate from sector agreements, and the introduction of binding arbitration (if other dispute resolutions are not established in inter-professional agreements) point to an effective decentralisation of wage bargaining. The limitation of "ultra-activity" may contribute to reduce the inertia of the collective contracts and to increasing the opportunities for renewing a collective agreement without improving necessarily its conditions. To the extent that large firms have stronger bargaining leverage than small firms, the reform benefits large firms in particular. The decentralisation of wage bargaining could favour a reduction in the very high level of structural unemployment. However, the effectiveness of the reform will ultimately depend on the use of firm-level bargaining in practice.
The reform has not tackled the practice of ex-post inflation wage indexation usually applied in collective agreements. However, a recent social partners' agreement effectively suspended wage indexation for the period 2012-2014. The ultra-activity limit of 2 years still appears to be too long and opting-out clauses might not be easy to implement for SMEs.
3.4.5. Export and import developments
Spain's world market share in goods and services exports has decreased somewhat, (Graphs 26 and 27). However, this decline has been less pronounced than in the case of other euro-area countries (with the sole exception of Germany). According to the WTO data, Spain's share in world manufacturing trade has been relatively stable at around 2% (higher for automotive products - around 5%). Regarding services trade, Spain's share in world exports has oscillated at around 4%. Spain's share in world exports of tourism services fell but this fall was compensated by an increase in export shares of commercial and transport services. Indeed, exports of tourism services seem to have exhausted their sources of growth. At the same time, non-tourism services have grown robustly (by 9% in 2011), reaching over 57% of total export of services in 2011. The main driver has been services to firms, probably related to Spanish direct investments abroad, which recorded significant rates of growth.
The relatively resilient performance of Spanish exports is somewhat counter-intuitive given the loss of price and cost competitiveness vis-a-vis other euro-area members since 1999. Empirical evidence suggests that improvements in total competitiveness (through higher value added or product differentiation), specialization in products with a low price elasticity (medium and medium-low technology content), and geographical diversification are the most important drivers of this comparatively better performance of Spanish exports.
In part, Spain's good export performance appears to be due to improved product specialisation |18|. Relative unit values (RUV) evolution embodies information on the relative ability of countries to improve the composition and quality of export production over time. Although the level of the indicator for Spain in 1999 suggests an export specialisation in up-scale production segments relative to imports, this edge was very low when compared with most other EU economies. However, since 1999, Spain has substantially increased its RUV, which is consistent with a quality upgrading of the Spanish export basket but also with a growing specialization on goods with rising international prices |19|. In addition, the weight of goods with a high technological content in total Spanish exports is small (about 5% during the period of 1999-2008, see Graph 29, compared to almost 20% in Germany). On the other hand, goods with a low technological content make up more than 20% of total exports, compared to just 13.5% in Germany.
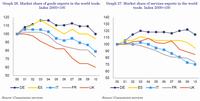
Click to enlarge
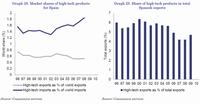
Click to enlarge
Where geographical diversification is concerned, Spain has increased its exports to non-EU countries over time, especially emerging economies such as BRIC and Middle Eastern and North African countries. Although the rest of EU-15 countries remain the main destination of Spanish exports, their share in total Spanish exports has decreased over time from 71% in 2000 to 63% in 2010. The geographical composition effect of Spanish exports growth is positive (as high as 1.5 pps. for the period 2000-2005 and 0.4 pps. for the period 20052010), and indicates the positive contribution from a specialization in dynamic markets (experiencing growing imports).Interestingly, the same export growth decomposition shows a high negative effect stemming from competitive factors reflecting the weak competitiveness edge of the Spanish exports (about 2.5 pps. in the first half of the decade and 3.5 pps. in the second half).
Thus Spain's relatively stable market shares evolution over the last decade has been driven by the high share in total exports of dynamic products and (above all) of dynamic destination markets, while the competitiveness of the Spanish exports have contributed negatively. This could be a possible factor explaining the lack of correlation between market shares and price competitiveness measures.
However, the loss in price competitiveness may be overestimated for Spain if one considers the evolution of the real effective exchange rate for the whole economy. Export activity is very concentrated in Spain - only 1% of firms account for two thirds of goods exported. Studies have shown that these exporting firms tend to be larger, more productive, and have lower ULC growth than the Spanish average. It is the characteristics of these firms that ultimately determine the external competitiveness of the Spanish economy. Hence, the aggregate indicator of the competitiveness for the whole economy is likely to provide a biased picture. In fact, according to the study by Antras and Costinot (2011), during the period 2000-2008, Spanish firms with over 200 employees increased their exports most and experienced slower growth in ULC than smaller Spanish firms. This study also demonstrated that, when ULC are considered at a firm level, instead of at the aggregate, economy-wide, level, Spain's export developments appear to be less paradoxical.
In the analysis of competitiveness it is worthwhile considering the role of imports. More precisely, analysing the import content of exports provides insight into the impact of imports on competitiveness and the process of internationalisation of the economy. The import content of exports for the Spanish economy at large moved from 27.6% in 1995 to 39% in 2007 (Cabrero and Tiana, op. cit. In this respect, indicators based solely on exports overstate the competitiveness of the economy as well as the contribution of exports markets to GDP growth. However, increasing import content of exports also shows the increasing integration of the Spanish economy in the global value chain, which may have important implications for Spain's future competitiveness. First, international trade provides access to a variety of inputs, which could increase competitiveness of a country's exports. Second, integration in the global value chain may increase competitiveness in specific tasks rather than in product or industry competitiveness. Import penetration into a domestic market may be a sign of a low competitiveness of domestic producers. However, in case of Spain, high income elasticity of imports (2.2 compared to 1 in France and in Germany and 1.63 in Italy) suggests that booming demand is a major factor.
Since 2010, the acceleration of productivity and the moderation of wage growth have resulted in decreasing unit labour costs, partially compensating for significant cost/price competitiveness losses before 2009 (Graphs 20 and 21). Considering REER vis-a-vis industrialized countries (IC-35) deflated by the HICP, the cumulated appreciation of REER in 2000-2008 was significant (around 20%) but the following adjustment was much smaller (around 3%). However, REER based on a ULC in manufacturing deflator is a better indicator to assess cost competitiveness. According to this index, Spain has already recovered slightly more than a third of the competitiveness lost up to 2008. While the REER appreciated by 29% until 2008, it has since fallen by 10%. Paralleling this improvement in price/cost competitiveness, Spain has also started to re-gain export market shares.
Since 2010, productivity growth has accelerated and this trend has been even more pronounced in the last few quarters. Part of the improvement in productivity is linked to the sharp downsizing of the construction sector (see Section 3.5 on the housing market imbalance for more details), which could be considered a structural change. However, the observed increase in productivity was also due to a larger fall in employment than the fall in output. Indeed, a sharp increase in the unemployment rate clearly illustrated that labour shedding took place in all sectors of the economy. All in all, the recent increases in productivity have therefore been driven by both structural as well as cyclical components. Nevertheless, despite recent increases, there is large scope to increase productivity in all sectors of the economy: as mentioned, Spain has suffered both from low productivity levels (vis-a-vis EU-15) and from low productivity growth. Productivity has thus been as important a driver of competitiveness as prices (wages). Even if past export performance can be explained by factors other than price competitiveness, the unwinding of external imbalances will need to take place through an improvement in relative prices, at least in the short run to speed up the adjustment process.
Wages started to moderate only in 2010, even though the Spanish economy had entered into recession already in 2009 and unemployment surged to record-high levels. Rigidities in the collective bargaining system were the main factor behind this. In particular, due to the collective agreement signed in 2008, there was a strong increase of wages in 2009, despite a complete reversal of the economic cycle. Since 2010, wage growth has moderated, driven to a large extent by wage cuts and wage freezes in the public sector as well as by a negative wage drift in the private sector (i.e. actual wages were below the negotiated level). Despite the observed moderation, it can be argued that, given the current rate of unemployment the adjustment could have been stronger. The moderation of wage growth is expected to continue in the medium term as the economy enters into recession in 2012 and also given the recent wage moderation agreement reached by the social partners and, especially, the recent labour market reform. Indeed, the priority given to firm's level decision on working hours, tasks, and wages, the limitation of ultra-activity to 2 years, and the easing of the conditions for opting out from sector agreements is expected to contribute to a faster adjustment of wages.
In order to sustain the adjustment of the accumulated large external imbalances, further improvements in exports and, thus, in price and non-price competitiveness as well as productivity will be needed. Sustainable or long-term, competitiveness gains can only be achieved through productivity improvements in Spain. Increasing competitiveness through wage compression is a short-term solution, while long-term productivity improvements include reducing overregulation, increasing competition and innovation. Available evidence (Crespo et al. (2012)) find that the main problem of the Spanish economy in terms of competitiveness is not the viability of the firms themselves, but the lack of flexibility of the Spanish economy, which prevents the efficient reallocation of resources among sectors and firms. In this respect, well-targeted structural reforms to boost competition in product and service markets are required (see also Section 2.4 of SWD 2012 for more detailed discussion). Such reforms would also be necessary to ensure that improvements in cost competitiveness (for example, through lower labour costs) are fully reflected and lead to lower prices.
Regarding exports, despite a relatively good performance, Spain faces several obstacles in terms of the structural adjustment of its trade deficit. It has a rather limited export base and while Spanish firms find it relatively easy to enter the export markets, the rates of exit are very high. This is particularly true for SMEs, many of which seem to be lacking an exporting strategy or know-how. Well targeted policy response in this area would be warranted. In addition, Spain has a relatively high import-content of industrial production, thus, an improvement in Spanish exports has a lower impact on GDP than in many other EU countries. Moreover, the weight of goods with high technological content in total Spanish exports is small. Finally, the high external energy dependence is an additional element that contributes to persistent trade deficits. As shown in Graph 30, the negative contribution of intermediate and capital goods to the overall trade balance has been largely reduced since 2009. On the contrary, the contribution of energy goods has significantly increased and it has become the largest contributor to the overall trade deficit. In the recent quarters, this trend has further accelerated and, thus, the energy-related trade balance increased while the non-energy trade balance of goods was close to balance in 2011. All in all, the high dependence on imported oil, especially in the context of elevated oil prices, is weighing on the speed and outlook of the adjustment of the trade and current account balance.
The adjustment of external imbalances is on-going and Spain has made important progress in terms of increasing productivity and improving its price and cost competitiveness. However, a significant part of this adjustment has been due to cyclical factors. A more structural, long-lasting re-balancing of the economy requires tackling structural problems that are hampering growth and limiting competitiveness. Spain needs to continue to implement structural reforms in product and service markets to create new jobs, sustain higher competitiveness (through both wage moderation and increases in productivity), and facilitate the re-allocation of resources to the tradable sector. In particular, given the importance of the export sector for the rebalancing and future growth of the Spanish economy, policy options may need to be considered to promote consolidation of firms, to facilitate exchange of know-how, and to improve access to financing in this sector.
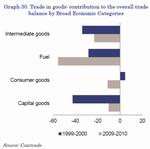
Click to enlarge
The Spanish housing boom has been characterised by its long duration (eleven years between 1997 and 2007), a significant increase of house prices (which almost tripled between 1997 and early 2008), and a huge expansion of production capacity (during the boom period the house production grew at the annual rates twice the size of its the pre-boom levels). The boom in the Spanish housing market was driven by several factors, including abundant availability of external financing at low cost. In addition, demographic factors played an important role. Population growth accelerated due to large inflows of migrants. The working age population recorded a particularly strong increase due to these migration flows (as the majority of migrants were of working age) but also due the entry into the labour market of the baby-boom cohorts of 1970s. Additionally, female participation in the labour market increased, which gave an impulse to labour force growth. All in all, the demand for housing increased rapidly, while the supply of houses responded with a lag, thus putting upward pressure on house prices. Population factors continued feeding significant housing demand and pushing the prices upward, creating an illusion that residential investment was a safe asset, with significant potential capital gains and hardly any risk. Finally, these housing needs were easily converted into actual housing demand as financial institutions relaxed their credit conditions at the same time as the increase in house prices boosted the value of available collateral for mortgage loans.
Econometric evidence supports this explanation about the process of the Spanish housing boom. The QUEST model calibrated for Spain reveals the important role played by the reduction of interest rates. Graph 31 shows the shock decomposition of historical deviations from the stationary steady state for the ratio of residential investment to GDP. Among the different shocks, the reduction of interest rates (international capital flows in the Graph 31) played an important role in the early stages of the housing boom. The role of the housing bubble (captured by the variable "housing risk premium shock") was rising until 2007, when prices started to decelerate. Lending conditions (captured by the variable "collateral shock") fuelled the housing boom mainly from 2005 onwards, and made a negative contribution following the onset of the financial crisis.

Click to enlarge
A number of institutional factors intensified the increases of housing demand and supply. On the demand side, Spain displays a high incidence of home ownership (85% compared with 64% for the whole EU). Empirical evidence |20| shows that changes in home ownership produce higher volatility in house prices. The high incidence of home ownership has been encouraged by the existence of tax deductions for house purchase. Even though in 1998 tax deductions for mortgage payments were reduced from 30% of total payments to 15% (and deductions for secondary dwellings were abolished), these deductions remained in force, independent of the household's income, until 2010. In 2011 this kind of tax deduction was limited to households with incomes below EUR 24,000. But the original tax deductions were re-introduced - also retroactively - in November 2011. On the supply side, the creation of the so-called "development agent" in 1994, together with the Law of Land of 1998, made a large quantity of new land available for building purposes.
The extremely high incidence of home ownership has, as a counterpart, the underdevelopment of the rental market. Only 15% of all houses are rented, compared to 36% for the EU as a whole. As a result, rental prices are high and there is a lack of transparency in this market. The underdevelopment of the rental market is linked to tax incentives for home ownership, tight regulations which favour tenants (i.e. tenants have more flexibility to either lock a rent for up to 5 years, or re-negotiate it, depending on the developments on the housing market), and insufficient protection of landlords' rights by the judicial system. The small share of the rental market discourages regional labour mobility.
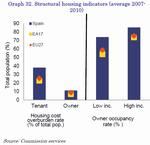
Click to enlarge
According to the MIP scoreboard, Spanish house prices fell by 3.8% in 2010 compared to a threshold of 6% growth. Data for 2011 record a sharper fall of 5.6% |21|. However, the recent evolution of house prices is the result of the burst of a previous housing bubble. Indeed, in the period 1995-2007, nominal house prices experienced cumulative growth of 200%. Additionally, the construction of new dwellings augmented significantly and more than 6.5 million of dwellings were completed between 1996 and 2009.
The strength of building activity triggered a significant deviation of economic resources to the construction sector. Thus, employment in construction reached 14% of total employment (2007), compared to 9% in the years prior to the boom period; and residential investment reached 12% of total GDP in 2007, against 6.5% in 1995. However, it was not just economic resources that were channelled to the construction sector; financial resources were deflected as well to finance building activities and house purchases. Thus, in 2006, 61.5% of total credits were devoted to these activities, while this share was under 40% ahead of the boom period.
With the onset of the current economic crisis, some of these imbalances started to adjust. As mentioned above, house prices have been falling. According to INE, house prices are almost 22% below peak levels (2007 Q3) in nominal and 29% in real terms (Graph 34). The economic resources devoted to building activities have been reduced significantly. In 2011, the weight of residential investment in GDP was 6.9%, close to the level pre-boom (Graph 33). Employment in construction accounted for 7% of total employment in the fourth quarter of 2011, below the level recorded before the boom period and the lowest level since 1976. Loans to construction and real estate activities and for house purchase have been falling; the fall was around 3% in 2011 |22|.
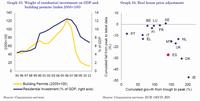
Click to enlarge
While the adjustment in construction activity has been fast, a large stock of unsold dwellings remains to be absorbed. Indeed, the current crisis has produced a sharp contraction of housing demand. Given the tightening of credit conditions and the sharp rise in unemployment, effective demand for housing was reduced. As a consequence, the number of sales went down from more than 400,000 of new dwellings in 2007 to around 125,000 in 2011. In parallel to this contraction in demand for housing, the completion of housing projects, started before the crisis, continued to add new dwellings to the house supply. Specifically, more than 1.3 million new dwellings became available during the period 2008-2010. As a result of this disequilibrium between falling demand and increasing supply, the stock of unsold houses has increased significantly to between 700,000 and 1 million dwellings.
The remaining large stock of unsold new homes implies further downward pressure on house prices. The extent to which house prices have been or are currently overvalued in Spain is contested. According to some estimates house prices are broadly in line with fundamentals |23|. However, looking forward, some of these fundamental factors (employment levels, interest rates, potential growth) are set to deteriorate. House prices are therefore expected to fall further in the coming quarters and may even undershoot their long-term equilibrium levels.
The path leading to the reduction of the stock of unsold new dwellings is not straightforward. Part of the stock is composed of secondary dwellings, some of which are inconveniently located. The reduction of the remaining part of the unsold stock should be more manageable. Due to the sharp adjustment in construction, production capacity has decreased to less than 100 thousand dwellings. On the demand side, housing needs are estimated to exceed 200 thousand dwellings per year (considering the evolution of population and the recent trends in home composition |24|). To the extent that these housing needs are converted into an effective housing demand, the stock of unsold dwellings could be absorbed in a period of five to six years.
3.5.2. Financial sector and housing market
To the extent the housing needs are not converted into effective housing demand, for example due to credit restrictions, pressures on the financial sector could increase. Given that the construction of these dwellings was financed through bank lending, the deterioration in the financial situation of housing developers due to the difficulties of selling these dwellings, may lead to rising bankruptcies and loan default ratios. In any case, the reduction in the huge stock of unsold new dwellings will not necessarily reduce the exposure of MFIs to the housing market. Indeed, the main channel of reducing this stock is through purchases by households, which will require giving new mortgages to households. Under this scenario, the MFI exposure to the housing market would not change. However, credit risk would fall since, at present, mortgages to households imply much lower risks for credit institutions (if the mortgages are granted under prudential conditions) than the loans to construction and real estate firms (the repayment of their loans is conditional on their ability to sell these assets).
Despite the on-going restructuring of the Spanish financial system, including higher capital requirements, significant write-downs, and consolidation, Spanish banks still have large exposure to the real estate and construction sector. The exposure of financial system to the construction and real estate sector was EUR 307 billion in December 2011 and around 60% of this exposure was classified as problematic.
In February and May 2012, the Spanish Government adopted a set of measures, targeting the stock of legacy assets as of end-2011, which significantly increases the industry's coverage of potential losses on these assets (see the Box 5 on the summary of the latest financial sector reforms and Section 2.2 of SWD 2012 for more detailed discussion). As a result, loan loss coverage levels in Spain will be amongst the highest in Europe. This reform addresses the challenge related to the valuation of most problematic assets such as land and unfinished property by significantly increasing their coverage. Stricter provisioning rules and the requirement of additional capital buffers for the real estate exposure should accelerate the adjustment process in the real estate and construction sector by bringing prices further down and by providing incentives for the sale of real estate assets currently held on the balance sheets of banks. However, more pronounced decline is house prices could lead to a further deterioration in the balance sheets of credit institutions due to the large volume of housing loans in their loan portfolios. Moreover, the share of problematic mortgage loans in the banks' portfolios may increase further given the persistently high level of unemployment (although the default ratio on mortgages has so far remained relatively low, below 3%).
Box 5: Financial sector 2012 reforms - summary and assessment In February and May 2012, the Spanish Government adopted a set of measures to boost banks' financial robustness and dispel any doubts concerning banks' exposures to the real estate and construction sector by strongly increasing the industry's coverage of potential losses on these assets. These are one-off measures targeting the stock of the legacy assets as of 31.12.2011.
The exposure of financial system to the construction and real estate sector was EUR 307 billion in December 2011 (10% of the total consolidated assets of MFIs or 22% of their lending portfolio). Spanish banks' overall amount of problematic exposures to this sector was approximately EUR 184 bn (60% of the total exposure to this sector) evenly split between land and unfinished property (EUR 91 bn) and finished property, including foreclosed assets (EUR 93 bn).
As a result of these reform measures, the total coverage of potential losses on both problematic and performing real estate assets linked to developers will increase significantly.
Salient features of the reforms
The new measures require banks to have higher provisions and capital buffers against possible losses on both performing and non-performing loans to the real estate and construction sectors (the total cost for the financial sector is estimated at EUR 80bn):
1) for non-performing loans and foreclosed assets (specific provisions and capital buffers):
- for land related assets: from 31% to 80%,
- for unfinished property assets: from 27% to 65%,
- for finished property assets: from 25% to 35%,2) for performing loans (general provisions):
- for land related assets: from 7% to 52%,
- for unfinished property assets: from 7% to 29%,
- for finished property assets: from 7% to 14%,
- for other assets: from 7% to 52%.They oblige all banks to transfer their foreclosed assets and assets delivered in payment of debt to asset management companies in the form of Special Purpose Vehicles (SPVs). As a first step, all banks will have to transfer their foreclosed assets and assets delivered in payment of debt to SPV (i.e. asset management companies) by the end of 2012. In principle, these vehicles will be co-owned by the banks and other private investors. The transfer of assets has to be made at fair value. In the absence of such a price or if it is difficult to obtain it, the transfer will be made at book value net of provisions. If at the moment of transfer to the SPVs, the assets are not backed by the new provisioning requirements, the acquiring SPVs will have to set aside these provisions within the foreseen deadlines. The transfer of assets to the newly establishes SPVs has to be done before the deadline for the compliance with the new provisioning requirements introduced through the February and May 2102 reforms. In the case of banks controlled by Fund for Orderly Bank Restructuring (FROB) or banks for which FROB was designated as temporary administrator, the decision on whether these banks should set up such SPVs will be taken by the FROB. The new vehicles set up by credit institutions which receive public support will have to sell annually at least 5% of the assets to a third party.
The new measures foresee the possibility of additional public support for institutions which cannot meet these additional requirements by the established deadlines. FROB can inject capital by the subscription of ordinary shares in standalone banks or contingent capital instruments (cocos) in the case of integration processes (i.e. mergers) of credit institutions which need to strengthen their own funds. In addition, FROB support can also be made in the form of Asset Protection Schemes (APS) designed by the FROB, which will insure the banks against first losses on selected assets. Credit institutions involved in integration processes will have to present an integration plan which includes specific measures aiming at increasing their efficiency, rationalising their administration and management, downsizing their capacity in order to improve their future prospects.
Spanish credit institutions must present their plans to comply with the new requirements by mid-June 2012 in order to fully meet the new standards by end 2012 (the compliance plans related to the February reform were submitted already by end-March). Nevertheless, credit institutions involved in a merger process will have an extra 12 month period (starting on the date of approval of the merger) to fulfil the new requirements.
The government appointed two independent firms to carry out a complete valuation analysis of all banking assets, not only real estate exposures. The government announced on 21 May that Roland Berger and Oliver Wyman were the two firms selected to perform this valuation.
Assessment
These reforms are an important step forward to tackle uncertainties related to stock of real estate assets, by increasing the loss absorption capacity of banks (i.e. total volume of provisions, capital buffers). Stricter provisioning rules and the requirement of additional capital buffers for the real estate exposure should accelerate the adjustment process in the real estate and construction sector by bringing prices further down and by providing incentives for the sale of real estate assets currently held on the balance sheets of banks. This reform should also ultimately lead to a more stable and resilient financial system through further consolidation of the banking sector.
The impact of the new measures on lending to the real economy in the short-term in uncertain while positive impact is expected in the medium- to long-term. A key consideration is that new lending, including to the real estate and construction sector, is not expected to be penalized by the significantly stricter provisioning rules as the measures apply only to the stock of loans. As a result, it can be expected that stronger banks would be better placed to extend credit also to improve their profitability outlook given the higher margins currently present in the market.
The new regulation provides strong incentives for further consolidation in the banking sector. Most importantly, the deadline for compliance with the new provisions and capital requirements is extended by one year in case of mergers. This is crucial given that the new rules entail a significant increase in provisions within a relatively short period of time. In addition, part of the increased provisions may be recorded against own funds. However, the success of the Government's strategy, i.e. private sector solution, will largely depend on the willingness of stronger Spanish entities to participate in the foreseen consolidation. In addition, the strategy of consolidating solid banks with banks in financial distress (for instance, banks which have been taken over by the FROB), which still have not been subject to a thorough restructuring process, may also have considerable shortcomings. Furthermore, the potential involvement of the FROB under the new rules will imply state aid to the beneficiary banks.
Despite the overall positive assessment of the reform, there is a risk that the adopted measures will not be sufficient to restore investor confidence. Analysts have estimated losses ranging from EUR 20 billion to EUR 80billion (for all exposures including non-performing loans) depending on the severity of the assumptions.
The new measures target only real estate and construction sector exposures and do not address other significant portfolios of the banks, e.g. loans to SMEs or mortgage portfolios. If the economic outlook and macroeconomic environment (including housing prices) continues to deteriorate, these portfolios are also very likely to incur increasing losses.
In addition, there is no differentiation between weaker and stronger banks, especially with regards to the transfer of the foreclosed assets. By applying these new measures across the board, they may be inadequate for the relatively weak banks while they may require unnecessary additional effort from relatively solid banks in an environment of scarce private and public resources.
Greater clarity is required on the use of SPVs to segregate foreclosed real-estate assets. The removal of such assets from the balance sheets of banks is an important step to clean-up their portfolios. However, as long as these SPVs (asset management companies) remain in the area of consolidation of banks/banking groups, there is no clear separation between these non-performing assets and the remaining banking business.
While the largest banks are likely to meet these new provisioning requirements from their own resources, additional public resources will most probably be needed for weaker institutions. However, the implication for public finances in terms of debt dynamics, cost of financing and access to the market remains to be assessed on the basis of the possible financing needs identified, likely only after the independent valuation of the entire loan portfolio of banks exercise takes place.
3.5.3. House prices developments
The impact of the development of house prices is not restricted to the financial sector. Effects on the rest of the economy may be important, especially if there is an additional, significant fall in house prices. Indeed, private consumption may be negatively affected through a wealth effect in the form of real estate valuations. In the case of Spanish consumers this effect may be potentially important, given that the weight of real estate wealth on total households' net wealth is very high (around 84%). However, empirical evidence |25| shows that the impact of a decline in house prices on consumption in Spain is in line with the evidence in other countries with lower proportion of housing wealth on total wealth. In any case, international evidence suggests that the impact of significant falls of house prices may be more important than an equivalent decline in stock prices. An additional transmission channel of house prices to the real economy is through investment, and more specifically residential investment. The reduction of profitability of residential construction due to decline in house prices may lead to a reduction of house building activity, negatively contributing to the GDP growth. On the other hand, this more reduced building activity implies a re-allocation of resources from the non-tradable sector (construction) to the tradable one. The transmission of the fall in house prices through these channels is enhanced due to a financial accelerator effect to the extent the value of households' collateral is reduced.
In the current situation of the Spanish economy, the macroeconomic effects of additional falls in house prices are more based on the private consumption channel rather than on the investment one. Indeed, as discussed above, the adjustment of residential building capacity is mostly finished at this point of time and, therefore, its negative consequences have been already internalized. Notwithstanding, the future evolution of real estate prices remains an important issue due to its potential effects on private consumption, on the financial stability and on the reduction of the stock of unsold dwellings.
Gauging the future evolution of house prices is not straightforward. International and historical evidence provides only limited guidance on the origin of housing booms and busts and the institutional environment is different among countries and across the time. International evidence shows that house price adjustment takes 5 or 6 years on average. Spain would be in its fourth year of adjustment. Focusing on the Spanish historical evidence, the current house price cycle shows some similarities with the previous cycle but only in its boom phase. However, the bust phase has different characteristics, including a faster adjustment than in the previous cycles, probably due to the financial crisis that is accompanying, and possibly accelerating, the current bust period (see Box 6 for further details). Econometric evidence |26| shows that at present real estate prices are mainly driven by their fundamentals. However, this fact does not mean that there will be no additional adjustments of house prices going forward. To the contrary, the economic recession is pushing some fundamentals related to the house prices, such as real disposable income or credits to house purchasing, to the negative territory. As a result, additional falls of real estate prices should be expected, at least in 2012-2013. However, the exact size of additional fall is uncertain. If the current house price cycle replicates past experiences, real house prices would fall by an additional 10 percentage points. In addition, other reference values, such as the ratio of house value over household's average income or the ratio of profitability of house rent over long-term interest rates, points to an additional adjustment of around 30 pps. In order for the prices to adjust to their pre-boom level (i.e. in 2001) a similar adjustment would be required. Finally, according to the econometric model outlined in Box 6 and considering the expected behaviour of real gross disposable of households as in the Commission Services' 2012 Spring Forecast, an additional fall of around 25% until 2013 could be predicted. Independently of the specific figure, these estimates show that there is a high probability of additional, significant house price adjustment and, therefore, there are potentially high spillover risks for the real economy and for the financial sector.
The boom of housing activities implied a significant deviation of economic and financial resources to the construction sector. The adjustment of the sector, which started in 2007, was accelerated by the current international economic and financial crisis to the extent that the flow of credit was deeply reduced. Thus, households did not have access to new loans and, therefore, were unable to buy new dwellings. The same was true for construction companies that lacked financing to develop new projects. As a result, production capacity adjusted very fast, reaching pre-boom levels in 2011. The allocation of freed resources from the construction sector, mainly labour force, is one of the most pressing challenges facing the Spanish economy.
Despite this fast downsizing of the construction sector, two related significant challenges remain: the huge stock of unsold new dwellings and the large amount of outstanding loans related to real estate and construction. The reduction of the number of unsold dwellings requires additional adjustments of house prices. However, further falls of house prices imply risks for the financial system as additional depreciation in value of the real estate assets would lead to higher losses in case of default. Forecasting the future development of house prices is not straightforward. However, according to different estimates and indicators a further significant correction is likely. As a consequence, the evolution of house prices and their impact on the stability of financial sector deserves special attention.
Box 6: Speed and magnitude of house price adjustment in Spain Duration and magnitude of the house price cycle into perspective
The most recent house price cycle in the euro area has been particularly pronounced with an average length of 9 years of price increases in the period preceding the global economic and financial recession. Most euro-area countries, but Germany, Austria and Portugal witnessed cumulated growth in real prices of over 40% during the expansion phase. The length and the speed of this expansion has, however, varied significantly across countries reflecting large differences in the structure of housing and mortgage markets as well in macroeconomic conditions.
Since the second half of 2007, euro-area housing markets have clearly entered into a phase of retrenchment with an adjustment taking place in most Member States and cumulated falls in housing prices in double-digit territory in some of them (IE, ES, CY, SK, EE). Again, large Member State differences in the speed and strength of the downturn are noticeable.
Focussing on the Spanish cycle from a cross-sectional dimension, an unusually long and intense booming phase can be observed. Real house prices grew at an average pace of 8% during the 11 years preceding the 2007 peak, amounting to a cumulated growth of 155%. Since then, a sharp correction of more than 20% has taken place.
It is also worthwhile putting the latest Spanish house price cycle into a time perspective (Graph 1). The upswing phase of the current cycle is more in line with the previous cyclical upswing (i.e. the cycle peaking in 1991 Q4): The amplitudes of the booming phases are comparable but the recent upswing lasted two more years. In both cases annual growth rates started to decelerate 4 years previous to the peak (Graph 2). The correction phase is more asymmetric between these two experiences nevertheless. The current adjustment looks more similar in its severity to the experience following the oil price shock as can be seen in Graphs 1 and 2.
All in all, the hard landing taking place since the end of 2007 points to the existence of excessive imbalances in the housing market in the years preceding the crisis. The magnitude of the necessary adjustment and the pace at which it will take place are matters of first importance at the current juncture.
House price determinants and prospects
Estimates of medium-long term equilibrium housing prices are usually surrounded by a high degree of uncertainty, mainly due to important endogeneity problems linked to the identification of supply and demand contributions to the equilibrium prices. However, when interpreted with caution, estimations of equilibrium housing prices could give an indication of the magnitude of over/under-shooting and provide simulated scenarios of the impact of the foreseeing evolution of its determinants.

Click to enlarge
Bearing this in mind, we estimated the short and long-term relationship of Spanish real house price and its main demand and supply determinants: household credit developments, the stock of housing, urban population and real disposable income per capita. The model was estimated on a quarterly frequency, for the sample 1989 Q1-2011 Q1. This equation yields an equilibrium value estimate for real house prices (Graph 3), against which we can compare actual prices in order to gauge emerging real estate bubbles. Real house prices were overshooting their fundamentals all along since 2003 until the onset of the crisis. This gap was closed rapidly once the bubble burst as expectations adjusted immediately. The initial worsening in expectations that drove prices down was soon reinforced by deteriorating fundamentals.
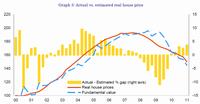
Click to enlarge
Since 2008, most of the determinants are on a sharp adjustment path, and even though actual prices are in line with the equilibrium value, prices are still falling, confirming that the so-called "fundamental value" of house prices was not sustainable in the long-run and that the current adjustment might not be over yet. Indeed, looking ahead, no quick recovery is expected for any of the determinants.
On the demand side, the short-term population forecasts from the Spanish Statistical Institute (INE) anticipate a drop of 0.2% in total population over the next 10 years. Moreover, the European Commission in its 2011 autumn forecasts foresees slack internal demand in an economic environment with binding credit constraints and high uncertainty. On the supply side, two opposing forces are at play. On the one hand, following the stagnation of the construction sector, there has been a moderation in the housing stock as can be seen from plunging housing starts and completion statistics. On the other hand, the existing stock of unsold houses entering the market as banks clean their balance sheet will probably prove to be an additional force driving prices down.
The simulation of the effects on house prices of different policy scenarios might be assessed by looking at the impulse-response functions (IRF) of the estimated model. Table 1 presents the cumulated percentage changes in real house prices following increases in its main determinants. The importance of demographics and the level effect of the stock of housing are noticeable. Moreover, the income effect from movements in real disposable income appears relevant as well. According to these results and considering the expected behaviour of real gross disposable of households as in the Commission Services' 2012 Spring Forecast, an additional fall of around 25% until 2013 could be predicted.
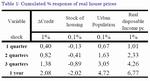
Click to enlarge
The preceding analysis has shown that Spain is experiencing very serious macroeconomic imbalances, which are not excessive but need to be urgently addressed. In particular, macroeconomic developments, notably related to the significant level of private sector debt, the large negative external position and the financial sector, which were influenced by housing market developments, require close monitoring and urgent economic policy attention in order to avert any adverse effects on the functioning of the economy and of economic and monetary union.
The complexity and severity of challenges facing Spain has been recognized by the government, which has adopted a number of important policy initiatives, most notably in the areas of the labour market and the financial sector.
On 10 February, the government adopted a labour market reform, which includes changes to employment protection legislation, the collective bargaining system and active labour market policies (see also Box 2). Compared to previous reforms, this reform appears to be more ambitious in tackling labour market duality and in increasing flexibility at firm level. However, the reform does not tackle the system of ex-post inflation indexation of wages, which has only been suspended for the period 2012-2014 in a recent agreement among the social partners.
On 3 February and 11 May 2012, the government announced further banking sector reforms (see also Box 5). The main objective is to dispel any uncertainties arising from the exposures of Spanish banks to the real estate sector and to promote further consolidation of the banking system. New measures increase specific and generic loan-loss provisions and require banks to set aside capital buffers. However, the banking sector's potential financing needs, and the ability of weaker banks to meet the new provisioning and capital buffers, remain sources of market concern. It remains to be established whether and to what extent official financial assistance would be needed.
The National Reform Programme (NRP) submitted on 30 April 2012 announced additional measures aimed at addressing some of the existing imbalances. The NRP includes measures to foster human capital, to improve the functioning of product markets and business environment, to promote R&D and innovation and to develop the rental market (for more detailed discussion see the Commission staff working document: Assessment of the 2012 national reform programme and stability programme for Spain).
Despite comprehensive and ambitious set of measures taken by the Spanish government, several remaining policy challenges are identified in this report.
- Enlarging the export base is one of the important challenges, which could be addressed by eliminating possible barriers that could hamper firms' growth. In addition, SMEs may need assistance to enter and remain in the external markets. In that respect facilitating an increased collaboration among SMEs could be considered. With regard to tourism, focusing attention on key sending countries with strong potential growth would be an option. Finally, ensuring financing to the export sector remains an important challenge, especially given the current, tight credit conditions.
- Regarding the rebalancing of the economy towards the tradable sector, in addition to enhancing the export capacity, there is room to further improve the business environment. Elimination of anticompetitive regulations and non-justified entry barriers, mainly in professional services, would go in this direction. Furthermore, enhancing the independence of regulatory agencies and reducing the administrative burden, including coordination of different levels of public administration, would be warranted. The transition to a new economic growth model can be facilitated by tax incentives for investment on R&D and innovation. Finally, reducing the degree of external oil dependence is an important challenge.
- Greater emphasis on training and education could ensure a smoother functioning of the labour market in the current context. Thus, measures to reduce labour market duality, to promote active labour market policies, to increase the human capital of workers and to reduce the presence of the automatic wage indexation could help to reduce the high level of unemployment and promote the transition to a new model of economic growth. To this end, more efforts on training and education as well as better matching of the qualifications demanded by the markets are required.
- On the housing market, removing distortions which promoted past disequilibria is important. Measures aimed at promoting the rental market would go in this direction. A larger, more efficient rental market would provide more geographical flexibility to the labour force and, therefore, would improve the adjustment capacity of the Spanish economy. Possible measures could include re-balancing of tax incentives from home ownership to house rental and strengthening of the institutional framework of the rental market.
- Regarding the financial sector, some important policy challenges remain despite the policy measures adopted in February and May 2012. In order to limit the potential adverse spill-overs from the financial sector it would be important to address in a timely manner the remaining weak institutions. In addition, ensuring that the legacy stock of problematic assets on the banks' balance sheets is effectively dealt with is a key pre-requisite for the revival in credit activity. Finally, given the risk of bank funding stress, further strengthening of the capital buffers of banks, especially of weaker institutions, may be required.
- Regarding fiscal policy, deficit and debt adjustment paths are subject to downside risks even though the envisaged pace of the adjustment in structural terms in 2012-2013 represents significant progress towards the medium-term objective. Macroeconomic developments could turn out less favourable than expected. Moreover, measures are not sufficiently specified from 2013 onwards. Finally, budgetary compliance by regional governments also poses risks to the budgetary strategy. Strict enforcement of the Budget Stability Law and the adoption of strong fiscal measures at regional level would mitigate the risks of a slippage at regional level. Given the decentralised nature of Spain's public finances, a strong fiscal and institutional framework is essential.
[Source: European Commission, Directorate-General for Economic and Financial Affairs, Brussels, Jul12]
REFERENCES:
- Altomonte, C., G. Barba Navaretti, F. di Mauro and G. Ottaviano, 'Assessing competitiveness: how firm-level data can help', Bruegel Policy Contribution, No 16, 2011.
- Antras, P. and A. Costinot, 'Intermediated trade', The Quarterly Journal of Economics, Oxford University Press, Vol. 126(3), 2011, pp. 1319-1374.
- Aspachs-Bracons, O., S. Jodar-Rosell and J. Gual, 'Perspectivas de desapalancamiento en Espafia", La Caixa, Documentos Economicos, Vol. 23, 2011.
- Bank of Spain, Annual Report, 2005.
- Bank of Spain, Boletin Economico, December 2010.
- BBVA, Spain Economic Watch, 19 January 2011.
- Cabrero, A. and M. Tiana, 'El contenido importador de las ramas de actividad en Espafia', Bank of Spain, Boletin Economico, February 2012, pp. 45-57.
- Crespo, A., G. Perez-Quiros and R. Segura, 'Competitiveness indicators: the importance of and efficient allocation', Bank of Spain, Boletin Economico, January 2012, pp. 103-111.
- Cuerpo, C. and A. Mordonu, 'Functioning of the real estate market in Spain: assessment under the EIP', mimeo, 2011.
- Dell'Ariccia, G., D. Igan, and L. Laeven, 'Credit booms and lending standards: evidence from the subprime mortgage', IMF Working Papers, No 106, 2008.
- ECB, Monthly Bulletin, 'Housing wealth and private consumption in the euro area', January 2009, pp. 59-71.
- European Commission, 'Scoreboard for the surveillance of macroeconomic imbalances', European Economy, Occasional Paper, No 92, 2012.
- European Commission, Product Market Review 2010-2011, 'The microeconomic roots of growth performance and trade competitiveness in the EU', European Economy, Economic Papers, No 8, Directorate General Economic and Monetary Affairs, Brussels, 2011.
- Fedea and McKinsey & Company, 'A growth agenda for Spain', 2010.
- Goldman Sachs Global Economics, Commodities, and Strategy Research, European Weekly Analyst, 17 November 2011.
- IMF, Consultative Group on Exchange Rate Issues (CGER) Assessment, Fall 2010.
- IMF, Consultative Group on Exchange Rate Issues (CGER) Assessment, Spring 2011.
- Izquierdo, M., E. Moral and A. Urtasun, 'El sistema de negotiation colectiva en Espafia: un analisis con datos individuales de convenios', Bank of Spain, Documento Ocasional, No 0302, 2003.
- Martinez-Mongay, C. , L. A. Maza and J. Yaniz (2007): "Asset Booms and Tax Receipts: The case of Spain, 1995-2006". European Economy. Economic Papers. 293. November 2007
- Merler, S. and J. Pisani-Ferry, 'Sudden stops in the euro area', Bruegel Policy Contribution, No 6, 2012.
- Poirson, H. and S. Weber, 'Growth spillover dynamics from crisis to recovery', IMF Working Papers, No 218, 2011.
- Ruscher, E. and G. Wolf, 'Corporate balance-sheet adjustment: stylized facts, causes and consequences', European Economy, Economic Papers, No 449, 2012.
- Salto, M. and A. Turini, 'Comparing alternative methodologies for real exchange rate assessment', European Economy, Economic Papers, No 427, Directorate General Economic and Monetary Affairs, European Commission, Brussels, 2010.
- Veld, J., A. Pagano, R. Raciborski, M. Ratto, and W. Roeger, 'Imbalances and rebalancing scenarios in an estimated structural model for Spain', European Commission, Mimeo, Brussels, 2012.
- ZEW, 'Housing markets and intra-euro area macroeconomic imbalances: identifying policy instruments', 2011.
Notes:
1. Taking as reference the one-year interbank interest rate was 10% in 1995 and 4% three years later in 1998. [Back]
2. According to G. Dell'Ariccia et al. (2008), lower standards were associated with a fast rate of house price appreciation, consistent with the notion that lenders were to some extent gambling on a continuing housing boom, relying on the fact that borrowers in default could always liquidate the collateral and repay the loan. [Back]
3. According to H. Poirson and S. Weber (2011) a 1% shock to Spain's growth increases GDP growth in Germany by 0.7%, in France by 0.5%, and in Italy by 0.3%. [Back]
4. Household indebtedness, measured as a share of gross disposable income, has fallen by around 4.5% since its peak in 2007 Q3. [Back]
5. Bank of Spain (2010). [Back]
6. Bank of Spain (2005), see Box 5.3. [Back]
7. Variable interest rates are established based on Euribor (the variable part) plus a margin, which tends to be smaller for mortgages given during the boom years (hence, households have less incentive to negotiate their mortgages in the current, much tighter conditions). [Back]
8. Among these other sectors (i.e. no real estate and construction- related) there are some with debt levels that are equivalent or even lower than their peers in other euro-area countries, and which, in turn, puts them in a good position to finance their own projects, an important factor, especially in the current more demanding international context (see BBVA Spain Economic Watch (2011) for more details). [Back]
9. The total import content of the construction production is 8.1%. [Back]
10. Baseline scenario assumes an average real GDP growth rate of 1.8%, average GDP deflator of 1.8% and average long-term nominal yield of 4.1%. Stress scenarios include various combinations of lower real GDP growth (1.3-1.5%), higher GDP deflator (2%), and higher interest rates (4.3-5.0%). [Back]
11. These estimates are based on the model developed by Salto M. and A. Turini (2010). [Back]
12. Measuring price competitiveness of an economy is not straightforward. It depends on the definition of the real effective exchange rate used (REER) (in particular, the type of deflator used) and on the selection of the benchmark countries. Three commonly used deflators include economy-wide price deflator (i.e. HICP), nominal unit labour cost deflator (ULC) and ULC deflator in the manufacturing sector (Manufacturing), which can be used as a proxy for development of the relative prices in the tradable sector. [Back]
13. REER based on export-price deflator, not shown in Graph 20, yields similar results. [Back]
14. Based on 2005 symmetric Input-Output Table. [Back]
15. See Product Market Review 2010-2011 (2011). [Back]
16. This finding for Spain is in line with international evidence, which shows that intermediate bargaining levels achieve less efficient outcomes in terms of adjusting wage behaviour to labour market conditions. Both centralised (at a national industry level) and decentralised (at a firm level) bargaining systems would derive more efficient outcomes either more aligned with macroeconomic environment or with the firm-specific conditions. [Back]
17. "Ultra-actividad" clause meant that a collective bargaining agreement remained in force even after its expiry in absence of a new agreement. In practical terms, it implied that the new agreements were reached only if they provided workers with improved conditions (i.e. higher wages, etc.). [Back]
18. Export unit values (relative to imports) are commonly used as a proxy for product uniqueness or quality. Relative export unit values are computed by comparing price of exports with price of imports, at product level. This is calculated as the value/volume ratio for exports divided by the same ratio for imports at disaggregated product level over the period 1999-2009. The indicator is only an approximation (among other things because export unit values could also be driven by cost pressures), but empirical analysis have shown a significant and positive association between growth of the indicator and exports growth suggesting that relative unit values capture predominantly product-differentiation-based non-price competitiveness rather than price competitiveness. See chapter 2 of Product Market Review 2010-2011. [Back]
19. A decomposition of exports growth shows a modest, but positive product composition effect (a 0.2 pps.) indicating a relative specialization in sectors facing growing world demand. However, Spain demonstrates a weak specialization in several important sectors characterized by a dynamic global demand (such as chemicals, office, and telecommunications machinery). [Back]
21. According to the Ministry of Promotion (Ministerio de Fomento). According to the Spanish Statistical Institute (INE), the house prices fell by 7.4% in 2011. [Back]
22. Notwithstanding this change, the magnitude of such loans remains very high. This issue is addressed in Section 3.2 on private debt. [Back]
23. ZEW (2011, op. cit.) and Carlos Cuerpo & Aurora Mordonu (2011). [Back]
24. Other estimates place the housing needs at around 350,000 (BBVA Real Estate Watch (2009)). [Back]
 | This document has been published on 17Apr13 by the Equipo Nizkor and Derechos Human Rights. In accordance with Title 17 U.S.C. Section 107, this material is distributed without profit to those who have expressed a prior interest in receiving the included information for research and educational purposes. |