Dec11
An Overview of Growing Income Inequalities in OECD Countries: Main Findings
This overview summarises the key findings of the analytical chapters of this report. It sketches a brief portrait of increasing income inequality in OECD countries and the potential driving forces behind it. It reviews changes in these driving forces and examines their relative impact on inequality. In particular, it looks at the role of globalisation and technological changes, regulatory reforms in labour and product markets, changing household structures, and changes in tax and benefit regulations. It assesses what governments can do about increasing inequality and concludes by examining possible specific policy avenues.
1. The big picture: inequality on the rise in most OECD countries
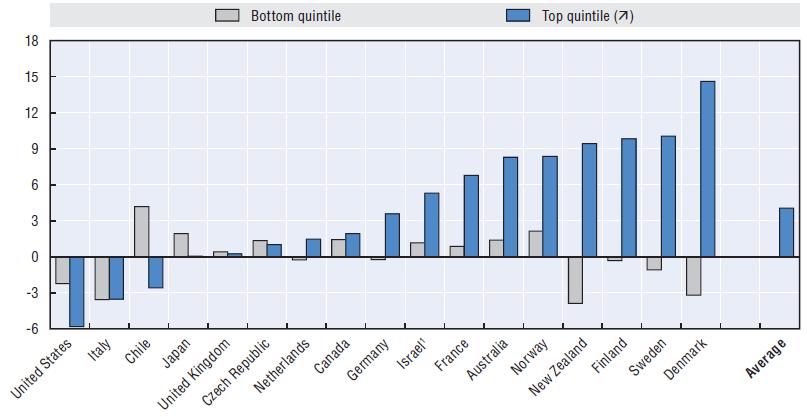
Over the two decades prior to the onset of the global economic crisis, real disposable household incomes increased by an average 1.7% a year in OECD countries. In a large majority of them, however, the household incomes of the richest 10% grew faster than those of the poorest 10%, so widening income inequality. Differences in the pace of income growth across household groups were particularly pronounced in some of the English-speaking countries, some Nordic countries, and Israel. [1] In Israel and Japan, the real incomes of those at the bottom of the income ladder actually fell compared with the mid-1980s (Table 1).
In OECD countries today, the average income of the richest 10% of the population is about nine times that of the poorest 10% - a ratio of 9 to 1. However, the ratio varies widely from one country to another. It is much lower than the OECD average in the Nordic and many continental European countries, but reaches 10 to 1 in Italy, Japan, Korea, and the United Kingdom; around 14 to 1 in Israel, Turkey, and the United States; and 27 to 1 in Mexico and Chile.
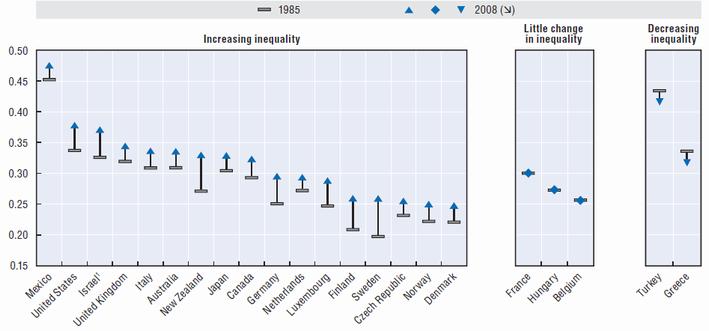
The Gini coefficient, a standard measure of income inequality that ranges from 0 (when everybody has identical incomes) to 1 (when all income goes to only one person), stood at an average of 0.29 in OECD countries in the mid-1980s. By the late 2000s, however, it had increased by almost 10% to 0.316. Significantly, it rose in 17 of the 22 OECD countries for which long-term data series are available (Figure 1), climbing by more than 4 percentage points in Finland, Germany, Israel, Luxembourg, New Zealand, Sweden, and the United States. Only Turkey, Greece, France, Hungary, and Belgium recorded no increase or small declines in their Gini coefficients.
Income inequality followed different patterns across the OECD countries over time (Figure 2). It first started to increase in the late 1970s and early 1980s in some English-speaking countries, notably the United Kingdom and the United States, but also in Israel. From the late 1980s, the increase in income inequality became more widespread. The latest trends in the 2000s showed a widening gap between rich and poor not only in some of the already highinequality countries like Israel and the United States, but also - for the first time - in traditionally low-inequality countries, such as Germany, Denmark, and Sweden (and other Nordic countries), where inequality grew more than anywhere else in the 2000s. At the same time, Chile, Mexico, Greece, Turkey, and Hungary reduced income inequality considerably - often from very high levels. There are thus tentative signs of a possible convergence of inequality levels towards a common and higher average level across OECD countries. [2]
Increases in household income inequality have been largely driven by changes in the distribution of wages and salaries, which account for 75% of household incomes among working-age adults. With very few exceptions (France, Japan, and Spain), the wages of the 10% best-paid workers have risen relative to those of the 10% lowest paid. This was due to both growing earnings' shares at the top and declining shares at the bottom, although top earners saw their incomes rise particularly rapidly (Atkinson, 2009). Earners in the top 10% have been leaving the middle earners behind more rapidly than the lowest earners have been drifting away from the middle.
TABLE 1
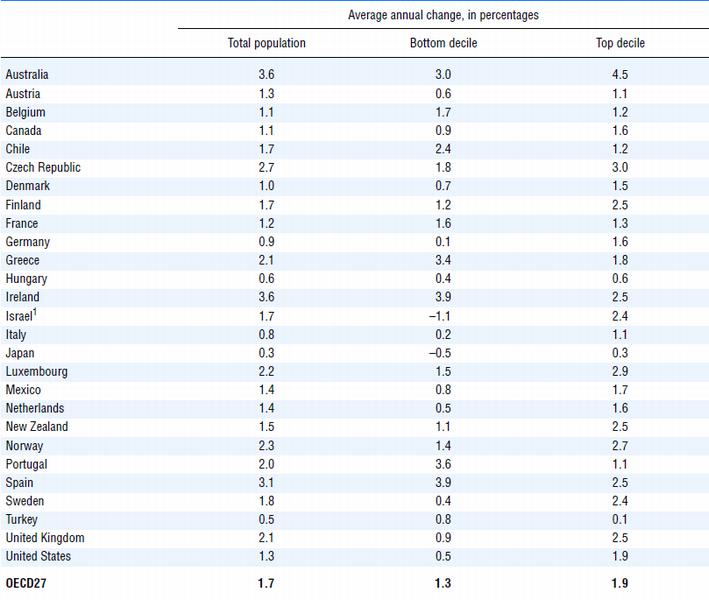
Note: Income refers to disposable household income, corrected for household size and deflated by the consumer price index (CPI). Average annual changes are calculated over the period from 1985 to 2008, with a number of exceptions: 1983 was the earliest year for Austria, Belgium, and Sweden; 1984 for France, Italy, Mexico, and the United States; 1986 for Finland, Luxembourg, and Norway; 1987 for Ireland; 1988 for Greece; 1991 for Hungary; 1992 for the Czech Republic; and 1995 for Australia and Portugal. The latest year for Chile was 2009; for Denmark, Hungary, and Turkey it was 2007; and for Japan 2006. Changes exclude the years 2000 to 2004 for Austria, Belgium, Ireland, Portugal and Spain for which surveys were not comparable.
1. Information on data for Israel: http://dx.doi.org/10.1787/888932315602.
Source: OECD Database on Household Income Distribution and Poverty.
StatLink http://dx.doi.org/10.1787/888932537370The 2008 OECD report Growing Unequal? highlighted that inequality in the distribution of market incomes - gross wages, income from self-employment, capital income, and returns from savings taken together - increased in almost all OECD countries between the mid-1980s and mid-2000s. Changes in the structure of households due to factors such as population ageing or the trend towards smaller household sizes played an important role in several countries. Finally, income taxes and cash transfers became less effective in reducing high levels of market income inequality in half of OECD countries, particularly during the late 1990s and early 2000s.
While these different direct drivers have been described and analysed in depth and are now better understood, they have typically been studied in isolation. Moreover, while growing dispersion of market income inequality - particularly changes in earnings inequality - has been identified as one of the key drivers, the question remains open as to the major underlying, indirect causes of changes in inequality. Is globalisation the main culprit? To what degree were changes in labour and product market policies and regulations responsible? Do changes in household structure matter? Finally, what can governments do to address rising inequality? These and other questions are addressed in detail in the present report which identifies key drivers and possible policy measures for tackling inequality trends among the working-age population.
Figure 1. Income inequality increased in most, but not all OECD countries
Gini coefficients of income inequality, mid-1980s and late 2000s
Note: For data years see Table 1. "Little change" in inequality refers to changes of less than 2 percentage points.
1. Information on data for Israel: http://dx.doi.org/10.1787/888932315602.
Source: OECD Database on Household Income Distribution and Poverty.
StatLink http://dx.doi.org/10.1787/888932535185Globalisation has been much debated as the main cause of widening inequality. From a political point of view, protectionist sentiments have been fuelled by the observation that the benefits of productivity gains in the past two decades accrued mainly - in some cases, exclusively - to highly skilled, highly educated workers in OECD countries, leaving people with lower skills straggling. From a conceptual point of view, the standard reading of traditional international trade theory [3] is that increased trade integration is associated with higher relative wages of skilled workers in richer countries, thus contributing to greater inequality in those countries (e.g. Kremer and Masking, 2006).
However, evidence as to the role of globalisation in growing inequality is mixed. A number of international cross-country studies find trade integration to have increased inequality in both high-wage and low-wage countries, which is at odds with traditional trade theory (for a review, see Milanovic and Squire, 2005). Other studies, by contrast, suggest that rising imports from developing countries are actually associated with declining income inequality in advanced countries (Jaumotte et al., 2008). Recently, some leading trade economists, such as Krugman (2007) or Slaughter (Scheve and Slaughter, 2007) have changed tack from their earlier views that the effect of trade on inequality was modest at best: they now consider that globalisation may have had a more significant impact on the income distribution in the United States through trade and other channels, such as foreign direct investment (FDI) and offshore activities.
Figure 2. Inequality increased in most countries over the long term, but recently fell in some high-inequality countries
Gini coefficients of income inequality in 27 OECD countries, 1975-2008

Note: National sources have been used to complement the standardised OECD data for Australia, Chile, Finland, Norway, New Zealand and Sweden. Their methodology is as close as possible to OECD definitions. Break in series between 2000 and 2004 for Austria, Belgium, Ireland, Portugal and Spain. Break in series in 1997 for Israel.
1. Information on data for Israel: http://dx.doi.org/10.1787/888932315602.
Source: OECD Income Distribution and Poverty Database.
StatLink http://dx.doi.org/10.1787/888932535204Next to globalisation, there are, however, other equally plausible explanations for the growing inequality in the distribution of market income. Technological progress in particular is often cited. For example, advances in information and communication technology (ICT) are often considered to be skill-biased and, therefore, an inequality-increasing factor. Some studies put the ICT revolution at the forefront of their explanation of inequality: the IMF (2007), for example, found that "technological progress had a greater impact than globalisation on inequality within countries", while an OECD report (OECD, 2007) suggests that "technical change is a more powerful driver of increased wage dispersion than closer trade integration". In practice, however, it is very difficult to disentangle technological change from globalisation patterns that also increase the value of skills. Advances in technology, for instance, lie behind the fragmentation of economic activities and the offshoring of production. As Freeman (2009) puts it, "offshoring and digitalisation go together".
Finally, policy choices, regulations, and institutions can have a crucial impact. They can shape how globalisation and technological changes affect the distribution of income. They can also influence income distribution directly, e.g. through deregulation in product markets, changes in social transfers, wage-setting mechanisms, or workers' bargaining power. However, connecting these factors with overall earnings inequality and household income inequality is not straightforward, as regulatory and policy reforms may have counteracting effects on employment and wage inequality among workers.
The empirical evidence as to the key drivers of inequality remains largely inconclusive and is made more so by a lack of precise definitions and concepts used in different studies. When assessing the possible causes of increased inequality, three main issues require particularly precise definition. They are: i) inequality itself, ii) globalisation, and iii) reference populations.
First, use of term "inequality" should clearly state inequality of what and among whom. Different income aggregates [4] and population subgroups will be affected differently by different driving forces. It is useful, therefore, to consider the following concepts:
� Dispersion of hourly wages among full-time (or full-time equivalent) workers.
� Wage dispersion among workers (e.g. annual wages, including wages from part-time work or work during only part of the year).
� Individual earnings inequality among all workers (including the self-employed).
� Individual earnings inequality among the entire working-age population (including those who are inactive, i.e. not working).
� Household earnings inequality (including the earnings of all household members).
� Household market income inequality (including incomes from capital, savings and private transfers).
� Household disposable income inequality (taking into account public cash transfers received and direct taxes paid).
� Household adjusted disposable income inequality (taking into account the values of publicly provided services such as health or education).
Box 1. A roadmap: the analytical framework and structure of the report
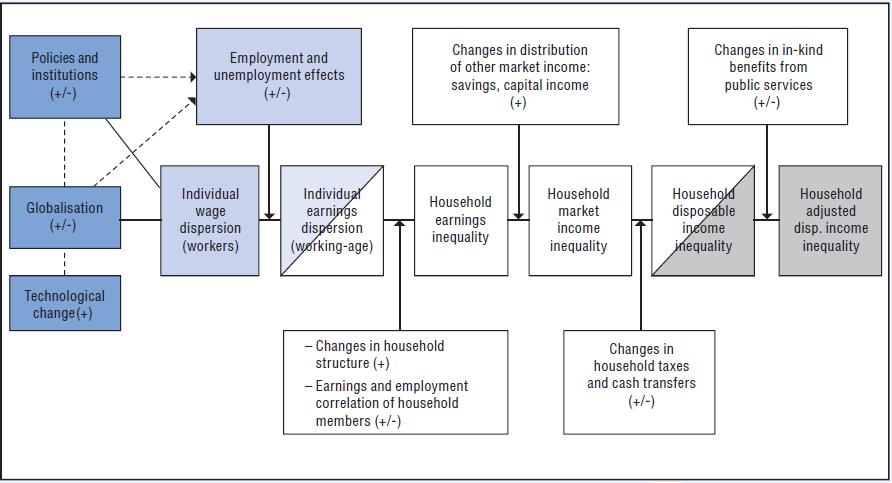
Globalisation and skills-biased technological change can affect policies via multiple pathways just as policies can, in turn, can affect both market and final disposable income inequality. It would therefore be difficult to develop one single empirical model to explain changes in final household income inequality drawn directly from macroeconomic variables. Instead, this study adopts a partial, step-wise approach that separately investigates the relevant pathways between the main driving factors and income inequality. This approach is illustrated in the figure below which describes the different links when along the pathways from the macroeconomic explanatory variables to household income inequality. The first pathway goes through the impact on labour earnings inequality - from the dark blue to light blue shaded boxes. Earnings inequality in this framework is assessed in terms of both wage dispersion among workers and individual earnings dispersion among the whole working-age population, which takes into account under-employment and inactivity. The second pathway is the transmission of labour earnings inequalities to household income inequalities - the move from the light blue to the unshaded boxes. This pathway involves several steps, which takes into account the importance of earnings dispersion together with other factors (e.g. changes in household structure and the influence of other income sources). The third pathway is the one to final household disposable and adjusted disposable income - from the unshaded to the grey shaded boxes. This pathway takes into account the impact of taxes and transfers, both cash and in-kind.*
Analytical framework for the analysis of income inequality used in the report
The empirical analysis examines in a first step whether and how trends in globalisation, technological change and institutions and policies have translated into inequalities in wages and earnings. It then, in a second step, determines the extent to which trends in labour earnings inequality are responsible for changes in income inequality. The third step examines possible reasons for changes in the redistributive effectiveness of tax/transfer systems over time and the impact of publicly provided services.
The second term that requires clarification is "globalisation". There are different aspects to economic globalisation [5] and they are likely to impact on trends in wage, earnings and income inequalities in different ways and in possibly opposing directions:
� Trade integration (goods and services mobility).
� Financial integration (capital mobility).
� Technology transfers (information mobility).
� Production relocation (firm mobility).
� International migration (labour mobility).
Third, it should be clear which reference population is being examined. Most studies that analyse the drivers of inequality refer to income inequality among the entire population. But globalisation, technology, and regulatory reform do not impact on people of working age as they do on children or senior citizens, one reason being that very specific policies in place address their particular needs. Changes in pension systems (in the past) will affect the present income situation of retired people, for instance, which can obscure findings and blur the picture. The analyses in this study focus on the working-age population, which allows the report to paint a more precise picture of the processes at work in the labour market and how they shape the incomes of households. [6] The analytical framework of the report is outlined in Box 1.
On the basis of the analytical framework set out in the box above, this report addresses inequality in three parts. Part I looks at whether and how trends in globalisation, technological change and institutions and policies translated into inequalities in wages and earnings. The focus is on identifying the main driving forces of increased wage and earnings inequality within, rather than between, countries. Part II analyses what comprises the transition from earnings to income inequality, looking at such factors in household earnings inequality as the impact of changing family structures as well as other income sources that contribute to households' disposable income. Part III analyses the possible reasons for changes in the impact of tax and transfer systems in OECD countries. It also looks at the impact of publicly provided services, updating and extending the work presented in OECD (2008). Finally, it discusses the tax policy implications of recent top-income trends.
2. What drives growing earnings and income disparities?
Is globalisation the main culprit in higher wage inequality?
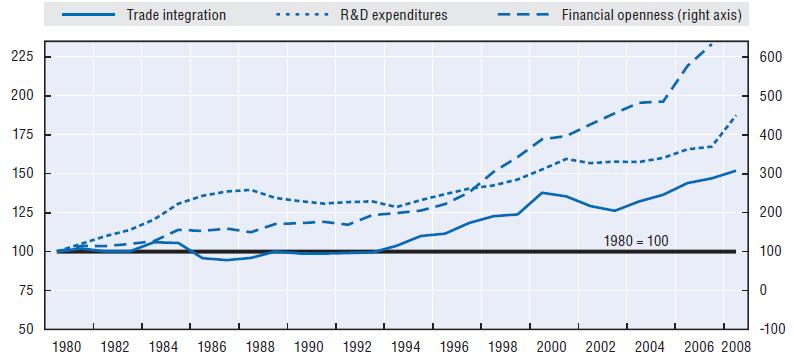
Over the past decades, OECD countries underwent significant structural changes, driven by their closer integration into the global economy and to rapid technological progress. These changes often brought highly skilled workers greater rewards than low-skilled ones and thus affected the way earnings from work were distributed. The rising gap between the earnings of the highly skilled and those of the low-skilled springs from several factors. First, a rapid rise in the integration of trade and financial markets generated a relative shift in labour demand in favour of highly skilled workers. Second, technological progress shifted production technologies in both industries and services in favour of skilled labour. These structural changes got underway in the early 1980s and accelerated from the mid-1990s (Figure 3). [7]
The share of global trade in world GDP grew from about one-third to over a half in the 30 years to 2008 (IMF, 2007). In that time, trade integration - the sum of imports and exports as a share of GDP - doubled in many OECD countries. But globalisation is not only about trade in goods and services. It also concerns foreign direct investment. Outward stocks of FDI increased steeply in all OECD countries - from an average of less than 5% of GDP in 1980 to nearly 50% in the late 2000s. OECD countries have seen substantial growth in the number of multinational corporations as well as their overseas operations, which reflects greater offshore outsourcing of their activities. A common assumption is that offshoring disproportionately hurts lowerskilled jobs. Globalisation also went hand-in-hand with the rapid adoption of new technologies which may have penalised those workers who did not have the necessary skills to use them effectively. Technological progress is therefore often seen as inherently "skillsbiased". But disentangling the different effects of these forces is not easy. Technological progress may, for instance, be enhanced by closer trade integration while, at the same time, better communication facilities and technology may lead to greater trade integration.
Figure 3. The integration of trade and financial markets and technological progress grew rapidly, especially from the mid-1990s
Developments in trade integration, financial openness and technological change, OECD average, 1980-2008 (1980 = 100)
Note: Trade integration is defined as the sum of imports and exports as a percentage of GDP. Financial openness is defined as the sum of cross-border liabilities and assets as a percentage of GDP. R&D expenditures refer to businesssector expenditures on research and development as a percentage of GDP.
Source: OECD Trade Indicators Database; External Wealth of Nations Mark II Database (EWN II), IMF dataset; OECD Main
Science and Technology Indicators.
StatLink http://dx.doi.org/10.1787/888932535223This report finds that neither rising trade integration nor financial openness had a significant impact on either wage inequality or employment trends within the OECD countries. The wage-inequality effect of trade appears neutral even when only the effects of increased import penetration from emerging economies are considered - a finding that runs counter to the expectation that trade flows should drive down wages of workers in manufacturing and/or services in OECD countries. However, increased imports from low-income countries do tend to heighten wage dispersion, although only in countries with weaker employment protection legislation.
The study also shows, however, that increased financial flows and technological change had an impact on inequality. Growing outward FDI was associated with increases in wage dispersion, albeit only in the upper half of the wage distribution, while technological progress contributed to the increase in overall wage dispersion, chiefly in the upper half of the distribution.
The impact of regulatory reforms
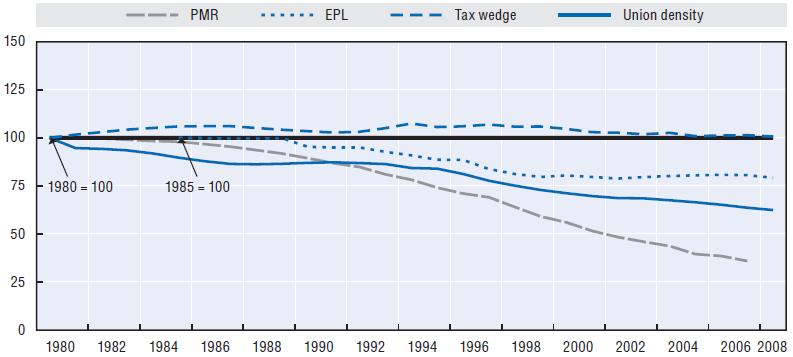
In the two decades from 1980 to 2008, most OECD countries carried out regulatory reforms to strengthen competition in the markets for goods and services and to make labour markets more adaptable. All countries, for example, significantly relaxed anticompetitive product-market regulations and many also loosened employment protection legislation (EPL) for workers with temporary contracts. Minimum wages also declined relatively to median wages in a number of countries between the 1980s and 2008. Wagesetting mechanisms also changed: the share of union members among workers fell across most countries, although the coverage of collective bargaining generally remained rather stable over time. A number of countries cut unemployment benefit replacement rates and, in an attempt to promote employment among low-skilled workers, some also reduced taxes on labour for low-income workers (Figure 4).
These changes in policies and institutions affected the ways in which globalisation and technological changes translated into distributional changes. On the one hand, past empirical evidence points to the significant positive impact of reforms on employment levels (e.g. OECD, 2006). Greater product market competition in particular has been found to increase aggregate employment by reducing market rents and expanding activity, which in turn leads to stronger labour demand (Blanchard and Giavazzi, 2003; Spector, 2004; Messina, 2003; Fiori et al., 2007; Bassanini and Duval, 2006). There is also some evidence that lower unemployment benefit replacement rates and lower tax wedges are associated with higher employment. The analyses in Chapter 3 confirm these findings. With the exception of EPL, all aspects of regulatory and institutional changes analysed exerted a significant positive impact on the employment rate.
On the other hand, most policy and institutional reforms also contributed to widening wage disparities, as more low-paid people entered employment and the highly skilled reaped more benefits from a more dynamic economy. A number of previous studies associated less strict EPL and declines in union density and bargaining coverage with higher wage dispersion among those in work (e.g. Koeninger et al., 2007; Visser and Cecchi, 2009; Wallerstein, 1999). The analyses in Chapter 2 confirm that many dimensions of regulatory reform and institutional change impacted on increasing wage inequality. More flexible product market regulation, for instance, contributed to increase wage dispersion in the OECD area. Lower market rents and increased competition led to a greater demand for skilled labour and a more dispersed wage structure. Lower tax wedges also contributed to increased wage dispersion. Dwindling benefit replacement rates for low-wage workers (but not for workers on the average wage) also drove up wage dispersion - lower replacement rates mean lower reservation wages. Furthermore, less strict EPL is associated with greater wage dispersion, driven entirely by reforms to EPL for temporary workers.
Figure 4. Product and labour market regulations and institutions became weaker
Developments in product market regulation, employment protection legislation, tax wedges and union density, OECD average, 1980-2008 (1980 = 100)
Note: "PMR" is a summary indicator for product market regulation. "EPL" is a summary indicator of the strictness of overall employment protection legislation (only available from 1985 onwards). "Tax wedge" refers to an average worker and is the sum of income tax and employees and employers payroll taxes as a percentage of labour costs. "Union density" is the number of union members as a proportion of all employees eligible to be members.
Source: See Chapter 1, Figure 1.18.
StatLink http://dx.doi.org/10.1787/888932535242It is therefore important to emphasize that regulatory and institutional changes tend to have contrasting effects on employment and wage distribution - i.e. they tend to increase employment opportunities while, at the same time, contributing to wider wage disparities. However, the combined influence of these factors on overall earnings inequality and household income inequality is less straightforward. Promoting employment opportunities for under-represented groups could increase market income for certain households and increase the overall resources available for redistribution. At the same time, rises in the overall employment rate do not necessarily have a direct impact on reduced household income inequality (e.g. ILO, 2008).
The analyses in Chapter 3 are a first step in answering the question of the "overall" effect of regulatory and institutional changes. They calculate the relative contributions of the employment rate and the wage inequality effect, respectively, to an estimate of "overall earnings inequality" among the entire working-age population (i.e. including workers and jobless individuals). Combining the employment and wage effects reveals that they tend to cancel each other out and that the net effect of regulatory reforms on trends in "overall earnings inequality" remains indeterminate in most cases.
As the estimate of "overall earnings inequality" is sensitive to the assumption about the "potential earnings" of non-workers, Chapter 3 provides upper- and lower-bound values for the employment effect and the wage effect. In the lower-bound scenario (which assumes zero earnings for non-workers), some regulatory reforms (e.g. changes in unionisation and tax wedges) may have had an overall equalising effect. In the upperbound scenario (which imputes "shadow" wages to non-workers), some reforms (e.g. changes in PMR and unemployment benefit replacement rates) may have had an overall disequalising effect. In both scenarios, changes in EPL had an overall disequalising effect.
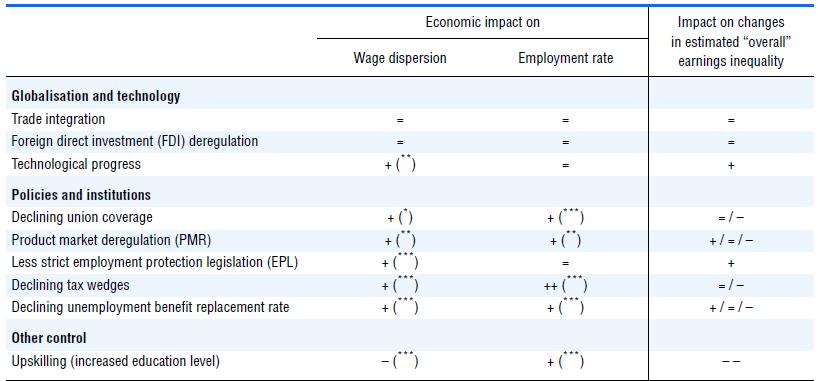
Finally, the results from the study highlight the central role of education. The rise in the supply of skilled workers considerably offset the increase in wage dispersion associated with technological progress, regulatory reforms and institutional changes. The upskilling of the labour force also had a significant impact on employment growth. The growth in average educational attainment thus appears to have been the single most important factor contributing not only to reduced wage dispersion among workers but also to higher employment rates. On the basis of these results, the evolution of earnings inequality across OECD countries over the past few decades could be viewed mainly as the difference between the demand for and supply of skills or, as neatly summarised by Tinbergen (1975), the outcome of a "race between education and technology" (Table 2).
Table 2. Trends in technology, policies and education were the key drivers of changes in wage inequality and employment in the OECD area
Summary of regression results from Chapters 2 and 3
Note: Summary results from pooled regression analysis (fixed-effects model, controlling for output gap, female employment shares and sectoral employment shares), covering 22 OECD countries for the period 1980 to 2008 (352 observations).
Wage dispersion defined as the ratio of the 10% best-paid workers to that of the least-paid workers (D9/D1 ratio). Trade integration refers to detrended series of total trade exposure. Technological progress refers to detrended series of business-sector expenditures on R&D as a percentage of GDP.
A positive/negative sign indicates an effect which increases/decreases wage dispersion or employment rate. "+" (or "-") indicates that the standardised coefficient is positive (or negative) and is less than one-third (0.33) for one standard deviation change in the unit, and "++" (or "-") if the standardised coefficient is 0.33 or more. Values in parentheses (***, **, *) indicate that the estimated coefficient is significant at the 1%, 5% and 10% levels, respectively. "=" indicates insignificant estimates (less than at the 10% level), regardless of the value of the coefficient.
Source: Chapter 3, Table 3.3.
StatLink http://dx.doi.org/10.1787/888932537389Changes in hours worked favour higher-wage earners
Types of jobs and work arrangements are another important factor in earnings inequality. Although previously under-represented groups, such as women, participate increasingly in the labour market, they often only work part-time and tend to suffer from a wage gap with their male counterparts. Cross-national differences in the variation of hours worked may be due to differences in macroeconomic conditions, while also reflecting supply-side and policy differences, e.g. preferences for part-time work or the strictness of regulations governing working time across countries.
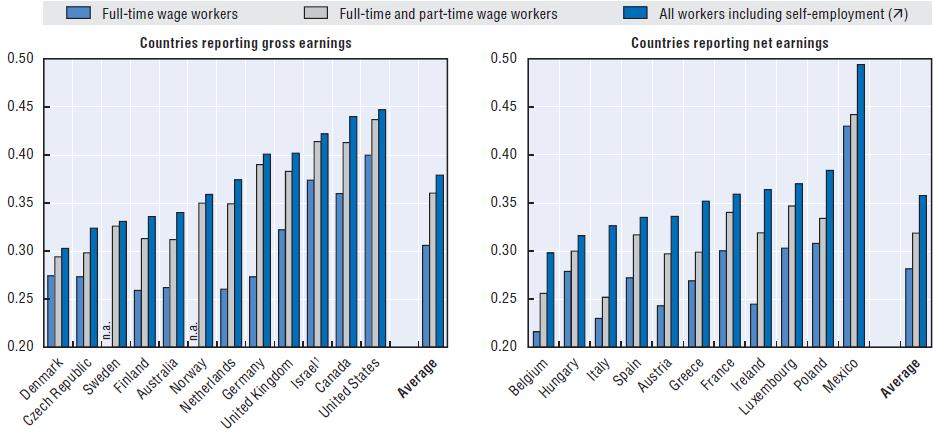
On average across the OECD, the share of part-time employment in total employment increased from 11% in the mid-1990s to about 16% by the late 2000s, with the strongest increases observed in some European countries - Germany, Ireland, the Netherlands, and Spain (OECD, 2010). While offering suitable employment opportunities for traditionally under-represented groups, part-time work also contributed to widening gaps in the distribution of wages. Indeed, adding part-time workers to the full-time gross earnings distribution increases the Gini coefficient of inequality by more than five percentage points on average and by another two points when self-employed workers are also included (Figure 5).
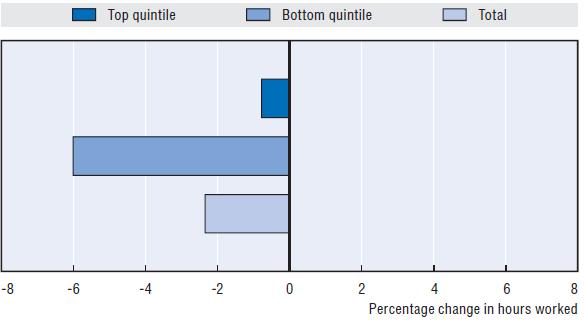
However, changes in working-time arrangements affected high- and low-wage workers differently. Average annual hours worked per person in dependent employment fell slightly in most OECD countries between the late 1990s and 2008. However, more working hours were lost among low-wage than among high-wage earners, again contributing to increasing earnings inequality. In many countries, there was a trend towards an increasing divide in hours worked between higher- and lower-wage earners.
Figure 5. Levels of earnings inequality are much higher when part-timers and self-employed are accounted for
Earnings inequality (Gini coefficients) among full-timers, part-timers and all workers including the self-employed, mid-2000s
Note: Working-age individuals living in a working household. Countries are presented in increasing order of earnings inequality among all workers.
Data refer to a year between 2003 and 2005, except for Belgium and France (2000).
1. Information on data for Israel: http://dx.doi.org/10.1787/888932315602.
Source: Chapter 4, Figure 4.1.
StatLink http://dx.doi.org/10.1787/888932535261Variations in hourly wage rates still explain the largest part of the level of gross earnings inequality among all workers in most countries (55-63% on average). However, changes in earnings inequality over time seem to be driven as much by the trends in hours worked, as outlined in Figure 6.
Do changes in household structure matter for inequality?
Household structures changed profoundly over the past decades in OECD countries. There are more single-headed households with and without children today than ever before: their share of working-age households increased in all OECD countries, from an on average of 15% in the late 1980s to 20% in the mid-2000s. Smaller households are less able to benefit from the savings associated with pooling resources and sharing expenditures. A trend toward smaller households is therefore likely to increase earnings and income inequality.
In couple households, the wives of top earners were those whose employment rates increased the most. There was also in all countries a rise in the phenomenon known as "assortative mating", that is to say people with higher earnings having their spouses in the same earnings bracket - e.g. doctors marrying doctors rather than nurses. Today, 40% of couples where both partners work belong to the same or neighbouring earnings deciles compared with 33% some 20 years ago.
Figure 6. Hours worked declined more among lower-wage workers
Trends in annual hours worked by the bottom and top 20% of earners, OECD average, mid-1980s to mid-2000s
Note: Paid workers of working age.
Source: Chapter 4, Figure 4.5.
StatLink http://dx.doi.org/10.1787/888932535280These trends contributed to higher household earnings inequality in the period under study. Some observers even consider changes in family formation to be the main reason for rising inequality. Daly and Valletta (2006), for instance, suggest that the increase in singleheaded families is responsible for much of the growth in inequality in the United States, while several studies also suggest that the growing correlation of spouses' earnings across couple households contributes significantly to widening inequality (Cancian and Reed, 1999; Hyslop, 2001; Schwartz, 2010). For an overall assessment, it is important to consider the effect of such demographic changes along with the impact of changes related more to the labour market.
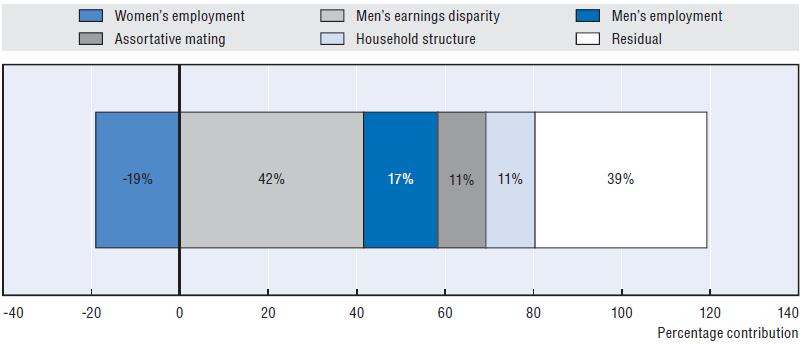
This report suggests that household structure changes played a much more modest part in rising inequality than changes related exclusively to the labour market. The analysis in Chapter 5 suggests that the increase in men's earnings disparities was the main factor driving household earnings inequality. Depending on the country, it accounted for between one-third and one-half of the overall increase. Increased employment opportunities for women, however, worked in the opposite direction in all countries, contributing to a more equal distribution of household earnings. Finally, changes in household structures (assortative mating and increases in single-headed households) increased household earnings inequality, albeit to a lesser extent than often suggested (Figure 7). These patterns hold true for all countries.
Beyond earnings: the impact of capital and self-employment income
Changes in the earnings distribution account for much but not all of the trends in household income inequality in OECD countries. A much debated driver of income inequality in OECD countries is the distribution of incomes from capital, property, investment and savings, and private transfers. Such distribution has grown more unequal over the past two decades. Capital income, in particular, saw a greater average increase in inequality than earnings in twothirds of OECD countries between the mid-1980s and the late 2000s.
But how important is the share of capital income in household income? Even though its share increased in most countries, it remained at a moderate average level of around 7% of total income. Not surprisingly, rises in the share of capital income were due predominantly to movements in the upper part of the distribution (Figure 8). Capital income shares grew particularly fast in the Nordic countries and in New Zealand. Compared with labour earnings, the contribution of capital income to household income inequality was comparatively low, even though it rose in the 1990s and 2000s. Although earnings remained the most important driver of income inequality in any given year in any OECD country, their relative contribution to income inequality fell in most, particularly from the mid-1990s.
Figure 7. Demographic changes were less important than labour market trends in explaining changes in household earnings distribution
Percentage contributions to changes in household earnings inequality, OECD average, mid-1980s to mid-2000s
Note: Working-age population living in a household with a working-age head. Household earnings are calculated as the sum of earnings from all household members, corrected for differences in household size with an equivalence scale (square root of household size). Percentage contributions of estimated factors were calculated with a decomposition method which relies on the imposition of specific counterfactuals such as: "What would the distribution of earnings have been in recent year if workers' attributes had remained at their early year level?" The residual indicates the importance of unmeasured factors. These include other changes in household characteristics, such as trends in ageing or migration.
Source: Chapter 5, Figure 5.9.
StatLink http://dx.doi.org/10.1787/888932535299
Figure 8. Capital income became a greater source of household income, but mainly in rich households Percentage-point changes in the shares of capital income in total household income, mid-1980s to late 2000s
1. Information on data for Israel: http://dx.doi.org/10.1787/888932315602.
Source: Chapter 6, Table 6.2.
StatLink http://dx.doi.org/10.1787/888932535318Self-employment can also have an impact on overall earnings inequality because the income it generates is much more unevenly distributed than wages and salaries, as shown in Figure 5. Furthermore, the self-employed are disproportionally concentrated in the lower and middle tails of the distribution in most OECD countries. However, the effect of self-employment on overall inequality remained modest. This was because the share of self-employment income fell in most countries and accounted for only a relatively small share of gross labour income - between 3% and 13%, depending on the country. Selfemployment income thus accounted for generally less than 15% of overall inequality among all workers - a contribution that changed little over the period of time under study.
Have income taxes and benefit systems become less effective in redistributing income?
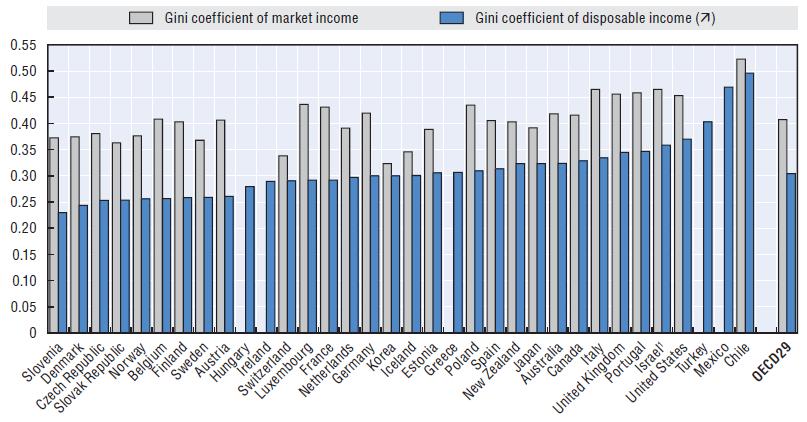
Public cash transfers, as well as income taxes and social security contributions, played a major role in all OECD countries in reducing market-income inequality. Together, they were estimated to reduce inequality among the working-age population (measured by the Gini coefficient) by an average of about one-quarter across OECD countries. This redistributive effect was larger in the Nordic countries, Belgium and Germany, but well below average in Chile, Iceland, Korea, Switzerland and the United States (Figure 9).
Figure 9. Market incomes are distributed much more unequally than net incomes
Inequality (Gini coefficient) of market income and disposable (net) income in the OECD area, working-age persons, late 2000s
Note: Late 2000s refers to a year between 2006 and 2009. The OECD average excludes Greece, Hungary, Ireland, Mexico and Turkey (no information on market income available). Working age is defined as 18-65 years old. Countries are ranked in increasing order of disposable income inequality.
1. Information on data for Israel: http://dx.doi.org/10.1787/888932315602.
Source: Chapter 6, Figure 6.1.
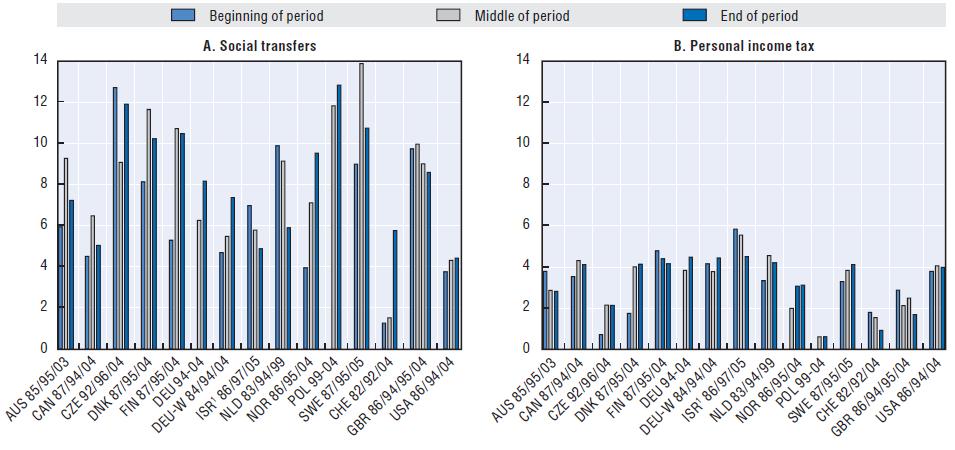
StatLink http://dx.doi.org/10.1787/888932535337In most countries, the extent of redistribution has increased over the period under study as a whole. As a result, tax-benefit policies offset some of the large increases in market-income inequality, although they appear to have become less effective at doing so since the mid-1990s. Until the mid-1990s, tax-benefit systems in many OECD countries offset more than half of the rise in market-income inequality. However, while marketincome inequality continued to rise after the mid-1990s, much of the stabilising effect of taxes and benefits on household income inequality declined (Figure 10).
Figure 10. While market income inequality rose, redistribution through tax/transfers became less effective in many countries
Changes in cash redistribution of social transfers, personal income taxes and social security contributions, mid-1980s to mid-2000s
Note: Redistribution is the difference between the Gini coefficients before and after the respective tax or benefit. Households headed by a working-age individual.
1. Information on data for Israel: http://dx.doi.org/10.1787/888932315602.
Source: Chapter 7, Figure 7.3.
StatLink http://dx.doi.org/10.1787/888932535356Why did the tax-benefit system became less redistributive since the mid-1990s? Cash redistribution relies on three instruments: benefits, income taxes, and social security contributions. Overall, the redistribution trends were driven chiefly by benefits or, to be more precise, by changes in their receipt patterns and generosity. Changes in the numbers of unemployed and reforms to benefit eligibility criteria appear to have been particularly important factors, whereas benefit targeting seems to have played less of a role. Although governments tended to spend more on benefits overall, transfers did not become more progressive. [8] In addition, spending on out-of-work benefits shifted towards "inactive" benefits, which resulted in reduced activity rates and thus exacerbated the trend towards higher market-income inequality.
Despite the substantial gains of high-income earners in some countries, income taxes played a relatively minor role in moderating trends towards higher inequality. The reason is that trends towards lower income taxes, on the one hand, and more progressive taxation, on the other, had opposite effects on redistribution and partly cancelled each other out. Finally, because of their relatively flat-rate structure, social security contributions redistributed very little. Where contribution ceilings were in place they may even have been regressive. As a result, social contributions did not play a major role in altering redistribution directly, despite their growing importance as a revenue source (up from an average of 8% of GDP in 1985 across OECD countries to almost 11% in 2005).
How redistributive are non-cash transfers from public services?
Redistribution is not only about cash. Governments spend as much - some 13% of GDP - on public social services (education, health, care services, etc.) as they do on all cash benefits taken together. Some countries even spend much more on the provision of such "in-kind" services than on cash benefits: it is the case in the English-speaking and Nordic countries, Korea, and Mexico. While the prime objective of social services is not redistribution, but the provision of a decent education, basic health care, and acceptable living standards for all, they are in fact redistributive. Across OECD countries, they reduced income inequality by one-fifth on average (Figure 11) and their share of GDP and redistributive impact remained constant over the 2000s. [9]
Rising top-income shares: what implications for tax policy?
There was a rise in the share of top-income recipients in total gross income in the three decades from 1980 to 2010 in all countries, with considerable variation from country to country. It was most marked in the United States: prior to the onset of the financial and economic crisis in 2008, the share of the richest 1% in all income reached close to 20%. However, it was also large in a number of other English-speaking countries (Australia, Canada, Ireland and the United Kingdom). Elsewhere, increases tended to be greater in the Scandinavian and Mediterranean countries than in Continental European countries (Figure 12).
Even within the group of top income earners, incomes became more concentrated (Atkinson et al., 2011). In the United States, for instance, the share of the top 0.1% in total pre-tax income quadrupled in the 30 years to 2008. Just prior to the global recession, the top 0.1% accounted for some 8% of total pre-tax incomes in the United States, some 4-5% in Canada, the United Kingdom, and Switzerland, and close to 3% in Australia, New Zealand, and France (Chapter 9).
Figure 11. In-kind benefits from public services are redistributive in all OECD countries
Household income inequality (Gini coefficients) before and after accounting for services from education, health, social housing and care services, 2007
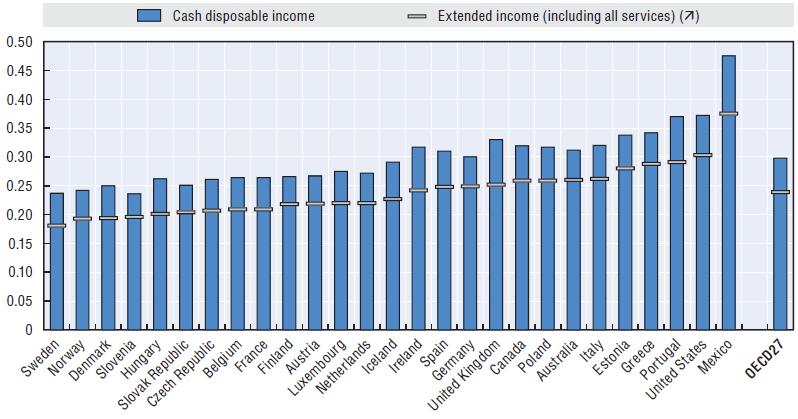
Note: Countries are ranked in increasing order of inequality of extended income, i.e. disposable income adjusted for the money value of services in education, health care, social housing, and the care of children and the elderly.
Source: Chapter 8, Table 8.2.
StatLink http://dx.doi.org/10.1787/888932535375
Figure 12. The share of top incomes increased, especially in English-speaking countries
Shares of top 1% incomes in total pre-tax incomes, 1990-2007 (or closest year)
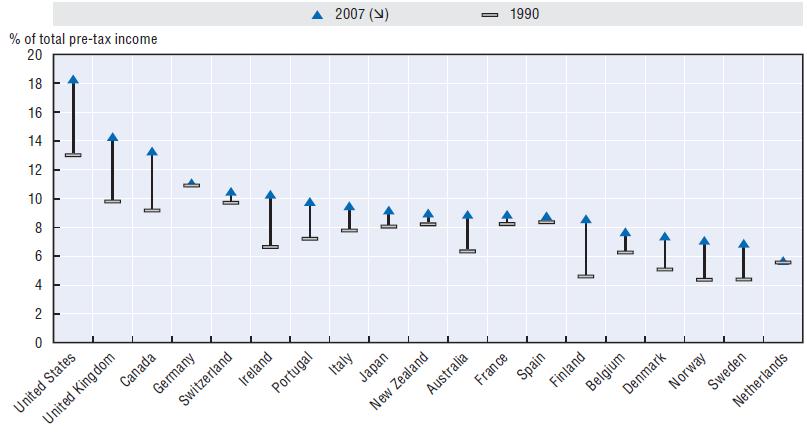
Note: 2007 values refer to 2006 for Belgium, France and Switzerland; 2005 for Japan, Netherlands, New Zealand, Portugal, Spain and the United Kingdom; 2004 for Finland; and 2000 for Germany and Ireland. Countries are ranked by decreasing shares in the latest year.
Source: Chapter 9, Figure 9.A2.2.
StatLink http://dx.doi.org/10.1787/888932535394There are several reasons why the share of top incomes surged in the 1990s and 2000s. They include a more global market for talent and a growing use of performance-related pay which particularly benefitted top executives and finance professionals, as well as changes in pay norms. Behavioural responses to reductions in marginal tax rates played a significant part in these developments. Top rates of personal income tax, which were in the order of 60-70% in major OECD countries, fell to around 40% on average by the late 2000s.
These marginal rates reveal how much tax is paid on the last dollar earned, which is what drives incentives. However, the redistributional effects of tax regimes depend on the percentage of total income actually paid in taxes, the so-called "effective tax rate". Just prior to the 2008-09 global downturn, effective tax rates of the top percentile group were in the order of 35-38% for a group of typical OECD countries (Australia, Belgium, Canada, Italy, Netherlands, Norway, and Sweden). The rise in the share of top-income recipients in total income is a sign that their capacity to pay tax increased and progressive tax reforms may thus be an effective tool. In particular, tax reforms that increase average tax rates without raising marginal rates (e.g. by scaling back tax reliefs) could enable greater redistribution without undue blunting of incentives.
3. Lessons for policies
Rising income inequality creates economic, social and political challenges. It can stifle upward social mobility, making it harder for talented and hard-working people to get the rewards they deserve. Intergenerational earnings mobility is low in countries with high inequality such as Italy, the United Kingdom, and the United States, and much higher in the Nordic countries, where income is distributed more evenly (OECD, 2008). The resulting inequality of opportunity will inevitably impact economic performance as a whole, even if the relationship is not straightforward. Inequality also raises political challenges because it breeds social resentment and generates political instability. It can also fuel populist, protectionist, and anti-globalisation sentiments. People will no longer support open trade and free markets if they feel that they are losing out while a small group of winners is getting richer and richer.
Reforming tax and benefit policies is the most direct and powerful instrument for increasing redistributive effects. Large and persistent losses in low-income groups following recessions underline the importance of well-targeted income-support policies. Government transfers - both in cash and in-kind - have an important role to play in guaranteeing that low-income households do not fall further back in the income distribution.
At the other end of the income spectrum, the relative stability of higher incomes - and their longer-term trends - are important to bear in mind in planning broader reforms of redistribution policies. It may be necessary to review whether existing tax provisions are still optimal in light of equity considerations and current revenue requirements. This is especially the case where the share of overall tax burdens borne by high-income groups has declined in recent years (e.g. where tax schedules became flatter and/or where tax expenditures mainly benefitted high-income groups).
However, redistribution strategies based on government transfers and taxes alone would be neither effective nor financially sustainable. First, there may be counterproductive disincentive effects if benefit and tax reforms are not well designed. Second, most OECD countries currently operate under a reduced fiscal space which exerts strong pressure to curb public social spending and raise taxes. Growing employment may contribute to sustainable cuts in income inequality, provided the employment gains occur in jobs that offer career prospects. Policies for more and better jobs are more important than ever.
A key challenge for policy, therefore, is to facilitate and encourage access to employment for under-represented groups, such as youths, older workers, women and migrants. This requires not only new jobs, but jobs that enable people to avoid and escape poverty. Recent trends towards higher rates of in-work poverty indicate that job quality has become a concern for a growing number of workers. Policy reforms that tackle inequalities in the labour market, such as those between standard and non-standard forms of employment, are needed to reduce income inequality. The lessons from the Restated Jobs Strategy (OECD, 2006), adapted to recent experience, provide important guidelines in this respect, e.g. with regard to more balanced policy measures between temporary and permanent employment contracts.
Finally, policies that invest in the human capital of the workforce are key. Over the past two decades, the trend to higher educational attainment has been one of the most important elements in counteracting the underlying increase in earnings inequality in the long run. Policies that promote the up-skilling of the workforce are therefore key factors for reversing the trend towards further growth in inequality.
Human capital policies comprise two main strands. First, better job-related training and education for the low-skilled (on-the-job training) would help to boost their productivity potential and future earnings. This requires measures to ensure that training markets perform better, as well as ensuring sufficient incentives for both workers and firms to invest more in on-the-job training (OECD, 2006). To compensate for mobility (staff turnover), corporate tax policies that encourage employers to make additional investments in the human capital of their employees are warranted (e.g. deduction of training expenses as business costs).
The second strand is equal access to formal education over working life. Access to tertiary education is important for improving the prospects and living standards of lower-skilled people and giving individuals the opportunity to acquire the skills needed in the labour market. Educational or learning accounts can be a means to help achieve this objective (OECD, 2005), but tax incentives need to be designed in such a way that they do not disproportionally benefit higher-wage earners in high marginal tax rates.
The new OECD work presented in this report shows that there is nothing inevitable about growing inequalities. Globalisation and technological changes offer opportunities but also raise challenges that can be tackled with effective and well-targeted policies. Regulatory reforms can be designed in such a way that they make markets more efficient and encourage employment while reducing inequalities at the same time. Labour market and social policies also need to be adapted to changing household structures. Policies for inclusive growth are required in the current situation. Any policy strategy to reduce the growing divide between the rich and poor should rest on three main pillars: more intensive human capital investment; inclusive employment promotion; and well-designed tax/ transfer redistribution policies.
[Source: Organisation for Economic Co-operation and Development, Paris, Dec11]
References
� Atkinson, A.B. (2009), The Changing Distribution of Earnings in OECD Countries, Oxford University Press, Oxford.
� Atkinson, A.B., T. Piketty and E. Saez (2011), "Top Incomes in the Long Run of History", Journal of Economic Literature, Vol. 2011, No. 49:1, pp. 3-71.
� Bassanini, A. and R. Duval (2006), "Employment Patterns in OECD Countries: Reassessing the Role of Policies and Institutions", OECD Economics Department Working Paper, No. 486, OECD Publishing, Paris.
� Blanchard, O. and F. Giavazzi (2003), "Macroeconomic Effects of Regulation and Deregulation in Goods And Labor Markets", Quarterly Journal of Economics, Vol. 118, No. 3, MIT Press, Cambridge, pp. 879-907.
� Cancian, M. and D. Reed (1999), "The Impact of Wives' Earnings on Income Inequality: Issues and Estimates", Demography, Vol. 36, No. 2, May, pp. 173-184.
� Daly M.C. and R.G. Valletta (2006), "Inequality and Poverty in United States: The Effects of Rising Dispersion of Men's Earnings and Changing Family Behaviour", Economica, London School of Economics and Political Science, Vol. 73, No. 289, pp. 75-98.
� Dreher, A. and N. Gaston (2008), "Has Globalization Increased Inequality?", Review of International Economics, Vol. 16, No. 3, pp. 516-536.
� Engel, E., A. Galetovic and C. Raddatz (1999), "Taxes and Income Distribution in Chile: Some Unpleasant Redistributive Arithmetic", Journal of Development Economics, Vol. 59, No. 1, pp. 155-192.
� Fiori, G., G. Nicoletti, S. Scarpetta and F. Schiantarelli (2007), "Employment Outcomes and the Interaction between Product and Labor Market Deregulation: Are They Substitutes or Complements?", IZA Discussion Paper, No. 2770, Bonn.
� Freeman, R. (2009), "Globalization and Inequality", in W. Salverda, B. Nolan and T. Smeeding (eds.), Oxford Handbook of Economic Inequality, Oxford University Press, pp. 575-589.
� Heshmati, A. (2004), "The Relationship Between Income Inequality, Poverty and Globalisation", IZA Discussion Paper, No. 1277, Bonn.
� Hyslop, D.R. (2001), "Rising US Earnings Inequality and Family Labor Supply: The Covariance Structure of Intrafamily Earnings", American Economic Review, Vol. 91, pp. 755-777.
� IMF (2007), "Globalization and Inequality", World Economic Outlook, IMF, Washington, pp. 31-65, October.
� International Labour Office (ILO) (2008), "Labour Institutions and Inequality", World of Work Report, ILO, Geneva, pp. 71-114, October.
� Jaumotte, F., S. Lall and C. Papageorgiou (2008), "Rising Income Inequality: Technology, or Trade and Financial Globalization?", IMF Working Paper, No. WP/08/185, Washington.
� Jenkins, S., A. Brandolini, J. Micklewright and B. Nolan (2011), "The Great Recession and the Distribution of Household Income", Report for the XIII Fondazione Rodolfo Debenedetti Conference, Palermo, 10 September 2011.
� Kremer, M. and E. Masking (2006), "Globalization and Inequality", Working Paper 2008-0087, Weatherhead Center for International Affairs, Harvard University, Cambridge, MA.
� Krugman, P. (2007), "Trade and Inequality, Revisited", http://voxeu.org/index.php?q=node/261.
� Messina, J. (2003), "The Role of Product Market Regulations in the Process of Structural Change", Working Paper Series, No. 217, European Central Bank.
� Milanovic, B. and L. Squire (2005), "Does Tariff Liberalization Increase Wage Inequality? Some Empirical Evidence", World Bank Policy Research Working Paper, No. 3571, World Bank, Washington.
� OECD (2005), Education Policy Analysis, OECD Publishing, Paris.
� OECD (2006), OECD Employment Outlook - Boosting Jobs and Incomes, OECD Publishing, Paris.
� OECD (2007), Offshoring and Employment: Trends and Impacts, OECD Publishing, Paris.
� OECD (2008), Growing Unequal? Income Distribution in OECD Countries, OECD Publishing, Paris.
� OECD (2010), OECD Employment Outlook, OECD Publishing, Paris.
� Scheve, K.F. and M.J. Slaughter (2007), "A New Deal for Globalization", Foreign Affairs, Vol. 86, No. 4, pp. 34-47, New York City.
� Schwartz, C.R. (2010), "Earnings Inequality and the Changing Association Between Spouses' Earnings", American Journal of Sociology, Vol. 115, pp. 1524-1557.
� Spector, D. (2004), "Competition and the Capital-labor Conflict", European Economic Review, Vol. 48, No. 1, Elsevier, pp. 25-38, February.
� Tinbergen, J. (1975), Income Distribution: Analysis and Policies, North-Holland Publishing, Amsterdam.
� Visser, J. and D. Cecchi (2009), "Inequality and the Labour Market: Unions", in W. Salverda, B. Nolan and T. Smeeding (eds.), Oxford Handbook of Economic Inequality, Oxford University Press, pp. 230-256.
� Wallerstein, M. (1999), "Wage-Setting Institutions and Pay Inequality in Advanced Industrialised Societies", American Journal of Political Science, Vol. 43, No. 3, pp. 649-680, Blackwell Publishing, Boston, MA.
ANNEX A1
Trends in Different Income Inequality MeasuresTable A1.1. Trends in different income inequality measures
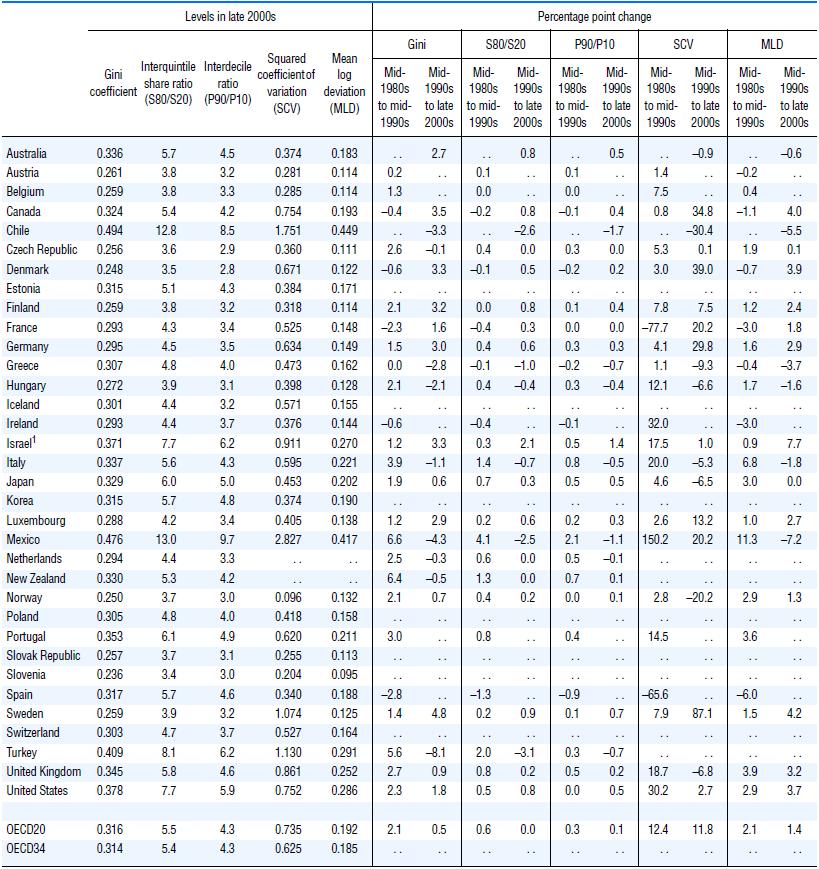
Note: Income refers to disposable household income, corrected for household size and deflated by the consumer price index (CPI). Earliest year refers to 1985, except for Austria, Belgium, Sweden (1983); France, Italy, Mexico, United States (1984); Finland, Luxembourg, Norway (1986); Ireland (1987); Greece (1988); Portugal (1990); Hungary (1991); Czech Republic (1992). Latest year refers to 2008, except for Chile (2009); Denmark, Hungary, Turkey (2007); Japan (2006). OECD20 excludes countries for which no longer-term trends are available.
1. Information on data for Israel: http://dx.doi.org/10.1787/888932315602.
Source: OECD Database on Household Income Distribution and Poverty.
StatLink http://dx.doi.org/10.1787/888932537408
Notes
1. The statistical data for Israel are supplied by and under the responsibility of the relevant Israeli authorities. The use of such data by the OECD is without prejudice to the status of the Golan Heights, East Jerusalem and Israeli settlements in the West Bank under the terms of international law. [Back]
2. Due to data availability at the time of writing, this report considers trends in income inequality up to 2008. The possible distributive effects of the global recession of 2008-09 could not be captured. Little international empirical evidence has become available since then. To make a first assessment of the distributive impacts of the Great Recession and subsequent recovery, an important recent study by Jenkins et al. (2011) uses microdata up to 2009 in combination with macroeconomic aggregates for the 2007-11 period in 21 OECD countries. It finds that the recession had no significant short-term distributional impacts in most countries, partly because the household sector was protected by additional public support through the tax and benefit system. Further, the effects of increasing unemployment, which drove inequality up, and declining capital income, which had an equalising effect, tended to cancel each other out. [Back]
3. This is often associated with the so-called Heckscher-Ohlin-Samuelson model or variants thereof (for a review see Freeman, 2009). [Back]
4. Of course, "inequality" can also be framed in a broader sense than income, e.g. inequality in consumption, or inequality of resources, including assets and wealth. This report is, however, concerned with income inequality and its subaggregates. [Back]
5. Some authors also include aspects of political and social globalisation into their empirical models, using composite globalisation indicators (Dreher and Gaston, 2008; Heshmati, 2004). These aspects are excluded from the framework applied here. [Back]
6. The parts of the report which look at household earnings and household income use the "equivalised income" concept which corrects for household size. This means that the status of other household members (including children and pensioners), as well as their income sources, influence the individual's income position. The unit of observation remains, however, the workingage individual. Exceptions are the two final chapters which consider the entire population. [Back]
7. Figure 3 uses the sum of cross-border liabilities and assets as a proxy for financial openness and R&D expenditures as a proxy for technological change. Other proxies for these drivers have been used in the literature and additional proxies have been applied in the analyses in Part I of this report. [Back]
8. This report considers tax and benefit programmes up to the late 2000s. It therefore does not capture more recent measures and initiatives that countries have implemented, partly in response to the recession. Many of these measures are focused on lower-income groups and are likely to impact on the distribution of household income. As an example, Chile introduced a cash transfer known as "Asignacion Social" alongside other means-tested programmes in 2011. [Back]
9. Chapter 8 includes only those 27 OECD countries for which micro-data were available for imputing the value of spending on public services. However, there is also evidence from national sources in some of the remaining countries that public services have had a significant redistributive impact, e.g. Engel et al. (1999) for Chile. [Back]