| Information |  | |
Derechos | Equipo Nizkor
| ||
| Information | | |
Derechos | Equipo Nizkor
| ||
Oct13
2013 - Global Hunger Index
The Challenge of Hunger: Building Resilience to Achieve Food and Nutrition Security FOREWORD
A crisis is an opportunity riding the dangerous wind.
--Chinese proverbIn 2012 Tropical Storm Isaac and Hurricane Sandy battered Haiti, damaging harvests, swelling rivers, flooding roads, and blocking access to communities. As food prices rose and debts mounted, poor Haitians took extreme measures. Some migrated. Others made ends meet by eating fewer meals per day and selling off their land or livestock. Every summer, Haitians fear nature's wrath.
Whether it's storms like these, or a drought, like the one in 2012 that left 18 million people in the Sahel hungry, other extreme weather, surging food prices, or prolonged political unrest, crises or shocks continue to buffet the poor and most vulnerable. All too often, those who are unable to cope find themselves more deeply entrenched in poverty, facing malnutrition and hunger.
It has become clear that it is not enough to help the poor and vulnerable survive short-term shocks. Because they are among those hit hardest by shocks and least able to cope, the constant exposure to manmade or natural shocks means they find it hard to improve their lot. Poor and vulnerable populations need more resilience, and a vital part of building resilience involves boosting food and nutrition security. Given that access to enough healthy food is a basic human right, it is critical that governments and nongovernmental and international organizations take steps to build resilience in a way that increases their food and nutrition security.
Resilience is the central theme of the 2013 Global Hunger Index report, published jointly by the International Food Policy Research Institute (IFPRI), Concern Worldwide, and Welthungerhilfe. Given that world hunger remains "serious," according to the index, with 19 countries suffering from levels of hunger that are either "alarming" or "extremely alarming," resilience-building efforts are much needed to boost food and nutrition security.
Chapter 03 describes a framework for resilience that could change how the development and humanitarian sectors design and implement interventions. It also offers examples of resilience-building programs that combine relief and development and explores indicators for measuring resilience in relation to food and nutrition security. Chapter 04 spotlights lessons learned from several programs carried out by Concern Worldwide and Welthungerhilfe that were designed to build resilience in communities.
This is the eighth year that the International Food Policy Research Institute has calculated the Global Hunger Index (GHI) and analyzed this multidimensional measure of global hunger. This series of reports records the state of hunger worldwide, by region and by country, spotlighting the countries and regions where action is most needed.
It should be noted that this report paints a picture of the recent past, not the present. The 2013 GHI reflects the most recent data available from governments and international agencies. Because of time lags and the dearth of up-to-the-minute data on global hunger, it does not, however, reflect the impact of the latest events. We hope that governments and international institutions will collaborate to gather more timely and comprehensive data on hunger in the near future.
The world has made some progress in reducing hunger since the early 1990s. If the recent slowdown can be reversed, the Millennium Development Goal target of halving the share of hungry people in the world between 1990 and 2015 may be within reach. But we are not on track to meet the 1996 World Food Summit's more ambitious goal of halving the number of hungry people in the same time period. In 1990-1992, 1 billion went hungry. Today, about 870 million, or 1 in 8 people worldwide, still suffer from hunger. This is no time for complacency. In 2012 during the Rio+20 conference, to build upon the work started by Millennium Development Goal 1, United Nations Secretary-General Ban Ki-moon proposed a more ambitious goal, the global "Zero Hunger Challenge" to end hunger in our lifetime. As long as people go hungry, the fight against hunger must continue.
Many of the shocks and stresses to which poor and hungry people are exposed are caused by the actions of more affluent regions and countries. We hope that this report will serve as a reminder to all of us--in industrialized countries, as well as in emerging economies and developing countries--to assume responsibility and to act together to reduce risk and build resilience to food and nutrition insecurity at the community, national, and international levels.
Dr. Wolfgang Jamann
Secretary General and Chairperson
WelthungerhilfeDr. Shenggen Fan
Director General International Food Policy Research InstituteDominic MacSorley
Chief Executive Concern Worldwide
CONTENTS
CHAPTER
01 The Concept of the Global Hunger Index
02 Global, Regional, and National trends
03 Understanding Resilience for Food and Nutrition Security
04 Building Community Resilience to Undernutrition: Learning from the Past to Inform the Future
05 Policy RecommendationsAPPENDIXES
A Data Sources and Calculation of the 1990, 1995, 2000, 2005, and 2013 Global Hunger Index Scores
B Data Underlying the Calculation of the 1990, 1995, 2000, 2005, and 2013 Global Hunger Index Scores
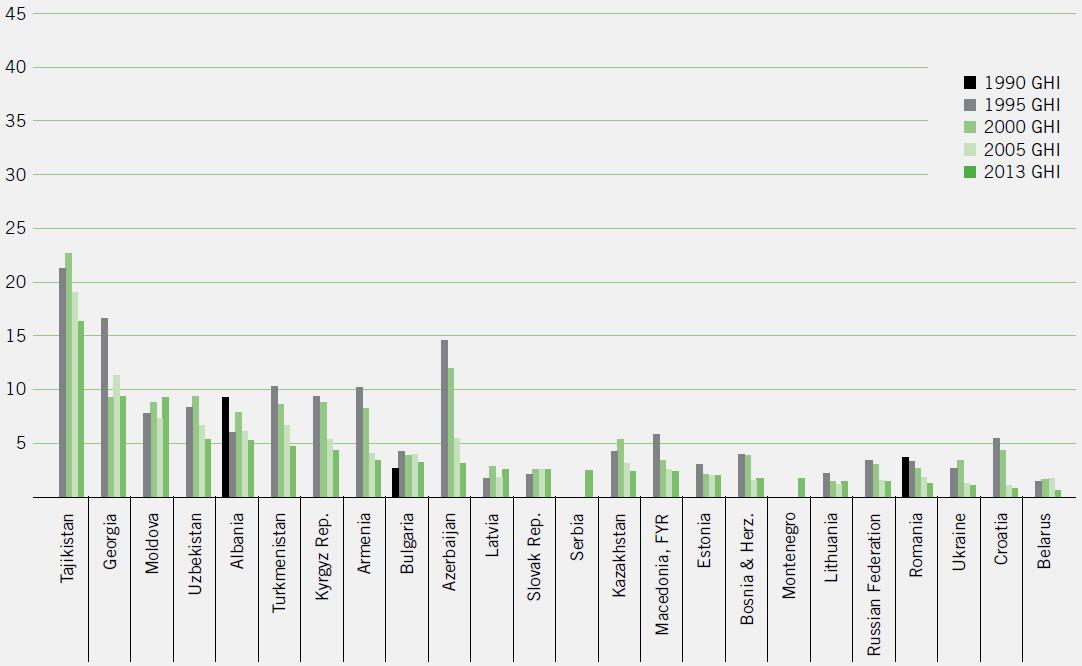
C Country Trends for the 1990, 1995, 2000, 2005, and 2013 Global Hunger Index Scores
The 2013 Global Hunger Index (GHI), which reflects data from the period 2008-2012, shows that global hunger has improved since 1990, falling by one-third. Despite the progress made, the level of hunger in the world remains "serious," with 870 million people going hungry, according to estimates by the Food and Agriculture Organization of the United Nations.
Across regions and countries, GHI scores vary considerably. South Asia and Africa south of the Sahara are home to the highest GHI scores. South Asia significantly lowered its GHI score between 1990 and 1995, mainly thanks to a large decline in underweight in children, but was not able to maintain its fast progress. Social inequality and the low nutritional, educational, and social status of women continue to contribute to the high prevalence of underweight in children under five.
Africa south of the Sahara did not advance as much as South Asia in the 1990s. Since the turn of the millennium, however, Africa south of the Sahara has shown real progress, and its GHI score is now lower than South Asia's. More political stability in countries earlier affected by civil wars in the 1990s and 2000s meant economic growth could resume. Advances in the fight against HIV and AIDS, a decrease in the prevalence of malaria, and higher immunization rates contributed to a reduction in child mortality.
Since 1990, 23 countries made significant progress, reducing their GHI scores by 50 percent or more. Twenty-seven countries moved out of the "extremely alarming" and "alarming" categories. In terms of absolute progress, the top ten countries in terms of improvements in GHI scores since 1990 were Angola, Bangladesh, Cambodia, Ethiopia, Ghana, Malawi, Niger, Rwanda, Thailand, and Vietnam.
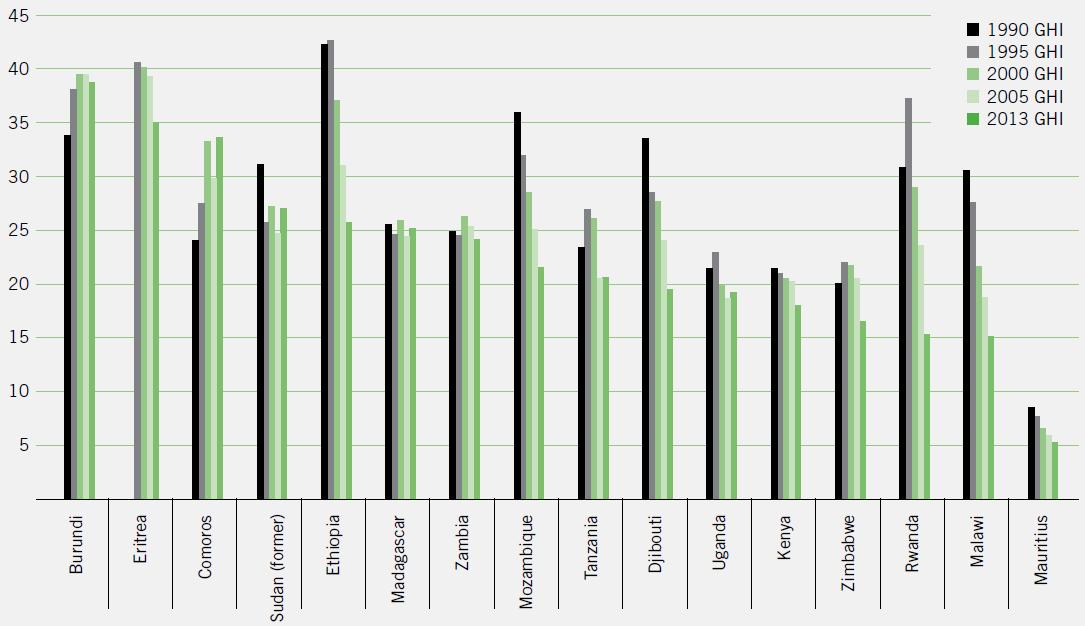
Levels of hunger are still "alarming" or "extremely alarming" in 19 countries. Those that fell into the "extremely alarming" category-- Burundi, Comoros, and Eritrea--are all in Africa south of the Sahara. Increased hunger since 1990 in Burundi and Comoros can be attributed to prolonged conflict and political instability. The Democratic Republic of Congo was listed as "extremely alarming" in the 2011 Global Hunger Index report, but since then, not enough data have been available to calculate its GHI score. Current and reliable data are urgently needed to assess the country's situation and to calculate the GHI scores of other likely hunger hot spots, such as Afghanistan and Somalia.
It is not surprising that many of the countries with "alarming" or "extremely alarming" scores have not been among the most stable. Higher GHI scores tend to be typical of countries that experience social or political unrest or are perennially exposed to shocks such as floods and droughts. Natural and manmade disasters can directly affect the food and nutrition security of people and communities that are particularly vulnerable or lacking resilience. By extension, a critical part of building resilience is ensuring food and nutrition security; and conversely, efforts to build food and nutrition security must be designed with a resilience lens.
Poor people have long been vulnerable to "hunger seasons," droughts, and other natural and manmade disasters. In recent years, this vulnerability has been exacerbated by food and financial crises and large-scale humanitarian crises such as the recurring droughts in the Sahel and the Horn of Africa. These short-term shocks have long-term consequences.
Policymakers and practitioners across the development and relief communities now recognize the need to build the resilience of vulnerable populations. More resilience will help them climb out of poverty, remain out of poverty, or avoid slipping into it in the first place. Conceptually, resilience has been expanded to include the capacity not only to absorb mild shocks, but also to learn from and adapt to moderate shocks and to transform economic, social, and ecological structures in response to severe shocks.
This framework for understanding resilience could help expand the dialogue between the relief and development sectors, which have traditionally operated in separate silos. Linking interrelated short-term shocks and long-term systemic change provides a more complete view of the factors that lead people to drift into poverty or food and nutrition insecurity. The resilience framework also focuses more attention on understanding the welfare and behavioral dynamics of vulnerable populations. It reaffirms the importance of identifying and strengthening local structures and organizations and supporting them to perform their roles effectively and to work together.
Yet, while the underlying rationale for focusing on resilience building is strong, adopting a resilience framework is challenging. Experts in development and humanitarian circles have yet to agree on a common definition of resilience. And resilience, vulnerability, and coping behaviors are difficult phenomena to measure. Shocks are by definition often short-term unpredictable events, they often occur in remote places and populations, and resilience to shocks involves complex coping or adaptive behaviors.
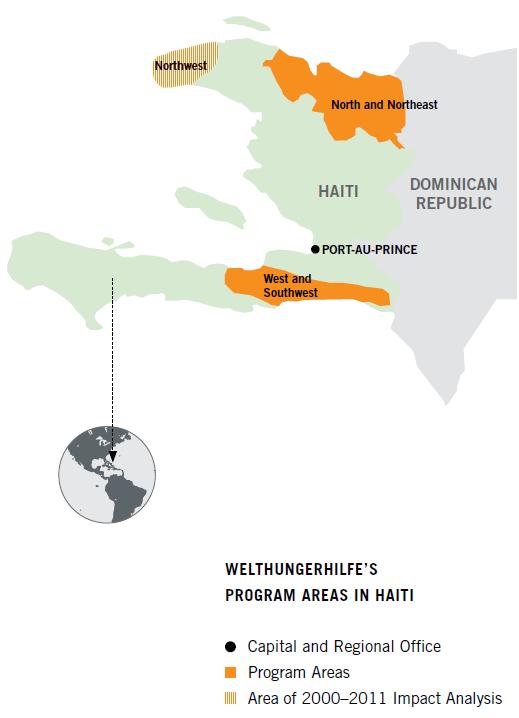
According to Concern and Welthungerhilfe, resilience-building efforts at the community level can deliver results. They describe lessons learned from their own programs fighting undernutrition in mostly rural communities. Despite continuing shocks and stresses and a system that is set up to favor large-scale farmers and not smallholders, households in Haiti's North-West region managed to improve their food security by continuously addressing the underlying structural causes of vulnerability and using flexible, accurately targeted emergency funding to address capacity gaps. Lessons from the Sahel and the Horn of Africa point to some of the necessary preconditions for building resilience at the community level and helping people escape extreme poverty and hunger.
The policy recommendations in this report offer a path forward for the international development, humanitarian, and donor communities; for country-level policymakers in food-insecure countries; and for development and humanitarian practitioners.
THE CONCEPT OF THE GLOBAL HUNGER INDEX
The Global Hunger Index (GHI) is a tool designed to comprehensively measure and track hunger globally and by region and country. |1| Calculated each year by the International Food Policy Research Institute (IFPRI), the GHI highlights successes and failures in hunger reduction and provides insights into the drivers of hunger, and food and nutrition insecurity. By raising awareness and understanding of regional and country differences, the GHI, it is hoped, will trigger actions to reduce hunger.
A number of different indicators can be used to measure hunger (Box 1.1). To reflect the multidimensional nature of hunger, the GHI combines three equally weighted indicators into one index:
1. Undernourishment: the proportion of undernourished people as a percentage of the population (reflecting the share of the population with insufficient caloric intake)
2. Child underweight: the proportion of children younger than age five who are underweight (that is, have low weight for their age, reflecting wasting, stunted growth, or both), which is one indicator of child undernutrition
3. Child mortality: the mortality rate of children younger than age five (partially reflecting the fatal synergy of inadequate food intake and unhealthy environments). |2|
BOX 1.1 CONCEPTS OF HUNGER The terminology used to refer to different concepts of hunger can be confusing. "Hunger" is usually understood to refer to the discomfort associated with lack of food. FAO defines food deprivation, or "undernourishment," as the consumption of fewer than about 1,800 kilocalories a day--the minimum that most people require to live a healthy and productive life.* "Undernutrition" goes beyond calories and signifies deficiencies in any or all of the following: energy, protein, or essential vitamins and minerals. Undernutrition is the result of inadequate intake of food--in terms of either quantity or quality-- poor utilization of nutrients due to infections or other illnesses, or a combination of these factors; these in turn are caused by household food insecurity; inadequate maternal health or child care practices; or inadequate access to health services, safe water, and sanitation.
"Malnutrition" refers more broadly to both undernutrition (problems of deficiencies) and overnutrition (problems of unbalanced diets, such as consumption of too many calories in relation to requirements with or without low intake of micronutrient-rich foods). In this report, "hunger" refers to the index based on the three component indicators described on this page.
* FAO considers the composition of a population by age and sex to calculate its average minimum energy requirement, which varies by country (from about 1,650 to more than 2,000 kilocalories per person per day for 2010-2012 according to FAO 2013a). The country's average minimum energy requirement is used to estimate undernourishment (FAO 2012).
This multidimensional approach to measuring hunger offers several advantages. It reflects the nutrition situation not only of the population as a whole, but also of a physiologically vulnerable group--children-- for whom a lack of nutrients leads to a high risk of illness, poor physical and cognitive development, or death. In addition, combining independently measured indicators reduces the effects of random measurement errors. |3|
The 2013 GHI has been calculated for 120 countries for which data on the three component indicators are available and for which measuring hunger is considered most relevant. The GHI calculation excludes some higher-income countries because the prevalence of hunger there is very low.
The GHI is only as current as the data for its three component indicators. This year's GHI reflects the most recent available country-level data for the three component indicators spanning the period 2008 to 2012. It is thus a snapshot not of the present, but of the recent past. For some countries, such as Afghanistan, the Democratic Republic of Congo, Iraq, Myanmar, Papua New Guinea, and Somalia, lack of data on undernourishment prevents the calculation of GHI scores. |4|
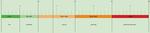
BOX 1.2 HOW GHI SCORES ARE CALCULATED A country's GHI score is calculated by averaging the percentage of 0 the population that is undernourished, the percentage of children younger than five years old who are underweight, and the percentage of children dying before the age of five. This calculation results in a 100-point scale on which zero is the best score (no hunger) and 100 the worst, although neither of these extremes is reached in practice. A value of 100 would be reached only if all children died before their fifth birthday, the whole population was undernourished, and all children younger than five were underweight. A value of zero would mean that a country had no undernourished people in the population, no children younger than five who were underweight, and no children who died before their fifth birthday. The scale at the right shows the severity of hunger--from "low" to "extremely alarming"--associated with the range of possible GHI scores.
Click on image to enlargeThe GHI scores are based on source data that are continually revised by the United Nations agencies responsible for their compilation, and each year's GHI report reflects these revisions. While these revisions result in improvements in the data, they also mean that the GHI scores from different years' reports are not comparable with one another. This year's report contains GHI scores for four other reference periods--1990, 1995, 2000, and 2005--besides the most recent GHI, and so expands the scope of the trend analyses in comparison with previous reports.
The 1990, 1995, 2000, 2005, and 2013 GHI scores presented in this report reflect the latest revised data for the three component indicators of the GHI. |5| Where original source data were not available, estimates for the GHI component indicators were used that are based on the most recent data available. (See Appendix A for more detailed background information on the data sources for and calculations of the 1990, 1995, 2000, 2005, and 2013 GHI scores.)
The three component indicators used to calculate the GHI scores in this report draw upon data from the following sources:
1. Undernourishment: Updated data from the Food and Agriculture Organization of the United Nations (FAO) were used for the 1990, 1995, 2000, and 2005, and 2013 GHI scores. Undernourishment data for the 2013 GHI are for 2010-2012 (FAO 2013a; authors' estimates). In order to provide more timely data that integrate all relevant information, the FAO has revised its methodology for estimating undernourishment. Its estimates now consider findings from a much larger number of household surveys that have become available in recent years and, for the first time, estimates of food losses at the retail level (FAO 2012).
2. Child underweight: The "child underweight" component indicator of the GHI scores in this report includes the latest additions to the World Health Organization's (WHO) Global Database on Child Growth and Malnutrition, and additional data from the joint database by the United Nations Children's Fund (UNICEF), WHO, and the World Bank; the most recent Demographic and Health Survey (DHS) and Multiple Indicator Cluster Survey reports; and statistical tables from UNICEF. For the 2013 GHI, data on child underweight are for the latest year for which data are available in the period 2008-2012 (WHO 2013; UNICEF/WHO/World Bank 2012; UNICEF 2013a, b; MEASURE DHS 2013; authors' estimates).
3. Child mortality: Updated data from the UN Inter-agency Group for Child Mortality Estimation were used for the 1990, 1995, 2000, and 2005, and 2013 GHI scores. For the 2013 GHI, data on child mortality are for 2011 (IGME 2012).
Despite the existence of abundant technological tools to collect and assess data almost instantaneously, time lags and data gaps persist in reporting vital statistics on hunger and undernutrition. While there have been some recent improvements, more up-to-date, reliable, and extensive country data continue to be urgently needed. Further improvements in collecting high-quality data on hunger will allow for a more complete and current assessment of the state of global hunger and, in turn, more effective steps to reduce hunger.
GLOBAL, REGIONAL, AND NATIONAL TRENDS
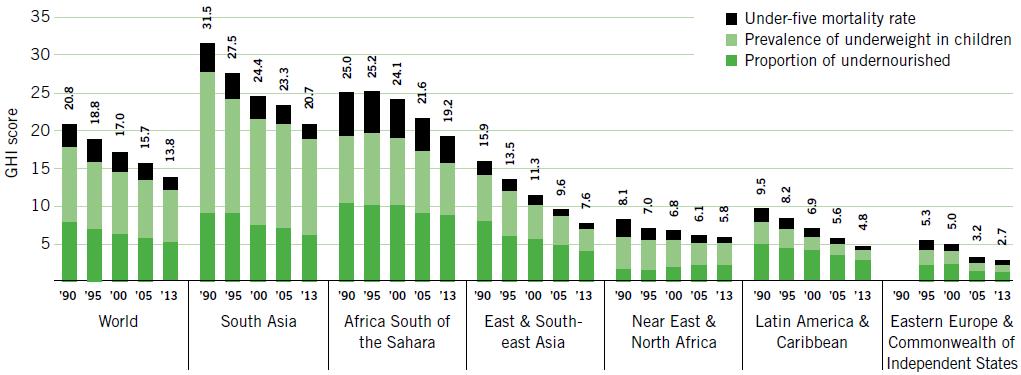
The number of the hungry in the world has remained unacceptably high: In 2010-2012, about 870 million people were chronically undernourished (FAO 2012). This sobering statistic is in no way diminished by FAO's improved undernourishment estimates released in 2012, which suggest that progress in reducing undernourishment was more marked than previously believed. |1| The GHI corroborates the positive trend of declining hunger: The 2013 world |2| GHI fell by close to 34 percent from the 1990 |3| world GHI, from a score of 20.8 to 13.8 (Figure 2.1).
The three indicators contributed differently to the decline of 7.0 points in the world GHI score since 1990. A decline in child underweight lowered the world GHI score by 3.0 points, whereas changes in the share of undernourished people in the population and the child mortality rate contributed reductions of 2.7 and 1.3 points, respectively.
Large Regional and National Differences
The world GHI declined most rapidly--by 2 points--between 1990 and 1995. Although progress slowed after 1995, it picked up again after 2005. Undernourishment and underweight in children improved most between 1990 |3| and 1995, whereas progress in reducing child mortality has accelerated since 1995. The 2013 world GHI, however, remains "serious."
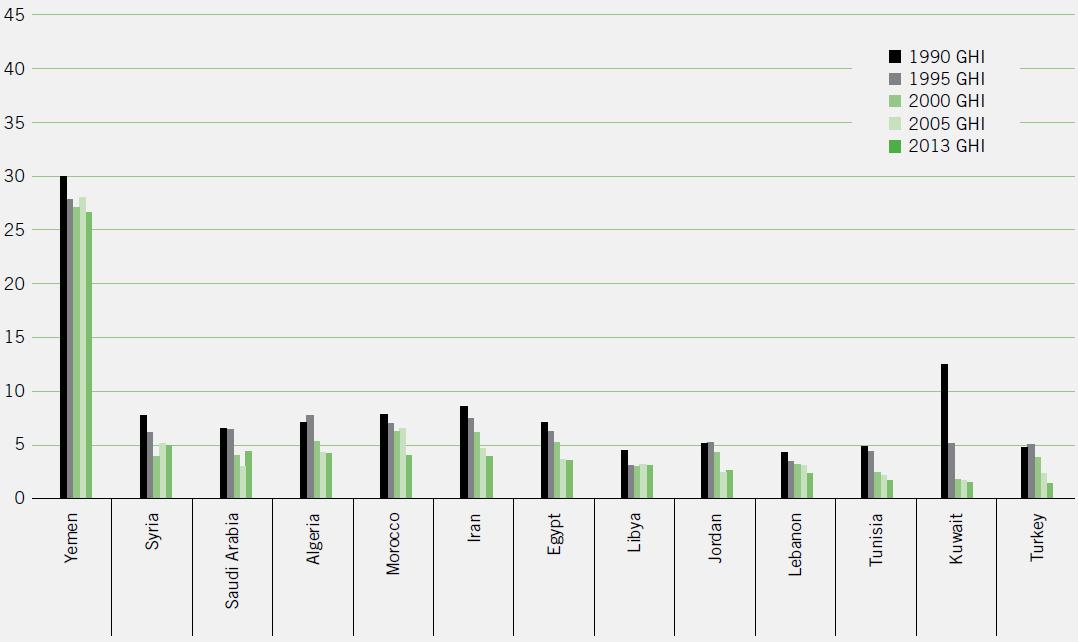
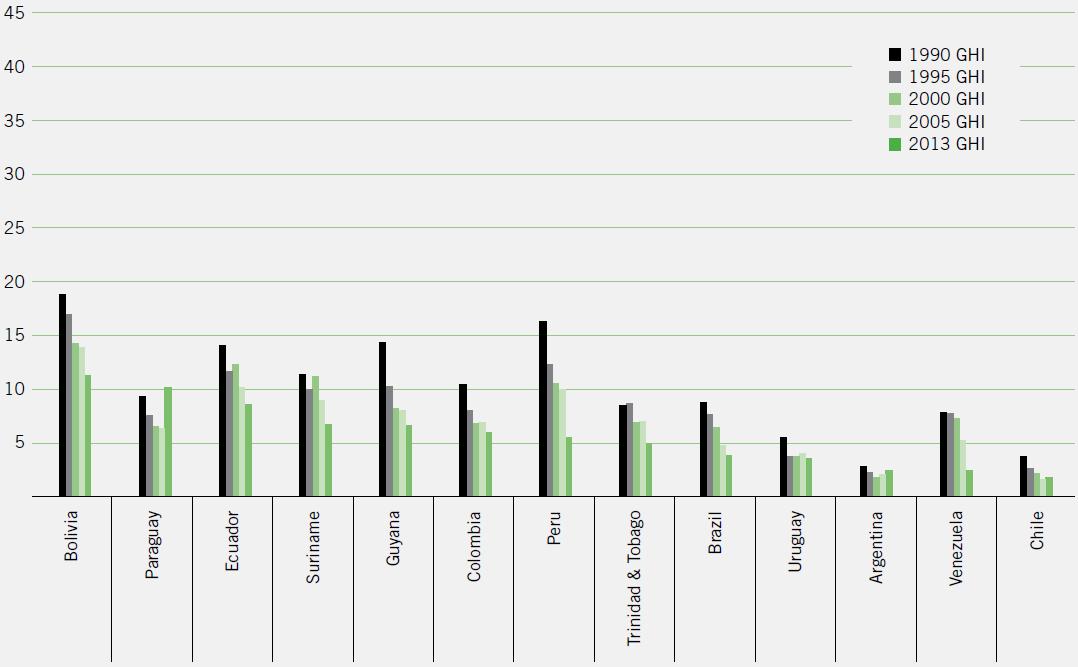
These global averages mask dramatic differences among regions and countries. Compared with the 1990 score, the 2013 GHI score is 23 percent lower in Africa south of the Sahara, 34 percent lower in South Asia, and 28 percent lower in the Near East and North Africa (Figure 2.1). Progress in East and Southeast Asia and Latin America and the Caribbean was even more remarkable, with the GHI scores falling by 52 percent and 50 percent respectively (although the 1990 score was already relatively low in the latter region). In Eastern Europe and the Commonwealth of Independent States, the 2013 GHI score is 48 percent lower than the 1995 score. |4|
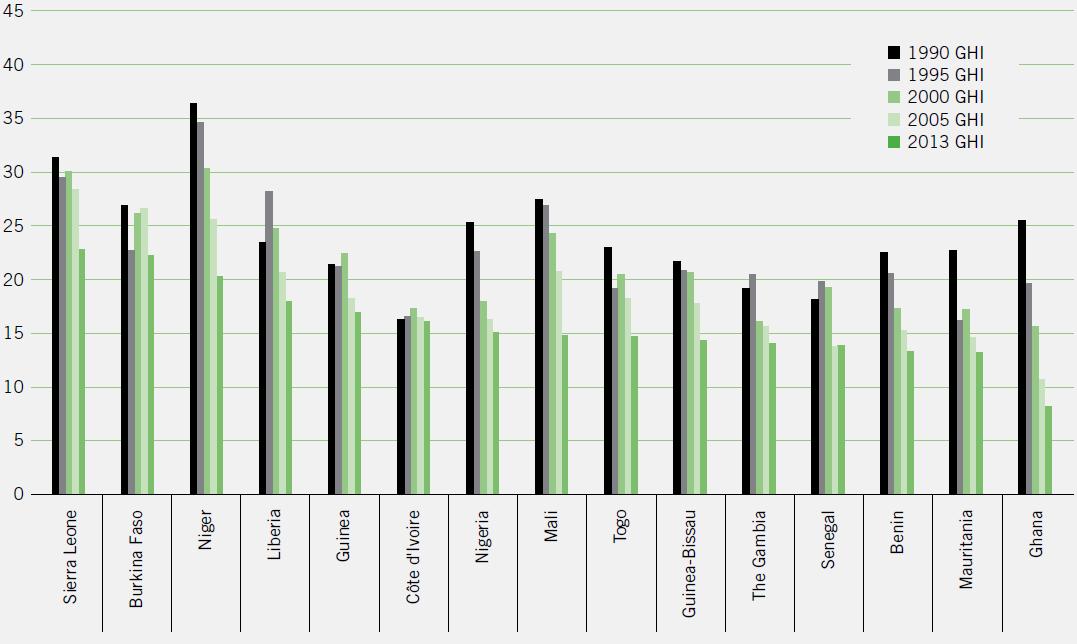
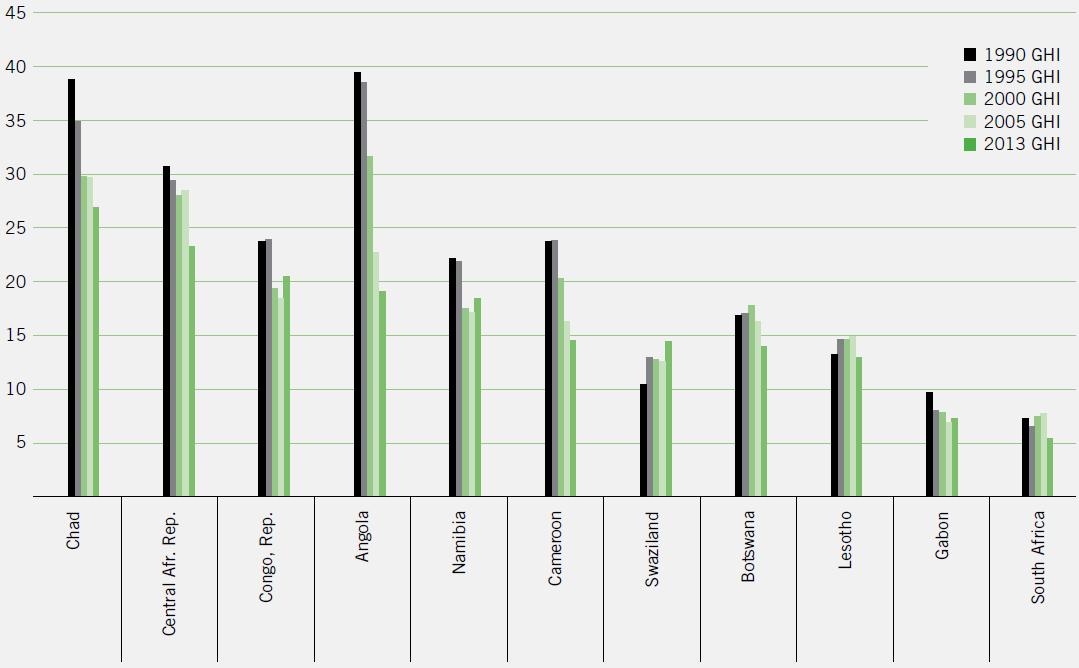
FIGURE 2.1 CONTRIBUTION OF COMPONENTS TO 1990, 1995, 2000, 2005, AND 2013 GLOBAL HUNGER INDEX SCORES, BY REGION
Click on image to enlargeNote: For the 1990 GHI, data on the proportion of undernourished are for 1990-1992; data on child underweight are for the year closest to 1990 in the period 1988-1992 for which data are available; and data on child mortality are for 1990. For the 1995 GHI, data on the proportion of undernourished are for 1994-1996; data on child underweight are for the year closest to 1995 in the period 1993-1997 for which data are available; and data on child mortality are for 1995. For the 2000 GHI, data on the proportion of undernourished are for 1999-2001; data on child underweight are for the year closest to 2000 in the period 1998-2002 for which data are available; and data on child mortality are for 2000. For the 2005 GHI, data on the proportion of undernourished are for 2004-2006; data on child underweight are for the year closest to 2005 in the period 2003-2007 for which data are available; and data on child mortality are for 2005. For the 2013 GHI, data on the proportion of undernourished are for 2010-2012, data on child underweight are for the latest year in the period 2008-2012 for which data are available, and data on child mortality are for 2011.
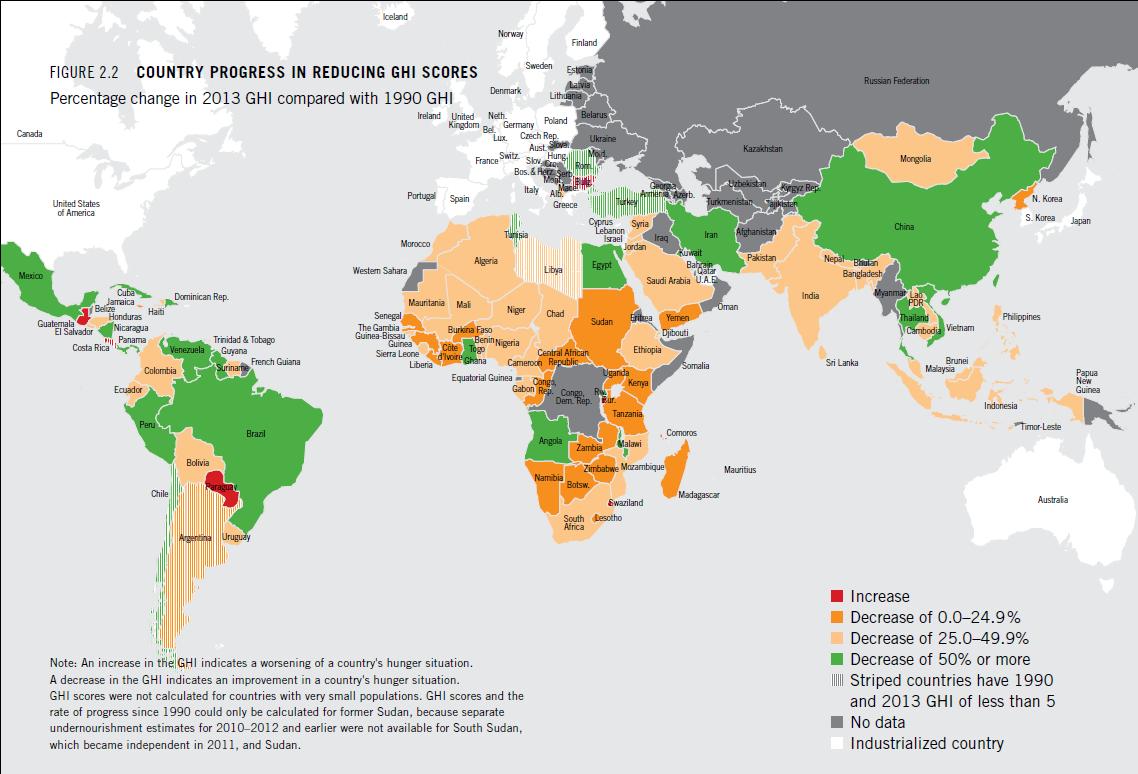
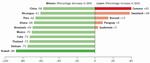
FIGURE 2.2 COUNTRY PROGRESS IN REDUCING GHI SCORES
Percentage change in 2013 GHI compared with 1990 GHI
Click on image to enlargeNote: An increase in the GHI indicates a worsening of a country's hunger situation. A decrease in the GHI indicates an improvement in a country's hunger situation. GHI scores were not calculated for countries with very small populations. GHI scores and the rate of progress since 1990 could only be calculated for former Sudan, because separate undernourishment estimates for 2010-2012 and earlier were not available for South Sudan, which became independent in 2011, and Sudan.
East and Southeast Asia and Latin America and the Caribbean have experienced a fairly consistent drop in GHI scores since 1990. In the Near East and North Africa, the GHI scores barely declined between 1995 and 2000 and after 2005, and reductions in other periods were small. In South Asia and Africa south of the Sahara--the two regions with the highest GHI scores, at 20.7 and 19.2 respectively--the rates of progress have also been uneven.
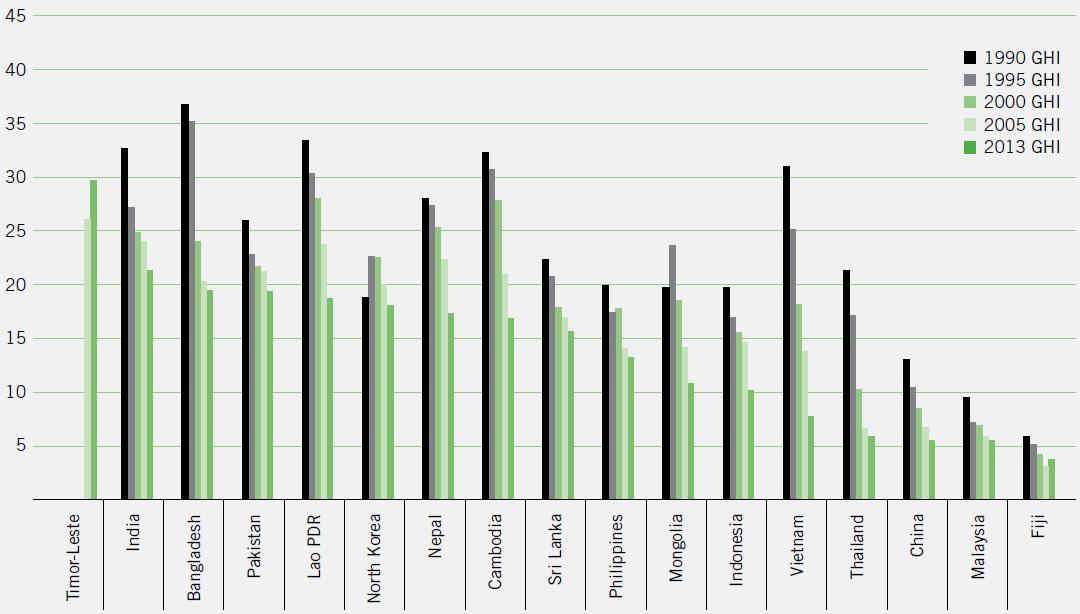
Among the regions, South Asia has the highest 2013 GHI score, although it witnessed the steepest absolute decline in GHI scores since 1990, amounting to almost 11 points. South Asia reduced its GHI score by 4 points between 1990 and 1995--mainly through a 10-percentage-point decline in underweight in children--but this rapid progress did not persist. In the following five-year periods and after 2005, the decrease in GHI scores slowed down to 1-3 points despite strong economic growth. Social inequality and the low nutritional, educational, and social status of women are major causes of child undernutrition in this region that have impeded improvements in the GHI score.
Though Africa south of the Sahara made less progress than South Asia in the 1990s, it has caught up since the turn of the millennium and surpassed it, with a 2013 GHI score that fell below that of South Asia. However South Asia's overall decline was greater, as Africa south of the Sahara began with a lower GHI score in 1990. The lat-ter's GHI score increased marginally between 1990 and 1995, fell slightly until 2000, and declined more markedly thereafter, by almost 5 points overall, until the period reflected in the 2013 GHI score. The large-scale civil wars of the 1990s and 2000s ended, and countries earlier beset by conflict became more politically stable. Economic growth resumed on the continent, and advances in the fight against HIV and AIDS contributed to a reduction in child mortality in the countries most affected by the epidemic.
Since 2000, mortality rates for children under age five have declined in Africa south of the Sahara. A key factor behind the improved rates seems to be the decrease in the prevalence of malaria, which coincided with the increased use of insecticide-treated bed nets and other antimalarial interventions (Demombynes and Trommlerova 2012). Other factors that may have helped cut mortality rates include higher immunization rates and a greater share of births in medical centers; improved antenatal care and access to clean water and sanitation facilities; and increasing levels of income, leading to better nutrition and access to medical care.
The situation in the Sahel, however, remains fragile in 2013 despite a good harvest. Recurrent crises in recent years--a combination of sporadic rainfall, locust infestation, crop shortages, and high and volatile food prices--have negatively affected food and nutrition security in the region, eroded the coping capacity of already vulnerable groups, and weakened their resilience to shocks. In addition, livestock--an important asset for pastoralists--have become vulnerable to diseases because of inadequate feeding. The conflict in northern Mali, growing insecurity in northern Nigeria, and migration pressure have exacerbated the situation. In Mali, thousands of people have fled their homes and at the time of writing are living in refugee camps or with host families in Mali and in neighboring countries (FAO 2013b).
Best and Worst Country-Level Results
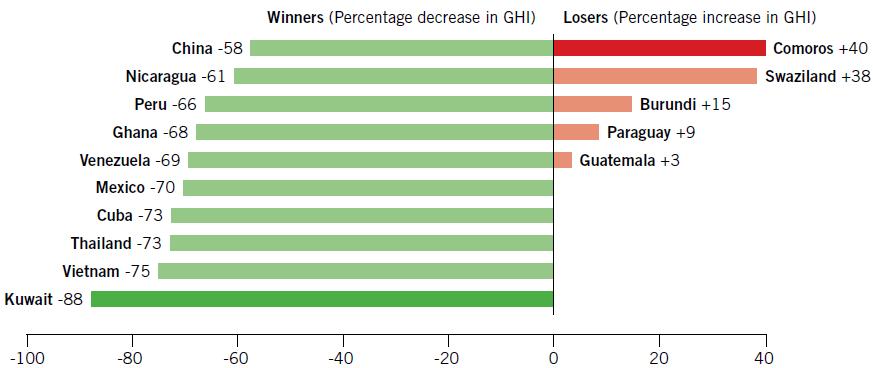
From the 1990 GHI to the 2013 GHI, 23 countries reduced their scores by 50 percent or more (Figure 2.2). Forty-six countries made modest progress. Their GHI scores dropped by between 25 and 49.9 percent, and 21 countries decreased their GHI scores by less than 25 percent. |5| In Africa south of the Sahara, only one country--Ghana--is among the 10 best performers in terms of improving its GHI score since 1990 (Figure 2.3). Kuwait's progress in reducing hunger is due mainly to its unusually high score in 1990, when Iraq invaded the country: Its GHI score fell by more than 7 points (or 59 percent) by 1995, by 3.4 points between 1995 and 2000, and by only 0.2 points after 2000 (see country trends in Appendix C).
Vietnam has achieved impressive progress in reducing hunger since 1990 (see country trends in Appendix C). It reduced the proportion of undernourished from 47 percent to only 9 percent, lowered underweight in children from more than 40 percent around 1990 to 12 percent in 2011, and more than halved the under-five mortality rate. GDP per capita has more than tripled in Vietnam since 1990, and strong, broad-based economic growth translated into a decline in the proportion of people living on less than $1.25 a day from 64 percent in 1993 to 17 percent in 2008 (World Bank 2013b). The country put nutrition high on its agenda, effectively developed and implemented a plan for preventing protein-energy malnutrition among children, achieved high coverage of immunization and other primary healthcare services, granted targeted health subsidies to the poor, and successfully administered social security programs (von Braun, Ruel, and Gulati 2008; Huong and Nga 2013).
Another Southeast Asian country--Thailand--has also reduced its 1990 GHI by almost three-quarters. In the past two decades, Thailand experienced robust economic growth and reduced poverty (World Bank 2013b) despite transient setbacks related to the Asian financial crisis. As early as the 1980s, the government showed a strong commitment to fighting child undernutrition by integrating nutrition into its National Economic and Social Development Plan and implementing successful community-driven nutrition programs (Tontisirin and Winichagoon 1999).
In five countries, GHI scores have risen since 1990. The three worst performers are located in Africa south of the Sahara. Increased hunger since 1990 in Burundi and Comoros can be attributed to prolonged conflict and political instability. In Comoros, the GHI score fell after peaking in 2000, but has climbed up again since 2005. Between 1990 and 2000, Burundi's GHI score rose by almost 6 points and remained at a very high level, close to 40 until 2005. It has dipped only slightly since. With the transition to peace and political stability that started in 2003, the country began a slow recovery from decades of economic decline. However, its high level of undernourishment remains a serious issue. The proportion of undernourished people has continued to rise since 1990. The prevalence of child underweight has declined since 2000, but it remains one of the highest in Africa. Burundi's child mortality rate has been improving, mainly since 1995 (see the table with underlying data in Appendix B).
FIGURE 2.3 GHI WINNERS AND LOSERS FROM 1990 GHI TO 2013 GHI
Click on image to enlargeNote: Countries with both 1990 and 2013 GHI scores of less than 5 are excluded.
In Swaziland, the HIV and AIDS epidemic, along with high income inequality, has severely undermined food security despite growth in national income. Swaziland's adult HIV prevalence in 2011 was estimated at 26 percent--the highest in the world (UNAIDS 2012). The country's GHI score worsened until 1995, then declined slightly until 2005, but has increased again since then. Swaziland and several other African countries have made great strides in preventing mother-to-child transmission of HIV, and child mortality rates have dropped after peaking around 2005 (UNAIDS 2010; IGME 2012). However, the proportion of people who are undernourished increased dramatically in Swaziland after 2004-2006 (FAO 2013a). Because of drought, more than one-quarter of the population depended on emergency food aid in 2006-2007, and the country's GDP per capita declined between 2007 and 2010 (CIA 2013; World Bank 2013b). High unemployment, overgrazing, soil depletion, and the risk of future droughts and floods pose persistent challenges (CIA 2013).
Some countries achieved noteworthy absolute progress in improving their GHI scores. Comparing the 1990 GHI and the 2013 GHI, Angola, Bangladesh, Cambodia, Ethiopia, Ghana, Malawi, Niger, Rwanda, Thailand, and Vietnam saw the largest improvements--with decreases in their scores ranging between 15 and 23 points (Table 2.1).
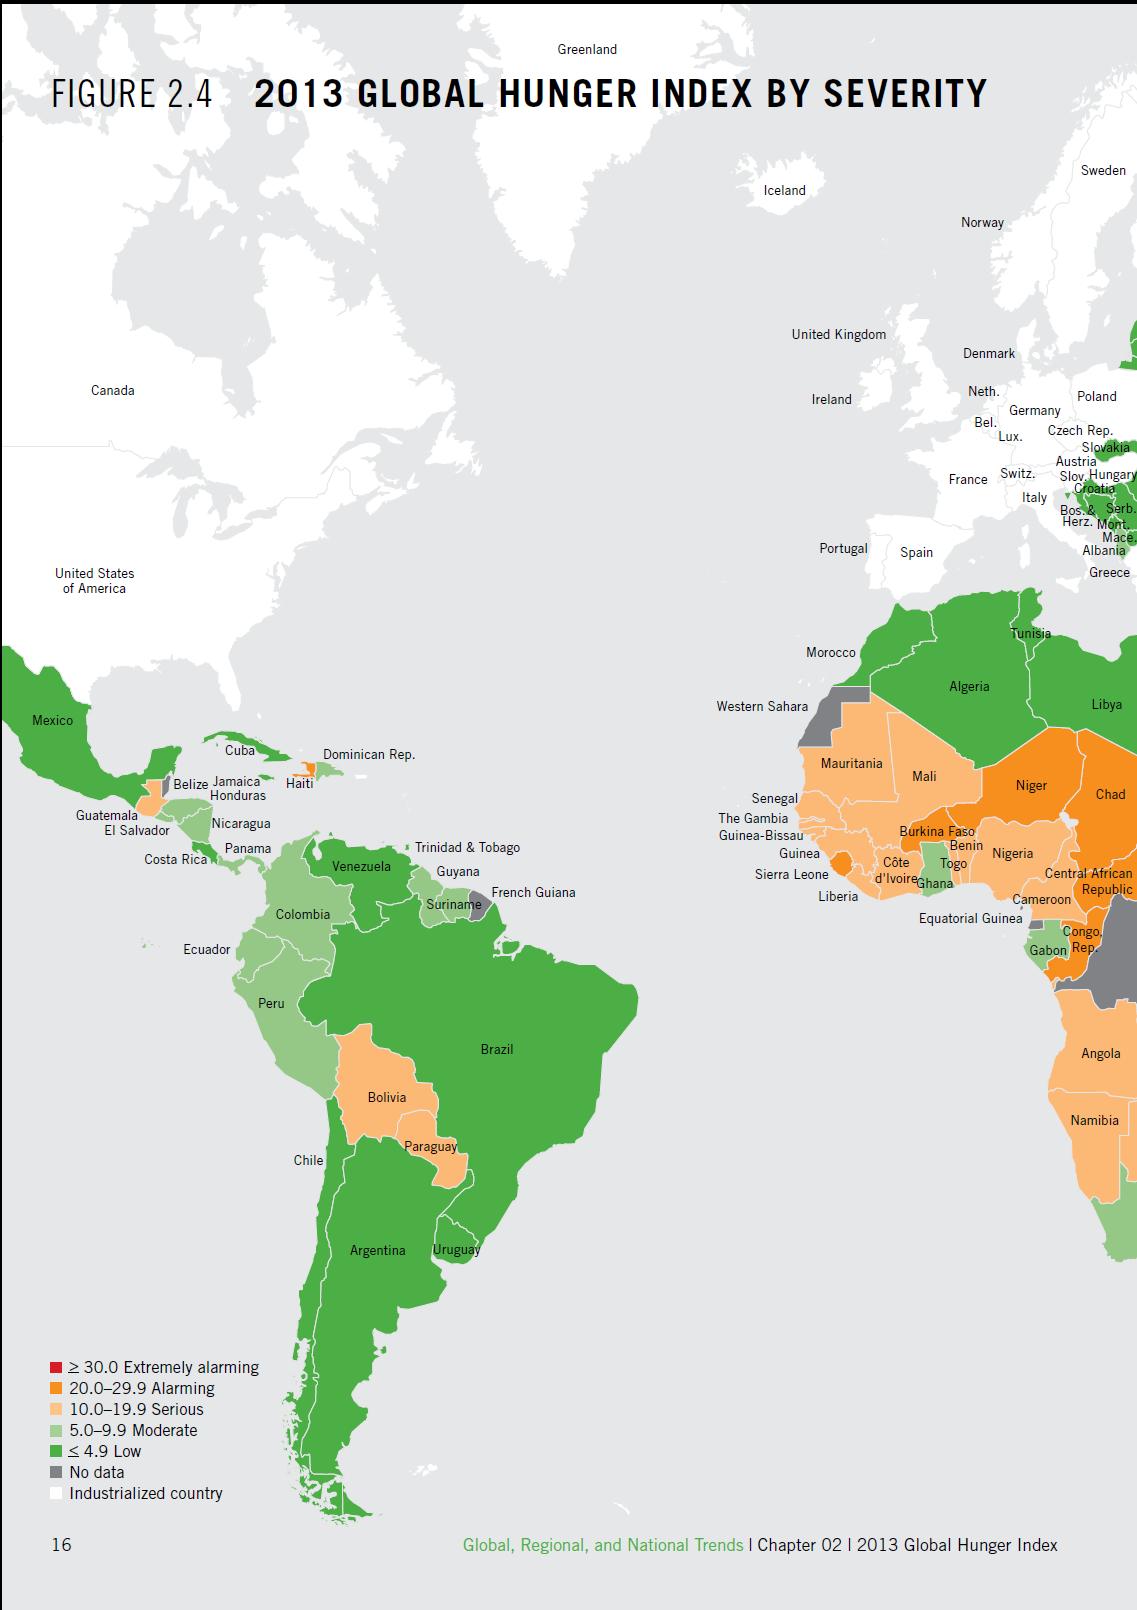
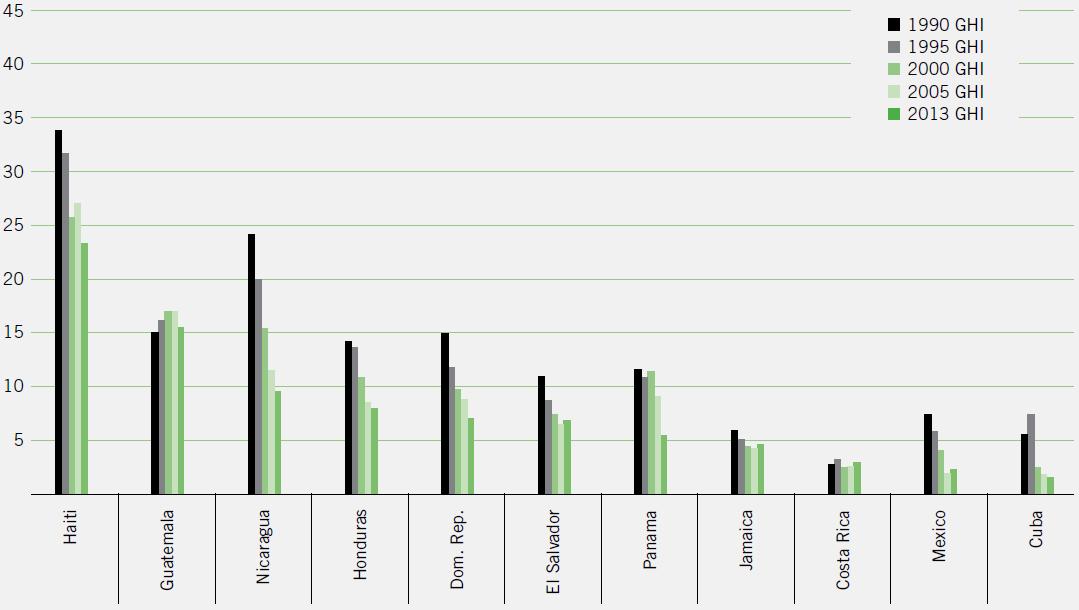
Nineteen countries still have levels of hunger that are "extremely alarming" or "alarming" (Figure 2.4). Most of the countries with alarming GHI scores are in Africa south of the Sahara. The only exceptions are Haiti, India, Timor-Leste, and Yemen. The three countries with extremely alarming 2013 GHI scores--Burundi, Comoros, and Eritrea-- are in Africa south of the Sahara.
Haiti's 1990 GHI score of 33.8 placed the country in the "extremely alarming" category. The country's GHI score declined by 8 points up to 2000, then slightly increased again around 2005, and fell further while Haiti recovered from the devastating earthquake that shook the country in 2010. As a result of overall positive development, Haiti's 2013 GHI score of 23.3 was more than one-quarter lower than its 1990 score, although it is still considered "alarming." Haiti's 2010 under-five mortality rate more than doubled from its 2009 rate because of the earthquake and its aftermath, but it fell below pre-disaster levels in 2011 (IGME 2012). FAO's most recent estimates indicate that 45 percent of Haitians were undernourished in 2010-2012. The data show that although undernourishment in Haiti is still high, it has fallen by almost one-third since 1990 (FAO 2013a). Underweight in children also improved significantly during this period.
The Democratic Republic of Congo, with a population of more than 60 million (UN 2013c), still appears as a grey area on the map because reliable data on undernourishment are lacking and the level of hunger cannot be assessed. It remains unclear if the GHI score in this country would be classified as "extremely alarming," as in previous editions of this report up to 2011, because data are not available. High-quality data for the Democratic Republic of Congo, as for other likely hunger hot spots such as Afghanistan and Somalia, are badly needed.
In terms of the GHI components, Burundi, Comoros, and Eritrea currently have the highest proportion of undernourished people--more than 60 percent of the population. |6| India and Timor-Leste have the highest prevalence of underweight in children under five--more than 40 percent in both countries. Mali, Sierra Leone, and Somalia have the highest under-five mortality rate, ranging from approximately 18 to about 19 percent.
TABLE 2.1 COUNTRY GLOBAL HUNGER INDEX SCORES BY RANK, 1990 GHI, 1995 GHI, 2000 GHI, 2005 GHI, AND 2013 GHI
Rank Country 1990 1995 2000 2005 2013 1 Albania 9.2 6.0 7.8 6.1 5.2 1 Mauritius 8.5 7.6 6.5 5.9 5.2 3 Uzbekistan - 8.3 9.3 6.6 5.3 4 Panama 11.6 10.8 11.4 9.0 5.4 4 South Africa 7.2 6.5 7.4 7.7 5.4 6 China 13.0 10.4 8.4 6.7 5.5 6 Malaysia 9.5 7.1 6.9 5.8 5.5 6 Peru 16.3 12.3 10.5 9.9 5.5 9 Thailand 21.3 17.1 10.2 6.6 5.8 10 Colombia 10.4 8.0 6.8 6.9 5.9 11 Guyana 14.3 10.2 8.2 8.0 6.6 12 Suriname 11.3 9.9 11.1 8.9 6.7 13 El Salvador 10.9 8.7 7.4 6.4 6.8 14 Dominican Republic 14.9 11.7 9.7 8.8 7.0 15 Gabon 9.7 8.0 7.8 6.9 7.2 16 Vietnam 30.9 25.1 18.1 13.7 7.7 17 Honduras 14.2 13.6 10.8 8.5 7.9 18 Ghana 25.5 19.6 15.6 10.7 8.2 19 Ecuador 14.0 11.6 12.3 10.1 8.5 20 Moldova - 7.7 8.8 7.3 9.2 21 Georgia - 16.6 9.2 11.3 9.3 22 Nicaragua 24.1 19.9 15.4 11.5 9.5 23 Indonesia 19.7 16.9 15.5 14.6 10.1 23 Paraguay 9.3 7.5 6.5 6.3 10.1 25 Mongolia 19.7 23.6 18.5 14.1 10.1 26 Bolivia 18.8 16.9 14.2 13.8 11.2 27 Lesotho 13.2 14.6 14.6 14.9 12.9 28 Mauritania 22.7 16.2 17.2 14.6 13.2 28 Philippines 19.9 17.4 17.7 14.0 13.2 30 Benin 22.5 20.5 17.3 15.2 13.3 31 Senegal 18.1 19.8 19.2 13.7 13.8 32 Botswana 16.8 17.0 17.8 16.3 13.9 33 Gambia, The 19.1 20.4 16.1 15.6 14.0 34 Guinea-Bissau 21.7 20.8 20.6 17.7 14.3 35 Swaziland 10.4 12.9 12.7 12.5 14.4 36 Cameroon 23.7 23.8 20.3 16.3 14.5 37 Togo 23.0 19.1 20.4 18.2 14.7 38 Mali 27.4 26.9 24.3 20.7 14.8 39 Nigeria 25.3 22.6 17.9 16.3 15.0 40 Malawi 30.6 27.6 21.6 18.7 15.1 41 Rwanda 30.8 37.3 29.0 23.6 15.3 42 Guatemala 15.0 16.1 17.0 17.0 15.5 43 Sri Lanka 22.3 20.7 17.8 16.9 15.6 44 Côte d'Ivoire 16.3 16.5 17.3 16.4 16.1 45 Tajikistan - 21.2 22.6 19.0 16.3 46 Zimbabwe 20.0 22.0 21.7 20.5 16.5 47 Cambodia 32.2 30.7 27.8 20.9 16.8 48 Guinea 21.4 21.2 22.4 18.2 16.9 49 Nepal 28.0 27.3 25.3 22.3 17.3 50 Liberia 23.4 28.2 24.7 20.6 17.9 51 Kenya 21.4 21.0 20.5 20.2 18.0 51 North Korea 18.8 22.6 22.5 20.0 18.0 53 Namibia 22.1 21.9 17.5 17.1 18.4 54 Lao PDR 33.4 30.3 28.0 23.7 18.7 55 Angola 39.5 38.5 31.6 22.7 19.1 56 Uganda 21.4 22.9 19.9 18.6 19.2 57 Pakistan 25.9 22.8 21.6 21.2 19.3 58 Bangladesh 36.7 35.1 24.0 20.2 19.4 59 Djibouti 33.5 28.5 27.7 24.0 19.5 60 Niger 36.4 34.6 30.3 25.6 20.3 61 Congo, Rep. 23.7 23.9 19.3 18.4 20.5 62 Tanzania 23.4 26.9 26.1 20.5 20.6 63 India 32.6 27.1 24.8 24.0 21.3 64 Mozambique 36.0 32.0 28.5 25.1 21.5 65 Burkina Faso 26.9 22.7 26.1 26.6 22.2 66 Sierra Leone 31.3 29.5 30.0 28.4 22.8 67 Central African Rep. 30.7 29.4 28.0 28.5 23.3 67 Haiti 33.8 31.7 25.7 27.0 23.3 69 Zambia 24.9 24.5 26.3 25.3 24.1 70 Madagascar 25.5 24.6 25.9 24.4 25.2 71 Ethiopia 42.3 42.7 37.1 31.0 25.7 72 Yemen, Rep. 29.8 27.7 26.9 27.9 26.5 73 Chad 38.8 34.9 29.8 29.7 26.9 74 Sudan (former) 31.1 25.7 27.2 24.7 27.0 75 Timor-Leste - - - 26.0 29.6 76 Comoros 24.0 27.5 33.3 29.8 33.6 77 Eritrea - 40.6 40.2 39.3 35.0 78 Burundi 33.8 38.1 39.5 39.5 38.8 COUNTRIES WITH 2013 GHI SCORES LESS THAN 5
Country '90 '95 '00 '05 '13 Algeria 7 7.7 5.3 <5 <5 Argentina <5 <5 <5 <5 <5 Armenia - 10.2 8.2 <5 <5 Azerbaijan - 14.5 11.9 5.4 <5 Belarus - <5 <5 <5 <5 Bosnia&Herzegovina - <5 <5 <5 <5 Brazil 8.7 7.6 6.4 <5 <5 Bulgaria <5 <5 <5 <5 <5 Chile <5 <5 <5 <5 <5 Costa Rica <5 <5 <5 <5 <5 Croatia - 5.4 <5 <5 <5 Cuba 5.5 7.4 <5 <5 <5 Egypt, Arab Rep. 7 6.2 5.2 <5 <5 Estonia - <5 <5 <5 <5 Fiji 5.8 5.1 <5 <5 <5 Iran, Islamic Rep. 8.5 7.4 6.1 <5 <5 Jamaica 5.9 5 <5 <5 <5 Jordan 5.1 5.2 <5 <5 <5 Kazakhstan - <5 5.3 <5 <5 Kuwait 12.4 5.1 <5 <5 <5 Kyrgyz Republic - 9.3 8.8 5.3 <5 Latvia - <5 <5 <5 <5 Lebanon <5 <5 <5 <5 <5 Libya <5 <5 <5 <5 <5 Lithuania - <5 <5 <5 <5 Macedonia, FYR - 5.8 <5 <5 <5 Mexico 7.4 5.8 <5 <5 <5 Montenegro - - - - <5 Morocco 7.8 6.9 6.2 6.5 <5 Romania <5 <5 <5 <5 <5 Russian Fed. - <5 <5 <5 <5 Saudi Arabia 6.5 6.4 <5 <5 <5 Serbia - - - - <5 Slovak Rep. - <5 <5 <5 <5 Syrian Arab Rep. 7.7 6.1 <5 5.1 <5 Trinidad&Tobago 8.4 8.6 6.9 7.0 <5 Tunisia <5 <5 <5 <5 <5 Turkey <5 5.0 <5 <5 <5 Turkmenistan - 10.3 8.6 6.6 <5 Ukraine - <5 <5 <5 <5 Uruguay 5.5 <5 <5 <5 <5 Venezuela, RB 7.8 7.7 7.2 5.2 <5 Note: Ranked according to 2013 GHI scores. Countries with a 2013 GHI score of less than 5 are not included in the ranking, and differences between their scores are minimal. Countries that have identical 2013 GHI scores are given the same ranking (for example, Albania and Mauritius both rank first). The following countries could not be included because of lack of data: Afghanistan, Bahrain, Bhutan, Democratic Republic of Congo, Iraq, Myanmar, Oman, Papua New Guinea, Qatar, and Somalia.
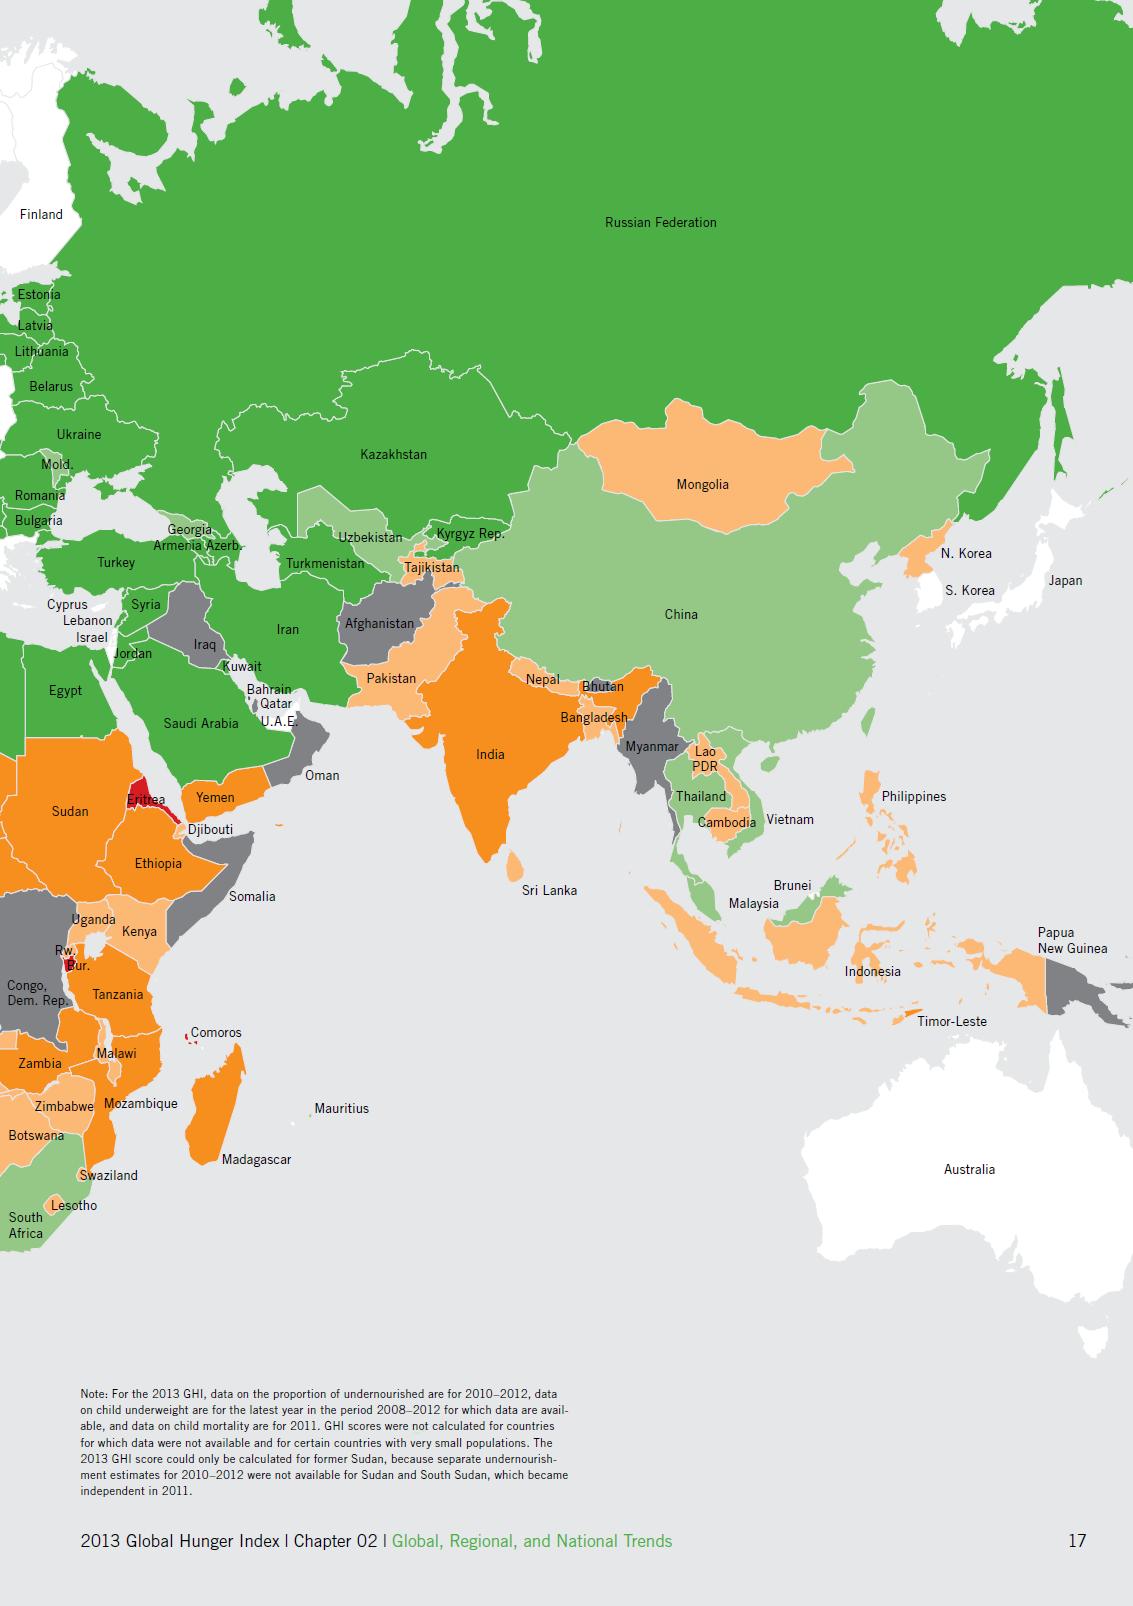
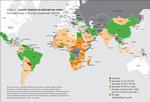
FIGURE 2.4 2013 GLOBAL HUNGER INDEX BY SEVERITY
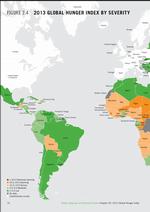
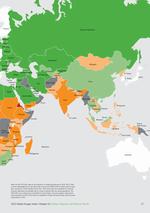
Click on images to enlargeNote: For the 2013 GHI, data on the proportion of undernourished are for 2010-2012, data on child underweight are for the latest year in the period 2008-2012 for which data are available, and data on child mortality are for 2011. GHI scores were not calculated for countries for which data were not available and for certain countries with very small populations. The 2013 GHI score could only be calculated for former Sudan, because separate undernourishment estimates for 2010-2012 were not available for Sudan and South Sudan, which became independent in 2011.
UNDERSTANDING RESILIENCE FOR FOOD AND NUTRITION SECURITY
Several decades ago, short-term shocks were only of peripheral concern to most development experts. Helping people survive natural disasters, like floods and droughts, or manmade ones like civil unrest, was considered the responsibility of humanitarian aid organizations. Conversely, humanitarian agencies have historically focused mainly on relief rather than on the kinds of longer-term development-oriented interventions that might reduce exposure or vulnerability to shocks.
Since then our understanding of the role of short-term shocks has evolved substantially. Even temporary shocks and stressors can have long-term consequences. A poor harvest that reduces a child's food intake, even temporarily, can have serious effects on her longer-term cognitive and physical development and therefore future earning capacity. A severe drought that leads a family to sell off its most productive assets, such as its land or livestock, can plunge that family into permanent poverty. It is therefore now widely recognized that a central reason why it is so difficult for poor people to escape poverty is their sheer inability to avoid or cope with shocks and stressors. Yet, at the same time, relief efforts, important though they are, do not typically address the underlying structural vulnerabilities of a population. Recognizing these realities, both the humanitarian and development communities have arrived at a common conclusion: Poor and vulnerable populations need greater resilience, and in order to achieve it, these communities need to work together.
A critical part of building resilience involves boosting food and nutrition security. Poor people have always been vulnerable to "hunger seasons," droughts, floods, and other natural and man-made disasters (Box 3.1). In recent years, this perennial vulnerability has been exacerbated by food price and financial crises, and large-scale humanitarian crises such as the recurring droughts and famines in the Sahel and the Horn of Africa. Several recent crises have even spurred the creation of large-scale programs that explicitly aim to build resilience, including the Global Alliance for Action for Drought Resilience and Growth in the Horn of Africa backed by USAID and the Global Alliance for Resilience in the Sahel (AGIR-Sahel) funded by the European Union (EU). Dozens of other international development projects are being created all over the world to strengthen people's resilience to shocks and improve their food and nutrition security.
While there is no consensus on the best ingredients for resilience or even its definition, the development and relief communities are clearly moving toward a loosely defined resilience framework that offers the potential for traditionally compartmentalized sectors to design and implement more effective and more integrated interventions. Nevertheless, this emerging resilience framework presents challenges--conceptually, empirically, and practically.
The Concept of Resilience
Resilience has roots in the Latin word resilio, meaning "to jump back" (Klein, Nicholls, and Thomalla 2003). Much of the resilience literature broadly defines the term as a return to an original state. In ecology, resilience has long been concerned with a system's ability to absorb changes and still persist (Holling 1973). Other resilience studies have focused on the gap between original states and less than ideal conditions. In the 1940s and 1950s, for instance, psychologists studied the negative effects of exclusion, poverty, and traumatic stressors on vulnerable individuals, especially children (Glantz and Johnson 1999). The concept was later adopted in other disciplines, including physics and disaster risk management, with a similar focus on recovery from shocks, or even adverse trends such as rapid population growth.
In the development community, the concept of resilience has been further adapted and elaborated. When applied to complex adaptive systems, resilience is not just about resistance to change and going back to how things were (Folke 2006). It can involve making adjustments to respond to new stresses or even making considerable changes to a system, be it a household, community, or country. Resilience here consists of three capacities that respond to different degrees of change or shocks (Berkes, Colding, and Folke 2003; Walker et al. 2004):
1. Absorptive capacity covers the coping strategies individuals, households, or communities use to moderate or buffer the impacts of shocks on their livelihoods and basic needs.
2. Adaptive capacity is the ability to learn from experience and adjust responses to changing external conditions, yet continue operating.
3. Transformative capacity is the capacity to create a fundamentally new system when ecological, economic, or social structures make the existing system untenable.
According to this broader definition, resilience is the result of not just one, but all three capacities. Each capacity leads to a different outcome: (1) absorptive capacity leads to endurance (or continuity); (2) adaptive capacity leads to incremental adjustments or changes; and (3) transformative capacity leads to transformational, system-changing responses (Figure 3.1).
These three different responses can be linked to different intensities of shock or change in a broadly hierarchical manner. The lower the intensity of the shock, the more likely the household, community, or system will be able to resist it effectively, absorbing its impacts without changing its function, status, or state. For example, a family would be better able to deal with a short-term food price hike--without making drastic changes--than a tsunami that levels its village.
BOX 3.1 THE GLOBAL HUNGER INDEX (GHI) AND EXPOSURE TO METEOROLOGICAL DISASTERS Not only the magnitude or frequency of a shock or stress, but also social, economic, and ecological factors characterizing a household, a community, a region, or a country determine whether exposure to risk will turn into a disaster or whether absorption, adaptation, or transformation is possible (Bundnis Entwicklung Hilft 2012). Existing food and nutrition insecurity is one factor that increases vulnerability to shocks and stresses. The graph below shows selected developing countries according to both their existing vulnerability (represented by the GHI score) and their exposure to shocks (represented by the average share of the population affected by extreme weather events, mostly droughts and floods, in 1990-2009).
Countries fall into four quadrants of the graph. The first quadrant shows countries that are less vulnerable to shocks (with a GHI score of less than 10) and less exposed (with a disaster incidence of less than 2 percent). The second quadrant shows countries that are currently less vulnerable but still highly exposed to shocks, such as China. Countries in the third quadrant have high GHI scores but relatively low exposure to weather shocks (note that Haiti has been exposed to other kinds of shocks such as earthquakes). Such countries are very vulnerable to weather shocks, but less frequently exposed to them compared with countries in the fourth quadrant. Many of the countries in the fourth quadrant are perennially vulnerable to floods and droughts, including those in the Horn of Africa (Eritrea, Ethiopia, Kenya), the Sahel (Chad, Niger, Sudan), Southern Africa (Malawi, Zambia), and South Asia (Bangladesh, India). Not surprisingly, these regions receive the bulk of the humanitarian assistance and also see most of the major international resilience-building efforts.
SELECTED DEVELOPING COUNTRIES' VULNERABILITY AND EXPOSURE TO SHOCKS
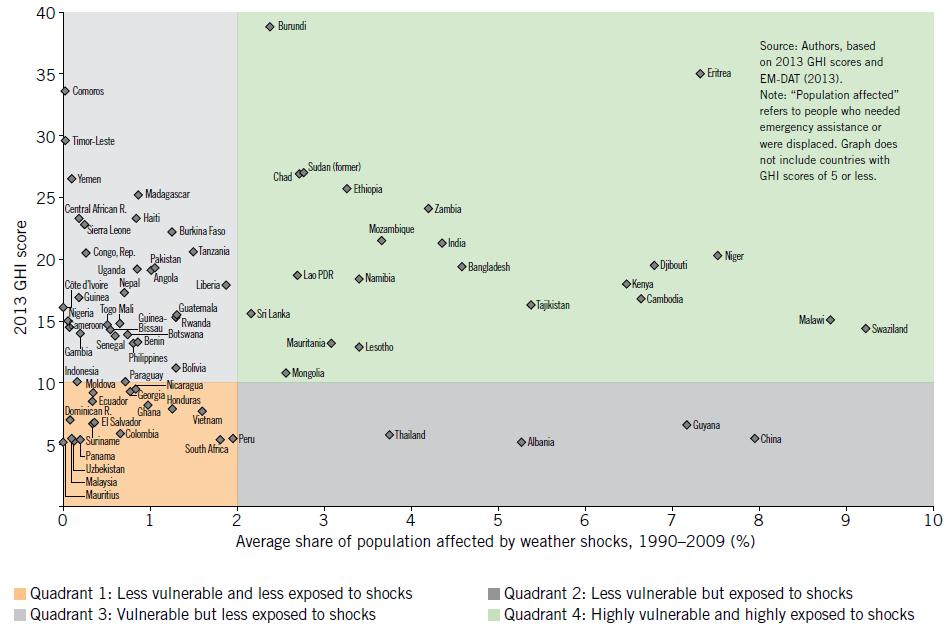
Click on image to enlargeSource: Authors, based on 2013 GHI scores and EM-DAT (2013).
Note: "Population affected" refers to people who needed emergency assistance or were displaced. Graph does not include countries with GHI scores of 5 or less.FIGURE 3.1 RESILIENCE AS THE RESULT OF ABSORPTIVE, ADAPTIVE, AND TRANSFORMATIVE CAPACITIES
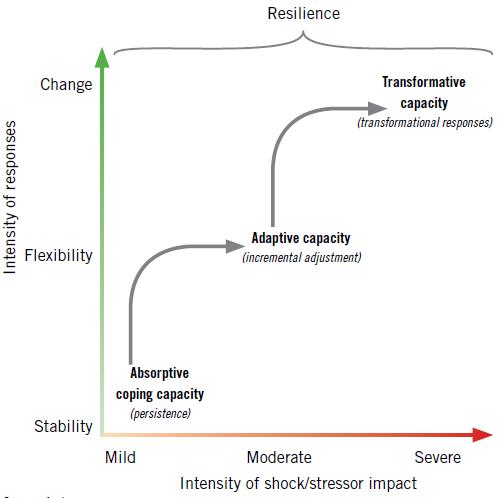
Click on image to enlarge
Source: Authors.
When the shock or stressor exceeds this absorptive capacity, however, individuals and communities will then exercise their adaptive resilience, which involves making incremental changes to keep functioning without major qualitative changes in function or structure. These adjustments can take many forms. Examples include adopting new farming techniques, diversifying one's livelihood, taking out loans, and connecting to new social networks. These adaptations can be individual or collective, and they can take place at multiple levels, such as among or between households, individuals, or communities.
If, however, those incremental changes associated with adaptive capacity are not enough to prevent a household, community, or system from avoiding dire circumstances, a more substantial transformation must take place. These changes permanently alter the system or structure in question. For example, droughts in the Horn of Africa may push people out of pastoralism and into sedentary agriculture or urban occupations, because they can no longer rebuild their herds (Lyb-bert et al. 2004; Box 3.2). Importantly, these changes may not always be positive in the long run, even if they prevent people from falling into acute poverty that puts their access to basic necessities such as food and shelter at risk. In the example described in Box 3.2, those who transition out of pastoralism may fare worse than active pastoralists, since sedentary agriculture is highly risky in arid conditions.
Strengths of a Resilience Framework
Adopting resilience as an analytical framework could help in the fight against food and nutrition insecurity for several reasons. Resilience helps frame problems coherently and holistically. Linking interrelated short-term shocks and long-term systemic change gives us a more complete view of the factors that lead people to drift into poverty, food and nutrition insecurity, or both. By giving greater weight to the significance of negative shocks than earlier development frameworks did, this concept of resilience highlights how an inability to cope with shocks makes it hard for the poor to escape poverty and explains why others fall into it in the first place (McKay 2009; World Bank 2006). |1|
A resilience framework has practical implications, as well. It may serve as a "mobilizing metaphor" (Bene et al. 2012) to integrate traditionally disparate sectors--particularly the relief and development sectors--and encourage them to work together (USAID 2012). It may also help bolster support for interventions, such as safety-net programs, that bridge relief and development. More integrated multisectoral programs and collaborations could adopt a more systemic and holistic approach to fighting both chronic and transient poverty compared with many of today's piecemeal approaches. Another practical advantage of using a resilience framework is that it has focused more attention on understanding the welfare and behavioral dynamics of vulnerable populations, including better measurement of transient poverty as well as food and nutrition insecurity.
The analysis and understanding of local dynamics are key to identifying existing and potential self-help competencies and capacities. It is essentially those competencies and capacities that must be built up to increase individuals', households', local communities', and states' ability to absorb, to adapt, and to transform. The "resilience lens" thus reaffirms the importance of identifying and strengthening local structures and supporting them in performing their roles effectively and working together. These structures include organizations as diverse as central or decentralized administrations, health centers, disaster risk management committees, and associations of small-scale producers.
Challenges of Applying a Resilience Framework
While the resilience framework seems to offer many benefits in theory, it faces many challenges in practice. First and foremost, experts in development and humanitarian circles have yet to agree on a common definition of resilience. Too often the definitions adopted tend to emphasize a return to initial states, which hardly seems consistent with promoting transformation and development.
BOX 3.2 RESILIENCE IN THEORY AND PRACTICE: A STORY OF THREE COMMUNITIES Barrett and Constas (2012) define resilience as a situation in which, over time, a person, household, or community is nonpoor and food secure in the face of various stressors and shocks. Only if that likelihood is high and remains so can that person, household, or community be considered resilient. What might this mean in practice? Here we take an example of three hypothetical communities from the real-world setting of African pastoralism at three points in time: before drought, the peak of the drought, and after drought.
Community A is relatively resilient. It has three assets that make it so. First, it has a large cattle herd. This means that, even though a drought will kill much of its herd, the community still has enough cattle after drought to rebuild the herd and maintain pastoralism as a viable livelihood. In other words, it has absorptive capacity. Second, Community A has the ability to graze and water its animals over a large and diverse geographical area. This herd mobility allows the community to move its animals from the most drought-affected to the least drought-affected areas and to change its migration strategy when needed. It thus has adaptive capacity. Finally, in the wake of previous droughts, some community members left to work in the capital city, where droughts have little or no effect on wages and the remittances sent home. In fact, the community uses these remittances as a form of insurance and to build up assets. So it also has built up its transformative capacity. At the end of the drought, Community A actually has gained a greater ability to withstand future shocks. Community B is on a path to increasing vulnerability, although some indicators might suggest otherwise. It has lost the ability to absorb drought impacts through the traditional strategy of moving cattle and rebuilding the herd. As a result, at the peak of the drought it decides to resort to violence to appropriate the herds, grazing land, and water resources of other groups. Like Community A, Community B has largely maintained its current well-being, but at the cost of other groups' welfare. Moreover, its cattle-rustling strategy incurs the risks of punishment and further violence, thereby reducing the community's future capabilities. Community C becomes even poorer and more vulnerable. This community's herd is much smaller, and its grazing and watering mobility have been substantially reduced by a mix of land enclosures, tribal conflict, and irrigation developments. When drought strikes, the herd is badly hit, and the community is left with too few cattle to rebuild the herd to a viable size. Community C becomes dependent on emergency relief, and its members switch to a new livelihood that is more diversified but also less remunerative: a mix of sedentary mixed crop-livestock farming and casual labor. Without external assistance, it will likely remain in this poverty trap.
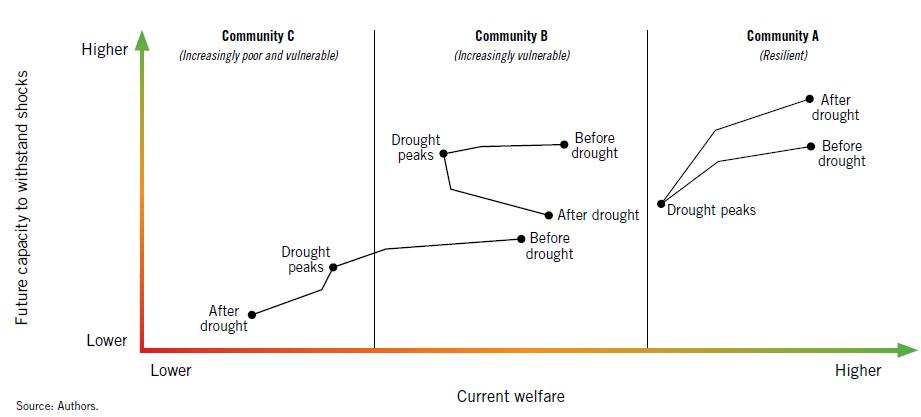
Click on image to enlargeSource: authors
Some critics have also suggested that resilience is a concept that does not translate well from ecological settings to social settings. They argue that the resilience model does not pay enough attention to social dynamics in general, and to issues of agency and power in particular. |2| However, NGOs and other practitioners increasingly challenge this view. They emphasize the resilience-enhancing role played by social processes, such as community cohesion, good leadership, and individual support of collective action (Twigg 2007; Boyd et al. 2008; Schwarz et al. 2011; VFL 2011). A rigorous assessment of the literature shows, however, that the number of these analyses is still low and the evidence thin (Bene et al. 2012).
Others fear that the resilience agenda may be pushed too far, threatening or diluting the impact of more traditional relief activities. If the relief sector's performance is benchmarked against its contribution to resilience building, many worthwhile but more narrowly focused relief efforts could lose resources. Enthusiasm for resilience building therefore needs to be tempered by an appreciation for the need for core relief activities and the benefits of specialization.
Finally, while resilience usually has positive connotations and is the goal of many programs and projects, the large majority do not consider its possible downsides. Some coping strategies, such as prostitution or begging, may strengthen resilience, but to the detriment of well-being and self-esteem. Other coping activities, such as crime, may increase the resilience of one group to the detriment of another person's well-being. |3| Moreover, when defined as the rapid return to an initial state, resilience may be counterproductive in the long run. Resilience as "stickiness," "stubbornness," or "resistance to change" is clearly not a desirable quality in many circumstances.
These concerns are by no means academic. Populations highly exposed to climate change, such as African pastoralists, are the subject of substantial debate over whether herd recovery or diversification out of pastoralism is the best long-term objective. Similarly, the argument that safety-net programs impede out-migration from drought-prone rural areas is relevant. In such a case, resilience without transformation, in response to a stressor as significant as climate change, could be an undesirable quality in the long run.
Resilience-Enhancing Interventions
As implied, a significant challenge for a resilience framework is to define exactly what value it adds to the current way of doing things. In principle, a resilience framework could add value in two ways. At a strategic level, a resilience framework could encourage governments and development partners to mainstream resilience as a policy and programmatic objective, and to coordinate difference agencies and sectors to achieve that objective. In this strategic sense, it is not obvious that new policy or program instruments are needed to achieve resilience since improved coordination and prioritization could be sufficient in themselves. However, one might also expect a resilience focus to encourage adoption of programs or policies that innovatively bridge the relief and development sectors (as opposed to specializing in one sector or the other).
This raises a question: What types of interventions might build this bridge between relief and development? An obvious example would be safety-net programs, which meet the criteria for providing social protection, or "relief," and contributing to development, or "longer-term resilience building." Social protection typically takes the form of food, cash, or voucher transfers, but the development component is more varied. Transfers that are conditional often incorporate explicit development objectives, such as raising school attendance, expanding vocational training or adult schooling, increasing nutritional knowledge, and, quite commonly, building infrastructure through public works programs. A very relevant example is the Productive Safety Net Program in Ethiopia (Box 3.3). This program was an innovative solution to two major problems: (1) the ad hoc, uneven, and unpredictable nature of traditional transfer programs and (2) the widely held view that excessive focus on relief was inhibiting sustainable rural development. By combining social protection with public asset building, the Productive Safety Net Program clearly contributes to both relief and longer-term development. In that sense, it is a resilience-oriented program.
Related programs in Ethiopia and elsewhere (such as BRAC's graduation model in Bangladesh) also focus on helping individuals and households build up business and financial skills as well as confidence and a sense of empowerment. These programs are based on the assumption that providing temporary safety from shocks is a key step toward building up assets that provide a more permanent resilience to shocks.
The Pastoralist Livelihoods Initiative is a quite different example of a relief-and-development intervention from Ethiopia (Box 3.3). While productive safety-net programs are well suited to sedentary crop or crop-livestock systems, pastoralists face unique challenges. Like crops, livestock are highly vulnerable to drought. But unlike annual crops, they are a perennial asset, like land. |4| This makes the death of livestock during droughts potentially very costly. In extreme situations, a household may drop out of pastoralism, simply because it cannot rebuild its herd after a drought.
The Pastoralist Livelihoods Initiative is a tightly focused resilience-building program that switches between relief and development, rather than trying to address both at the same time, as the Productive Safety Net Program does. It offers one clear practical way to address the disconnect between relief and development activities. But while safety-net programs have been widely researched all over the world, more experimentation, learning, and evaluation are required for these kinds of switching programs.
Bosco Ogwang
Lira District, Uganda"If children cannot eat enough food, it can be stressful to attend daily classes, study, and concentrate. The current food scarcity in the region will affect children's concentration in school and could, if it continues, lead to a higher dropout rate from school."
Maïga Mahamane
Employee of Welthungerhilfe, Mali"In 2012 we were beset by several crises: a nutrition security crisis, a politics and security crisis, and at the same time a humanitarian crisis. It was the first time we in Mali had to endure such a time of instability. Civil servants abandoned their offices, and the people in occupied areas had no one to turn to for help...."
"To prepare for the future, one has to consider that Mali is located in the Sahel, which is affected by climate change. The majority of the population depends on the wet season to ensure their food security. To improve their situation, they must pursue long-term activities to improve their production systems, to equip them with the necessary information, and to diversify their diet."
Measuring Resilience
With mounting interest in resilience as a conceptual framework comes increased demand for empirical knowledge of resilience. Governments, nongovernmental organizations, international donors, and others are interested in using the best available indicators and survey instruments to identify differences across space and time and to diagnose sources of vulnerability and design programs to address weaknesses. To diagnose the problems and develop the best responses, it is important to measure resilience by gauging the impacts of both shocks and the mitigating influences on these shocks, such as coping behaviors and outside interventions (Frankenberger and Nelson 2013). In short, good measurement should drive diagnosis and response (Barrett 2010).
A better understanding of resilience will require collecting data on the causes and consequences of a wide range of negative shocks. However, resilience, vulnerability, and coping behaviors are difficult phenomena to measure, because (1) shocks, by definition, are often short-term unpredictable events, implying the need for frequent data (for example, bi-monthly); (2) negative shocks often occur in remote places and populations, such as pastoralists in the Sahel or the Horn of Africa; and (3) resilience to shocks involves complex coping or adaptive behaviors, which are diverse and may involve thresholds and qualitative shifts.
As such, the unpredictable nature of shocks and responses to them makes measuring vulnerability and resilience much more difficult than measuring chronic welfare measures like poverty, child malnutrition, or infant mortality. For chronic measures, occasional snapshots from household surveys usually suffice to paint a general picture of poverty across regions and countries and to determine basic trends. These standard household surveys are not frequent enough, however, to assess the consequences of shocks except by coincidence, and large panel surveys in developing countries are still relatively rare. While many standard economic or health and nutrition surveys might measure important aspects of vulnerability and resilience, they are unlikely to measure all relevant behavioral responses. This suggests that measuring vulnerability and resilience requires a different approach.
BOX 3.3 TWO EXAMPLES OF RELIEF-AND-DEVELOPMENT PROGRAMS FROM ETHIOPIA Ethiopia is notoriously vulnerable to large-scale droughts, in both the sedentary mixed crop-livestock areas of the highlands and the mostly pastoralist lowlands. In the 1980s and 1990s, droughts left Ethiopia constantly scrambling for unpredictable humanitarian relief, particularly food aid. By the 2000s, experts agreed that this inefficient approach could leave the Ethiopian poor even worse off. It became clear that the cycle of crisis and relief was not helping the poor escape chronic poverty. They needed more help to spur the country's longer-term economic development. Over the next decade, Ethiopia's government and many international development partners experimented with new programs that mixed both relief and development elements. Two such programs were the Productive Safety Net Program and the Pastoralist Livelihoods Initiative.
THE PRODUCTIVE SAFETY NET PROGRAM. In 2005, the Productive Safety Net Program set out to achieve multiple objectives. On the relief side, it aimed to improve the targeting of benefits to the most vulnerable and increase the consistency and predictability of food and cash transfers. On the development end, it focused on building community assets through a public works program for all but the most labor-constrained households. A linked Household Asset Building Program focuses on building assets at the household level. Both internationally and in Ethiopia, many consider the Productive Safety Net Program successful. Its key strengths are its coverage of 7-9 million recipients, or about 13 percent of the rural population; its unique inter-institutional coordination; its strong monitoring and evaluation and capacity to improve itself through feedback loops; and its clear impact on food and nutrition security indicators. Despite these benefits, questions about resilience-related aspects of the Productive Safety Net Program persist. Is the program climate-proofed? Should it cover urban areas? Does it inhibit migration out of unsustainably low-potential regions? And are the Productive Safety Net Program and Household Asset Building Program really graduating people out of chronic poverty?
THE PASTORALIST LIVELIHOODS INITIATIVE. Though recently extended to the pastoralist lowlands, "conventional" safety net programs such as the Productive Safety Net Program are difficult to apply to pastoralist settings because of the dominance of livestock-based livelihoods, and the greater dispersion and mobility of pastoralist populations. On a smaller scale than the Productive Safety Net Program, the Pastoralist Livelihoods Initiative adopts a unique approach to combining relief and development activities in a pastoralist setting. Severe drought is a fact of life in the arid lowlands of the Horn of Africa and has always led to cyclical booms and busts in herd sizes. Yet there is evidence of a long-term decline in herd sizes because pastoralists are unable to rebuild herds after droughts. While some debate the reasons for this trend, mounting evidence suggests that it is far more cost-effective to limit herd deaths in the first place or to ensure that pastoralists slaughter or sell their animals for cash rather than see them die of starvation or disease. Nongovernmental organizations working in pastoralist areas echoed the same complaints that spurred the development of the Productive Safety Net Program. Emergency funding and resources were too slow to mobilize at the onset of drought, leading to inefficient relief activities. The Pastoralist Livelihoods Initiative implemented two innovative approaches to resilience building. First, it focused on development activities in normal years (largely for livestock activities to grow herds). Second, it built in a "crisis modifier" approach that allowed implementing agencies to quickly reallocate resources to relief activities if a drought set in. How does this work? The Pastoralist Livelihoods Initiative features built-in triggers to switch between relief and development. In the first phase of the initiative, agencies could set aside and access 10 percent of their allocated funds if drought triggered the crisis modifier. In the second phase, the main implementing agency (USAID/ Ethiopia) developed an agreement with USAID's relief agency to allow implementing agencies to quickly and seamlessly get more funds when the crisis modifier was triggered. The Pastoralist Livelihoods Initiative's "relief" strategy went beyond the normal approach to relief by protecting livelihoods-- not just lives. The relief included emergency destocking and slaughter, provision of feed and water (including improved feeds to support animal milk production and child nutrition during drought), and emergency veterinary care. Like the Productive Safety Net Program, the Pastoralist Livelihoods Initiative also contained a strong focus on evaluation and adjustment. Evaluations revealed that some interventions were far more cost-effective and sustainable than others.
Sources: Personal interviews with John Graham, USAID, and Matthew Hobson, World Bank. For academic discussions of these issues, see Gilligan, Hoddinott, and Taffesse (2009) and Berhane et al. (2011) for impact evaluations of the Productive Safety Net Program and Household Asset Building Program. See Lybbert et al. (2004) for a discussion of pastoralist herd dynamics, as well as Headey, Taffesse, and You (2012, forthcoming) for a review of pastoral-ist livelihood issues in the Horn of Africa.
TABLE 3.1 PROPOSED METRICS FOR MEASURING RESILIENCE TO FOOD AND NUTRITION INSECURITY Sample metrics Resilience measurement principles Initial basic conditions
Food and nutrition security Health index Assets index Social capital index Access to services index Infrastructure Ecological index High or appropriate frequency Sensitive to short-term variation and critical thresholds Measured at many levels, including household, community, village, district Shocks and stressors
Covariate shocks and stressors Drought/flood Health shocks Political crises Price volatility Trade/policy shocks Idiosyncratic shocks and stressors
Illness/death Loss of income Failed crops Livestock loss High frequency Intertemporal Dynamic Measured at multiple levels, from household, community, village, and district up to country-level macroeconomic indicators Responses
Mitigation strategies Coping strategies Adaptation strategies Measured at multiple levels, across the systems that affect food and nutrition security Subsequent basic conditions
Food and nutrition security Health index Assets index Social capital index Access to services index Infrastructure Ecological index High or appropriate frequency Sensitive to intertemporal variation and critical thresholds Measured at many levels, including household, community, village, district Source: Adapted from Constas and Barrett (2013).
What, then, are the key issues that arise when one tries to measure resilience in the context of food and nutrition insecurity? A distinguishing feature of resilience and vulnerability is the potential for complex dynamics. In vulnerable socioeconomic environments, individuals, households, and communities are likely to experience dynamic fluctuations in well-being, including a mix of long-term trends, cyclical and seasonal shocks, and major covariate shocks. Moreover, the transitions from one state, such as chronic poverty, into either better or worse states are likely to be characterized by a range of threshold effects or tipping points, such as when a drought reduces herd sizes below a threshold of recovery (Box 3.2; Lybbert et al. 2004).
Finally, resilience requires a multilevel or systemic measurement approach. This includes measurement at different levels--individual, household, community, (eco)system--and among different socioeconomic and ethnic groups. This also requires an understanding of how these different identities and factors interact. Beyond the household level, systemic factors, such as health conditions, social and political relationships, culture, agroecological factors, and macroeconomic conditions, may affect resilience.
These basic principles have important implications for measurement in practice. Table 3.1 provides a general list of proposed indicators that could be used to measure resilience for food and nutrition security. Perhaps the most important prerequisite for resilience measurement is higher-frequency surveys (Barrett 2010; Headey and Eck-er 2013). Though still surprisingly rare, high-frequency measurement is a necessary condition for understanding vulnerability and resilience, because it helps identify (1) "dynamic initial states," such as season-ality, cyclicality, and exposure to idiosyncratic shocks; (2) differences between pre-shock and post-shock states; (3) the complex dynamics of coping and adaptation mechanisms; and (4) the key thresholds that may arise in the transitions between initial and subsequent states (Barrett and Constas 2012). The more standard program evaluation based on two to three rounds of a survey (typically conducted several years apart) will rarely if ever suffice to make sense of the complexities of highly vulnerable people's lives.
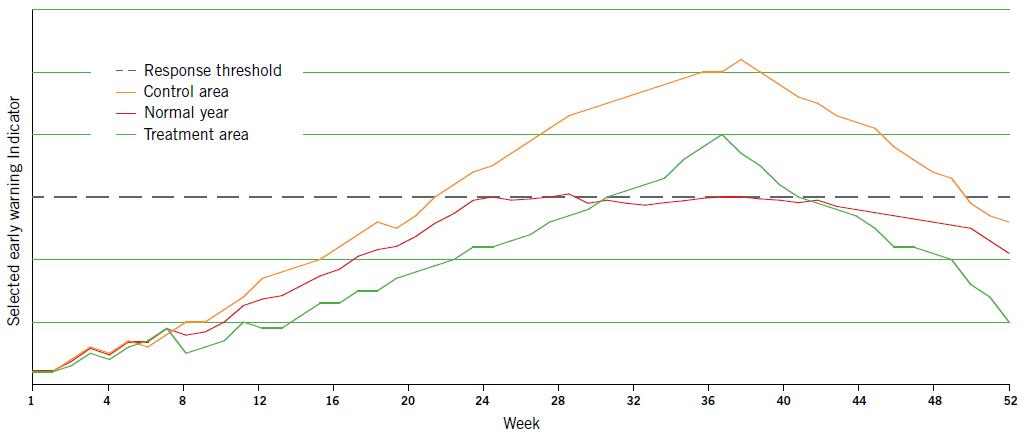
The most pertinent examples of high-frequency resilience surveys are the nutritional surveillance system surveys conducted by Helen Keller International (HKI) in Bangladesh and Indonesia. |5| The World Food Programme (WFP) also uses the nutritional surveillance system approach in some of its high-priority countries, such as South Sudan. These surveys are typically conducted every two months--more often than standard household surveys--in order to pick up the effects of both seasonal shocks and "one-time" natural disasters. Moreover, while the nutritional surveillance system surveys focus heavily on nutrition indicators, they also look at a wide range of household characteristics and coping behaviors (Box 3.4).
Guillermo Pacotaype
Chuschi District, Peru"I started with a project to rehabilitate the springs and creeks by setting stones around them to protect them from animal excrement and the drying sun, and by planting putaqa [Peruvian plant], which is a species that catches water well. At the community level, we have implemented the legal guidelines to protect our water sources. For example, we prohibit the drawing of water with dirty utensils or the use of soap in the water hole."
Villagers of Dukum
Rayagada District, India"We have been living in forests for generations, but our rights to the land have yet to be registered. The fact that we do not have legal ownership over much of the land on which we have been living and depend on for our food and livelihood makes us feel insecure. The lack of proper demarcation of the plots of land allocated to us ... is leading to the shrinking of our land under cultivation in the forest...."
Beyond the need to use higher-frequency surveys, resilience measurement faces additional challenges in terms of the breadth of the resilience concept. Resilience is a highly multidimensional concept with numerous causes and manifestations. Moreover, some factors may be considered not only causes or sources of resilience, but also indicators of resilience. For example, a non-exhaustive list of factors that are simultaneously considered as "contributors" to and "results" of resilience includes: technological capacity, appropriate skills and education, gender empowerment, sustainable natural resource management, adequate livelihood assets, good governance, and access to infrastructure (Alinovi et al. 2010; USAID 2012; Tulane and UEH 2012; Vaitla et al. 2012). This clouding of the distinction between cause and effect limits our ability to compare or refute specific hypotheses (Fran-kenberger and Nelson 2013).
In addition, this diverse and extensive list of factors poses some serious challenges to both measurement and scientific analysis. Some of these factors are inherently difficult to measure, such as governance, natural resource management, and gender empowerment. Many must be measured qualitatively rather than quantitatively. Some indicators must be measured at the individual or household level, but others need to be measured at the community level or even higher. Finally, some factors--as well as the definition of resilience itself--are likely to be context- and shock-specific, thereby limiting comparability across survey sites. Some factors fall under one discipline, such as economics, while others fall under very different disciplines (ecology, political science, sociology). As already emphasized, most--if not all--of these factors ought to be measured in high-frequency surveys. Thus the practical challenges to effectively monitoring and measuring resilience are considerable. Yet collecting such an extensive set of data to measure resilience could help shape more informed responses to a wide range of crises.
Looking Back
The complexity of the concept of resilience and the challenges of measuring and promoting it may paint a somewhat daunting picture for policymakers and development practitioners. Indeed, some vulnerable countries and regions have found themselves mired for decades in poverty and food and nutrition insecurity in the face of shocks. Other highly vulnerable countries, though, have seemingly become more resilient. Much can be learned from the varied experiences of these groups of countries.
BOX 3.4 HELEN KELLER INTERNATIONAL'S NUTRITIONAL SURVEILLANCE PROJECTS IN BANGLADESH AND INDONESIA Helen Keller International (HKI) set up nutritional surveillance systems in Bangladesh and Indonesia to document the effects of crises on the well-being of the poor. In Bangladesh, the system monitored the effect of disasters such as floods. In Indonesia, it was designed to monitor the effect of the Asian economic crisis of the late 1990s on nutrition and health. Over the years, these nutritional surveillance systems evolved into comprehensive, yet flexible, information systems providing timely, accurate, and important data for policy and program planning, nationally and internationally. The indicators in HKI's surveillance systems are based on UNICEF's conceptual framework of the causes of malnutrition and cover areas such as the nutrition and health status of mothers and children, socioeconomic status, food production and consumption, and health service use. In Bangladesh, the nutritional surveillance project originally collected data in disaster-prone sub-districts, but in 1998 the sampling procedure was revised to be nationally and divisionally representative. Data collection takes place every two months to capture seasonal changes in nutrition and health, which allows the impact of disasters to be distinguished from seasonal effects. For example, as the top chart shows, the share of households that borrowed to cope with the 1998 floods in Bangladesh spiked to more than 50 percent from less than 10 percent over a 5-month period. In 1998, Bangladesh experienced one of the worst episodes of flooding on record. The nutritional surveillance project was instrumental in drawing attention to the plight of flood-affected areas and in helping target public responses to populations in need. The surveillance data also showed that child wasting more than doubled from the surplus season to the lean season. Reducing such harmful effects of seasonality is an important part of building resilience.
Household Borrowing to cope with the 1998 Floods in Bangladesh
Click on image to enlargeSource: Adapted from Bloem, Moench-Pfanner, and Panagides (2003).
Note: Data are for households located in subdistricts that were severely affected by the 1998 flood.Seasonality in Child Wasting, 1998-2000
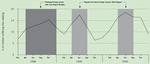
Click on image to enlargeSource: Adapted from Bloem, Moench-Pfanner, and Panagides (2003).
Note: Data are for households located in subdistricts that were severely affected by the 1998 flood. Data on wasting are for children aged 6-59 months.FIGURE 3.2 TRENDS IN FOOD AID RECEIPTS, 1988-2011
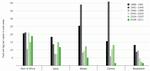
Source: Authors' calculations, based on WFP (2013).
Notes: Per capita estimates = food aid receipts/total rural population, from World Bank (2013b), assuming the vast majority of food aid recipients are rural. Data are averaged over four-year periods to reduce the volatility in the series. Data are measured in kilograms of grain equivalent. As a proxy for national-level resilience, food aid receipts come with caveats. One obvious problem with food aid receipts as an indicator of resilience is that the amount of food aid may reflect the donors' or recipients' influence or political clout, and not just need. Another problem is that the indicator is volatile by its very nature, though we partly control for this here by taking four-year averages of the data.
Sindhu Kumbruka
Rayagada District, India"We have been asserting our rights to the forest and filing for recognition of our community and individual forest rights. We have begun regenerating more than 4,000 hectares of degraded forest."
Figure 3.2 shows three countries and two subregions that score high on the 2013 Global Hunger Index and are exposed to weather shocks, along with their food aid receipts as a proxy for resilience over time. The food aid data reflect the standard narrative of "permanent crisis" in the Sahel and the Horn of Africa, where food aid receipts were roughly as large in 2008-2011 as they were about 20 years ago. In contrast, Malawi and Zambia (two countries where controversial fertilizer subsidy programs have greatly expanded maize production) have seen improvements in recent years, though questions remain about whether these efforts can be sustained. And finally, Bangladesh has achieved a remarkable reduction in food aid dependency. Its 85 percent drop in food aid receipts from the early 1990s to 2008-2011 is consistent with the country's dramatic economic and social achievements (Economist 2012), including rapid agricultural growth (through new crop varieties and other modern inputs), sharp reductions in fertility rates, dramatic expansion in education (especially for females), a microfinance revolution, and sustained job creation outside of agriculture.
There is more to learn about why some vulnerable regions have made so little progress, while some shock-prone countries seem to have turned themselves around. Success stories like Bangladesh, Malawi, and Zambia, however, show that building individual, community, and national resilience within a generation is a real possibility.
Looking Ahead
The importance of considering the building blocks of resilience is becoming more apparent to the development and relief communities, both of which have long struggled to understand why some people fare better than others when confronting stresses or shocks. Resilience is a challenging concept that has evolved across an unusually wide range of disciplines. Its increasing adoption in development circles is understandable given the mounting evidence of the close interactions between short-term shocks and longer-term development.
But while the underlying rationale for focusing on resilience building is strong, adopting a resilience framework faces many challenges. Conceptually, consensus is needed on what resilience is and what it is not; on whether resilience is desirable by definition, or whether it might include detrimental behaviors; on whether it only means bouncing back, or whether it also includes adaptive and transformative behaviors.
Empirically, measuring and monitoring resilience and its causes is not easy. Far more than chronic poverty, resilience is a dynamic concept requiring high-frequency surveys, at the very least in those countries and regions perennially exposed to severe shocks and stressors. No less challenging is the multidimensional nature of resilience and what that implies for the detailed work of survey design and scientific collaboration.
Finally on the policy and programmatic front, the resilience paradigm needs to demonstrate that it offers something substantially new, both in terms of an expanded dialogue between the traditionally disconnected relief and development sectors and in terms of innovative new programs that address both humanitarian and development objectives.
In summary, to achieve food and nutrition security, more effort is needed to protect and improve poor and vulnerable people's ability to respond to changes and shocks. Much work needs to be done before we know whether a resilience framework is the most useful tool for building this resilience. What is sure however is that there is a growing consensus on the need to break down barriers between actors, sectors, and disciplines and that this consensus must now be converted into effective policies and practices that strengthen the resilience of the poorest and most vulnerable people.
BUILDING COMMUNITY RESILIENCE TO UNDERNUTRITION
Learning from the Past to Inform the Future
One of the biggest challenges facing the development community is how to win the war on hunger. Over the years, it has become clear that the traditional approach of temporary infusions of aid has not always succeeded in protecting the poor and vulnerable from food and nutrition insecurity. Far too many people still live on the edge--just one drought, one flood, or one crop failure away from starvation. For others, manmade conflicts may also limit their access to food.
With about 100 years of combined experience tackling hunger and poverty around the world, Concern Worldwide and Welthungerhilfe have long known that in chronically food-insecure regions or areas of protracted crisis, the poor and vulnerable cannot cope with all the stressors they face. It is not possible to do effective long-term development work that alleviates hunger and poverty without planning for and managing the risks associated with disasters--especially in a world increasingly affected by environmental degradation and urbanization alongside climate change, economic pressures such as food price volatility, and population growth. That means resilience-boosting efforts must be a part of any programming that aims to help the poor and vulnerable become food and nutrition secure.
To explore the concept of community resilience to undernutrition in mostly rural settings, this chapter offers lessons learned from resilience programming in several different contexts where Concern and Welthungerhilfe work: Haiti, the Sahel, and the Horn of Africa. Haiti is characterized by limitations in food availability and access, while in the Sahel region and the Horn of Africa, extreme and persistent levels of child undernutrition point to a serious resilience deficit. The "resilience paradigm" is now part of the development discourse in Africa south of the Sahara, but it has only recently been introduced in Haiti. Lessons from Welthungerhilfe's long-term programming experience linking relief, rehabilitation, and development in Haiti (Box 4.1) and from Concern's programs in Ethiopia, Kenya, and Niger, which have informed the design of a new program in Chad, demonstrate the added value of resilience-oriented programming.
In this chapter, "community resilience" in the context of chronic food crises is defined as the ability of a community to anticipate, respond to, cope with, and recover from the effects of shocks and stresses that drive or exacerbate undernutrition, in a timely and effective manner without compromising the poor's well-being or their long-term prospects of moving out of poverty and hunger. Resilience therefore is the ability to bounce back from a shock. It involves being able to adapt to a changing and increasingly unpredictable environment by expanding livelihood options through learning and innovation. The latter is a key ingredient for any radical change or transformation of livelihoods that might be required should a situation become untenable.
Note: This chapter by Welthungerhilfe and Concern Worldwide reflects the views of these organizations. It is intended not to present research findings, but rather to show examples from their practical work and experiences in the field.
Don Santiago Lewis
Community of Pihni Auhya, Nicaragua"To get through hard times, we began to practice what our ancestors practiced: unifying the community to produce food and deal with social problems. We try to deal with the problem of pests by using organic pesticides. With training, we realized that chemical insecticides and pesticides change the ecosystem, lead to the appearance of new pests, and take years to decompose."
Maria Marcela Peje Casimiro
Carhuaz Province, Peru"We have already had two big landslides that flooded our farms, fields, and homes and destroyed the road, putting our access to food at risk. After the floods, it was difficult because we did not have access to food, and the donations that reached us were not very useful. They brought us food that we were not used to eating, strange food.... "
"We started to build queshus [storehouses], which belong to the community,... up the hill, where we keep our potato crop, corn, and other food. This allows us to eat in times of flooding or other times when we need it. We need to increase the number of queshus to be sure, because now we face floods and also unknown diseases in our fields.... Thus we can prevent our children and the entire population of our community from going hungry in times of flooding."
Fostering Community Resilience to Food and Nutrition Crises in Haiti
After the devastating earthquake of 2010, the international community rallied around Haiti. In 2013, three and a half years later, international donors have begun to phase out earthquake-related assistance, despite the country's extreme vulnerability to food and nutrition insecurity. Although the latest data show a positive trend, |1| as recently as 2012 droughts and storms led once more to increased food and nutrition insecurity. In an environment that is not only highly exposed to natural hazards, but also vulnerable to recurrent economic and sociopolitical shocks and stresses, analyzing long-term programming using a "resilience lens" adds value.
Welthungerhilfe's Program Areas in Haiti
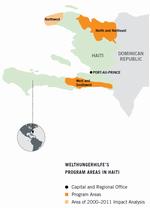
Click on image to enlargeSource: Welthungerilfe based on official maps.
Sources of Haiti's Resilience Deficit
WIDESPREAD POVERTY AND CONTINUOUS FOOD INSECURITY. Haiti has suffered from widespread poverty and chronic food and nutrition insecurity for decades. Between 1990 and 2000, its GHI improved only a little, falling from a value of 33.8 to 25.7. Despite recent improvements, Haiti remains in the group of countries categorized in the GHI as "alarming" (2013 GHI score of 23.3), mainly because of widespread poverty that severely limits households' access to sufficient nutritious food. More than half of Haiti's households are trapped in absolute poverty and live on less than a dollar a day (Glaeser, Horjus, and Strother 2011).
NATURAL SHOCKS AND SOCIOPOLITICAL STRESSES. In 2012, Haiti was ranked the country most at risk from climate change (Maplecroft Global Risk Analytics 2011). By 2011, Haiti had experienced 34 major shocks in just one decade (Glaeser, Horjus, and Strother 2011). In addition to these larger-scale events, localized droughts, floods, landslides, and other smaller shocks also regularly undermine community and household resilience. More than half of all households affected by the 2010 earthquake were already in debt, with 95 percent of this debt related to food purchases (Haiti 2010). Haiti's present risks are as much political as environmental. Weak governance can be observed across the four criteria commonly used for identifying fragile states: security, welfare, constitutional laws, and promotion of economic development (Radtke 2010).
AN EMERGENCY ECONOMY. The international community has arguably missed opportunities to contribute to a more robust public sector that could play a more prominent role in creating a resilience-enhancing policy framework. While evidence from Haiti and other countries, along with aid effectiveness and human rights principles, suggests that aid is most effective at strengthening public institutions when it is channeled through them, only 1 percent of post-earthquake relief aid and 12 percent of recovery aid went directly to the government using national systems (United Nations 2013a). Given the availability of substantial funding after each disaster and the seeming absence of a Haitian alternative, international NGOs and development consultants continue to be willing to take over public service delivery and job creation. Instead of strengthening the government and Haitian civil society, they have contributed to undermining their legitimacy and locked the country into a "humanitarian approach" and a dependency on aid (Haiti Grassroots Watch 2010).
BOX 4.1 WELTHUNGERHILFE IN HAITI For almost 40 years, Welthungerhilfe has been active in Haiti, supporting partners and projects in the areas of agroforestry and watershed management, improvement of rural infrastructure (irrigation and roads), disaster preparedness, and strengthening civil society. In 2011, the organization commissioned an external impact analysis of 10 years' programming in Haiti's North-West Department, one of the most food-insecure regions in the country.
Agriculture's Role in Community Resilience
Most of the poor and food insecure live in rural areas. Smallholder farmers face difficult structural limitations, and still need to buy most of their food (Glaeser, Horjus, and Strother 2011). |2| Thus, agricultural policies must play a key role in strengthening community resilience to hunger.
LOW PRODUCTIVITY, FRAGMENTED LAND HOLDINGS, UNSUSTAINABLE PRACTICES. Despite Haiti's favorable growing climate, average cereal yields are much lower in Haiti than in its Caribbean neighbors Cuba and the Dominican Republic (Table 4.1).
What explains Haitian farmers' relatively low cereal yields? Most farmers in Haiti are mountain peasants with small farms comprising several dispersed plots of land. Under Haiti's land inheritance laws, multiple heirs share an interest in their land, which leads to continuing fragmentation of land holdings and weak land tenure. These conditions have made it easy for large-scale farmers as well as industrial and mining companies to acquire fertile lands (Cadre de Liaison Inter-ONG Haiti 2013).
Given the poor quality of their holdings and the constant exposure to environmental and climatic hazards, most peasants focus on reducing risk rather than maximizing production as a strategy for survival and food security. To manage risk and spread out harvest cycles, they actively diversify land portfolios and cropping patterns. At the same time, demographic pressure and poverty force the rural population to engage in activities, such as deforestation, which increase its vulnerability to risk. The deforestation leads to environmental degradation, soil erosion, and water shortage. Furthermore, because of land shortages, farmers increasingly farm on steep slopes with particularly fragile soils--a practice that leads to further erosion and land degradation.
Besides the declining size of land holdings and the high level of risk they are exposed to, small-scale producers are also constrained by a lack of investment leading to low levels of agricultural technology and inadequate infrastructure, strong migration out of rural areas, difficulties in accessing appropriate markets, and weak representation in policy debates.
TABLE 4.1 AVERAGE CEREAL YIELDS IN CUBA, DOMINICAN REPUBLIC, AND HAITI, 1993-2011
Country Average cereal yields (kilograms / hectare)
1993-1997 1998-2002 2003-2007 2008-2011 Cuba 1,859 2,632 2,874 2,325 Dominican Republic 3,832 4,073 4,052 3,299 Haiti 947 912 947 941 Source: World Bank (2013a).
Notes: Cereal yield, measured as kilograms per hectare of harvested land, includes wheat, rice, maize, barley, oats, rye, millet, sorghum, buckwheat, and mixed grains. Production data on cereals relate to crops harvested for dry grain only. Cereal crops harvested for hay or harvested green for food, feed, or silage and those used for grazing are excluded. The FAO allocates production data to the calendar year in which the bulk of the harvest took place.
Alozio Businge
Kabarole District, Uganda"I used to work as a watchman with Health, Water and Sanitation (HEWASA), a nongovernmental organization. In 2002, I had a car accident on my way to work. I was bedridden for one year and obviously lost my job. I am disabled and inactive. I cannot provide for my family as I used to. Life is very hard for me...."
"The government and NGOs should adjust their rigid attitudes toward formal employment and begin to appreciate self-employment as the way to go. The government needs to take stringent measures to control population (for example, at most three children per family). Otherwise the situation will soon be uncontrollable."
Guillermo Pacotaype
Chuschi District, Peru"In order to assure my harvest and prevent possible damage caused by the weather, the project ECOCLIMA taught me about risk management. I started to cultivate my plants in separate plots within different ecological zones, and if I lose the harvest at one farm, I still have the other farms to harvest."
UNFAVORABLE POLICY ENVIRONMENT FOR SMALL-SCALE PRODUCERS. In the aftermath of Hurricane Sandy in 2012, the Haitian government reaffirmed a commitment to agrarian reform and announced plans to increase Haiti's capacity to meet 60-70 percent of its food security needs by 2017 (AlterPresse 2012; Joseph 2013). But so far, support for large-scale agribusiness development dominates, while little investment goes into restoring Haiti's environment and into sustainable agriculture that benefits small farmers and helps feed local communities.
Some observers contend that donors, especially the International Monetary Fund, World Bank, and the United States, still actively promote a vision of export-oriented agribusiness-led development (Kennard 2012) that began in the 1980s with the structural adjustment programs recommended by the International Monetary Fund and World Bank. These programs did not lead to broad-based growth in Haiti's agricultural sector. Instead, they favored an elite few and fostered dependency on imports. This dependency was further increased by large-scale food distribution programs that channeled more food into the Haitian market without considering local production and self-help capacities. Harmful policies, such as low import tariffs for rice, |3| have made it difficult for local farmers to compete with cheap imports. Reliance on imports makes Haitians particularly sensitive to food price fluctuations on the world market and increases the food insecurity of the poorest.
Another challenge is the lack of a cross-sectoral approach to food and nutrition security. While the Ministry of Agriculture is in charge of ensuring food security, the Ministry of Health is responsible for nutrition. Thus far, it is unclear whether Haiti's decision to join the international Scaling Up Nutrition (SUN) initiative in June 2012 is backed by sufficient political commitment to tackle malnutrition across sectors.
Welthungerhilfe's Program and Its Impacts
Haiti's North-West Department is one of the regions most affected by structural food insecurity. More than 90 percent of the inhabitants depend on subsistence agriculture for their livelihoods. Since 1993, Welthungerhilfe has been working in the region, focusing on integrated food security and, since 2003, on the sustainable use of water resources to ensure food security and to improve living conditions. Given the regional context, Welthungerhilfe's program of work in the area concentrated on improving food availability and access and gave less attention to nutritional issues. In total, 21 projects financed by a variety of donors were implemented between 2000 and 2011 and reached 37,000 households.
Although the program was not specifically designed to strengthen community resilience to undernutrition, it offers important lessons.
FIGURE 4.1 IMPACT CHAIN OF 10 YEARS OF PROGRAMMING IN HAITI'S NORTH-WEST DEPARTMENT
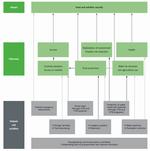
Click on image to enlargeSource: Adapted from Kundermann, Exceus, and Almqvist (2012).
Note: CFW = cash for work. FFW = food for work. These programs also contributed to temporary income. The arrow color indicates the intensity of proven impact.
Nunu Desalegn
Addis Ababa, Ethiopia"Life is very difficult due to inflation. Teff [Ethiopian grain] is very expensive. I used to buy 100 kilograms for 300 birr; now the price is 2,000 birr.... Previously we consumed lentils, vegetables, and meat, and now due to inflation we cannot afford to eat all these.... Now, we can afford to eat meat only for holidays like Easter. I have no savings. I don't know what will happen in an emergency."
Maria Naok
Karamoja District, Uganda"When my husband was still alive, we had some animals, cattle, and goats. We lost them all due to raids. The last chicken I had died from poultry cholera. That's why I have no more animals at all.... Last year, I cultivated the land and sowed, but there was no harvest at all. The rain was strong, the field was flooded, and all the plants died...."
"As I harvested nothing last year and have no animals, I have to count on other sources to survive till the harvest comes. I cut firewood and produce charcoal, which I sell on the market. From the income, I buy some sorghum and make local beer from it, which I sell. I am actually preparing a garden and am planting some vegetable seedlings, grown in a nursery from seeds that we got from Welthungerhilfe."
The program helped strengthen community resilience to food and nutrition insecurity by consistently addressing the structural root causes of food and nutrition insecurity and simultaneously making thoughtful use of emergency instruments, such as food- and cash-for-work. Looking at the program through a resilience lens allows us to identify key resilience factors for future programming.
The program in the North-West Department integrated several components in order to holistically protect a distinct watershed, to ensure access to remote areas, and to provide irrigation and water supply systems to the households involved. Flexible funding mechanisms for emergency interventions were included from the outset in order to offer an opportunity to react to acute needs when natural disasters struck (Kun-dermann, Exceus, and Almqvist 2012). Figure 4.1 illustrates the outputs and impacts achieved by the program and shows how the different types of interventions and programming levels are interrelated.
The external program analysis found the following direct and indirect impacts between 2000 and 2011:
- Despite recurring shocks and stresses in this period, 4,800 households sustainably improved their food security, mostly by acquiring access to irrigation and water supply systems and benefiting from protected crop areas with high yield potential.
- Household incomes grew thanks to agricultural yields that rose by 50-200 percent. Factors that contributed to these improved yields included irrigation systems, soil protection measures, better water supply systems, and better access to markets via newly constructed rural roads.
- For many households, not only food availability and access, but also the quality of the food consumed improved. Vegetable consumption increased as a result of irrigated agriculture and diversification, and access to safe drinking water improved health (reducing the incidence of diarrhea by 20 percent) and nutrition.
- Food deficits during acute crises were reduced by an estimated 30-50 percent, mostly because of the introduction of flexible and well-targeted food-for-work and cash-for-work programs during acute emergency phases. As a result, households were better able to avoid harmful coping strategies such as the sale of animals, loss of assets, or charcoal production leading to further deforestation.
Ingredients of Resilience
An analysis of programming through a resilience lens revealed that many factors are important for strengthening community resilience to undernutrition.
- By addressing several underlying, structural causes of vulnerability (such as inadequate infrastructure, inappropriate technologies, and difficult-to-access markets), the program contributed to positive long-term prospects of moving people out of hunger and poverty. To further strengthen nutrition security, a specific and detailed vulnerability analysis must be conducted on a local level.
- Though sustainable food and nutrition security were their main goals, interventions were also designed to mitigate disaster risks and to anticipate, respond to, and cope with shocks and stresses such as landslides, flooding, or earthquakes. The long time horizon and continuity of the program, notably in strategies and staffing, permitted a development-oriented response to acute crises. One key to success was an in-depth analysis of local self-help capacities after each emergency and support to fill gaps in capacity. Flexible, accurately targeted emergency funding to address these gaps supported the community in pursuing long-term development goals. Given the likelihood that natural hazards in Haiti's North-West Department will increase further the importance of well-targeted humanitarian aid, the issue of social protection and insurance for risks must be addressed at a higher level by governmental institutions, civil society, and major donors. Otherwise, emergency interventions, if not properly conducted, risk continuing to undermine self-help capacities and locking Haiti further into a humanitarian approach.
- The program fostered the emergence of local committees, such as water management committees, which can, in the medium to long term, become the nucleus of an organized rural civil society that is better equipped to collectively mitigate risks. So far, the committees remain fragile. Continuous cooperation with the government to ensure institutional support for these committees after the program ends is important also for the future.
- The program was aligned with national policies guiding agriculture and rural development, drinking water and hygiene, food security, environmental protection, and disaster risk reduction interventions. Through close cooperation with state structures and community administrations, their capacity for contingency planning and effective action is strengthened.
This combination of factors has helped strengthen community resilience to undernutrition in the North-West of Haiti. Given Welthungerhilfe's intensive and long-term engagement, opportunities to foster resilience-enhancing policy change and to monitor implementation of such policies should be used to strengthen governmental accountability and leadership. This can be done in partnership with other NGOs and by supporting Haitian civil society organizations. The Welthungerhilfe conference "Haiti beyond Emergencies: Haitians as Actors for Their Own Development" in Port-au-Prince in December 2012 opened a space for dialogue between Haitian civil society and government. It was a positive step in moving Haiti toward having a greater say in its future development. It underscored the importance of Haitian society as the main driver in its own sustainable development and in building a resilient environment.
Daw Kae Phyo
Yangon Division, Myanmar"In 2007, Cyclone Nargis destroyed my house as well as the harvest from a field for which I had saved up money to rent for one paddy season--to try and get out of debt. As I could not pay the landowner the final land rental fee, I was arrested and stayed in jail until I could borrow money from a local moneylender at 15 percent interest per month."
Daw Hnin Aye
Yangon Division, Myanmar"We don't need to worry about urgent household expenditures as before, as we can access money from the savings group on short notice and at an interest rate that we can manage to repay. In former days, we would live in constant worry that we would need to seek financial help from outside the community if our children fell sick, or if we had a bad month of work, or a bad harvest. Now we can manage ourselves and cover our own needs and unexpected financial expenses. Also, if we have another storm, such as Nargis, we can help each other to recover."
Community Resilience in the Sahel and the Horn of Africa
Extremely poor people, Concern believes, have few assets or achieve little return on the assets they own. They cannot escape extreme poverty because of structural inequalities and because of risks and vulnerabilities. Inverting these problems or obstacles allows us to envision desired outcomes: asset building and maintenance, equality, and resil-ience-which is a necessary precondition for helping people exit extreme poverty and hunger.
Learning from Tahoua Region, Niger
In Niger, where Concern has been working for over a decade, more than 300,000 children are treated for malnutrition and between 1 million and 3 million people suffer from food insecurity on average each year. The livelihoods of the poorest are under enormous pressure from constant environmental degradation, advanced desertification, regular pest invasions and inadequate response to shorter recurrent drought cycles. Repetitive shocks have impoverished rural households. Chronic malnutrition is endemic and has increased over the last 20 years. One in three harvests is generally poor. Farmers and agro-pastoralists are the most affected as they often cannot meet their food needs for the five-month hunger period between May and September.
Between April 2010 and September 2012, Concern responded to several nutrition crises in this region while conducting three research projects over the course of three hunger seasons: April-December 2010 (Aker et al. 2011), May-December 2011 (Aker and Nene 2012), and July-September 2012 (Bliss 2012). These interventions and research studies focused on the impact of cash transfers on both nutritional and wider poverty outcomes. A deeper inquiry into the link between cash transfers and nutritional outcomes led to these insights from Niger:
1. Cash transfers seem to improve nutritional outcomes in the short term because they lead to more frequent meals for children and more legume consumption. A large portion of cash transfers are spent on household food. Clearly, food expenditures depend on the availability of food. Therefore, whether food or cash is needed depends on local conditions.
2. If the goal of a program is to improve or maintain nutritional status, cash transfers should be integrated with other interventions that address the causes of malnutrition and food insecurity.
3. Nutrition and food security indicators such as the number of hunger days, dietary diversity scores, or the global acute malnutrition rate should be developed and monitored to track cash transfers' many uses and to measure the success of the program.
These insights in turn led to the realization that both cash transfers and nutrition treatment programs that focused on seasonal hunger needs were not enough to create resilience to periodic hunger crises and that longer-term development interventions focused on building absorptive and adaptive coping strategies would be required. This learning continues to inform our programming and practice in Niger and beyond.
Concern's Program Areas in Niger, Chad, Ethiopia, and Kenya
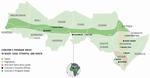
Click on image to enlargeSource: Concern Worldwide based on official maps.
Learning from Wollo and Wolayta, Ethiopia
In the Dessie Zuria woreda, or district, South Wollo Zone, Amhara Region, the stunting rate is 54 percent, higher than the national average of 44 percent. The woreda is chronically food insecure, with approximately 40 percent of the population dependent on social safety nets. Between 2000 and 2010, annual surveys show the prevalence of global acute malnutrition dropped only once to less than 10 percent.
Rural livelihoods, especially of the extreme poor, are often vulnerable to risks and shocks. Climate variability, human and livestock diseases, pests, flooding and landslides present risks and limit livelihoods. In 2011, 86,359 rural households in Wolayta Zone, Southern Nations, Nationalities, and Peoples' Region (SNNPR), faced critical food shortages for more than six months, and many depended on the government's Productive Safety Net Program (PSNP). These vulnerable communities' major coping mechanisms included PSNP, begging, eating unpalatable wild fruits, and daily labor.
Concern has managed interventions across the relief-development spectrum for many years in Ethiopia, ranging from emergency response to health-system strengthening projects. Over time, Concern staff in Ethiopia have come to understand the need to create resilient communities through multisectoral interventions that align with the Ethiopian government's strategies. This integrated approach has helped strengthen vulnerable communities' adaptive capacity to manage both short-term shocks and stresses that lead to short-term food and nutrition insecurity and long-term trends and changes, such as environmental degradation that result in chronic hunger and malnutrition.
Many important lessons have emerged from our work in Ethiopia:
- Use a multisectoral approach to maximize linkages between nutrition and other sectors such as agriculture, health, gender, and water and sanitation.
- Use existing institutional coordination and administrative arrangements to help promote sustainability and a sense of ownership among all key stakeholders.
- Map resilience outcomes in real time to create evidence for new and better programming, and develop research and innovations that can be shared and used to influence policy change.
- Promote resilient livelihoods by addressing the environmental drivers of risk and using disaster risk reduction technologies and practices for sustainable food production.
- Address gender issues that are critical to achieving resilience. Take into account women's greater vulnerability to disasters (Neumeyer and Plümper 2007), as well as their different roles in fostering a culture of disaster resilience.
- Put a contingency plan in place and define surge capacity to help respond to small-scale disasters or provide an initial response to large-scale disasters. Support local governments with early warning systems, and communicate during even small disasters to ensure that food security is not threatened by the cumulative effects of lesser shocks or stressors.
The above learning from the programs in South Wollo and Wolayta will help to ensure even better outcomes for the people and communities with whom Concern works in Ethiopia in partnership with the government and other stakeholders.
Toribio Hualla Quispee
Colquepata District, Peru"I remember that in 2010 we suffered a lot. First we had heavy rainfall and hailstorms. It rained almost every day, causing our potato crops to become infected with many diseases. In July and August we faced a tough frost season, which affected the wheat and barley and ultimately led to the loss of our crops. We had no food to eat, and you could see the sadness in peoples' faces."
"It is necessary for the young people to return to the wisdom and practices of our ancestors. We need to change our attitude, stop wasting water and burning the prairies, and recover and grow our native varieties because they better resist pests and diseases. Our authorities must be prepared to help us immediately when disasters happen."
Learning from Moyale, Kenya
Concern has implemented an integrated set of initiatives designed to enhance resilience among the pastoralist communities in Moyale District in northern Kenya since 2006. Past droughts, including those in 2006 and 2009, eroded household assets such as livestock and health and left the pastoralist residents of Moyale with fewer coping options. However, the evaluation of Concern's program revealed that Moyale's severe acute malnutrition rates fell by 50 percent in early 2011, when those in neighboring areas rose more than threefold (Table 4.2) (Erasmus, Mpoke, and Yishak 2012). In addition, its global acute malnutrition rate increased by a far smaller amount than nearby districts'.
Several factors helped reduce Moyale District's rate of severe acute malnutrition between 2010 and 2011:
1. The strengthening of resilience at the community level over time through contextually appropriate, multisectoral interventions. These included introduction of dryland farming (alongside pasto-ralism) to grow kale, onions, tomatoes, and fruits; improved irrigation systems; diversification of livestock; rangeland management; mitigation of conflict over pasture access; and improved access to water.
2. The strengthening of government capacity to respond to nutritional crises. This included technical training for the District Health Management Team staff; the creation of technical protocols and quality-of-care oversight systems; adoption of interventions with the highest impact on mortality; improved budgeting; adoption of thresholds, strategies, and protocols for scale up and scale down; and monitoring for signs of scale-up triggers.
3. Early scaling up of high-impact nutrition interventions when warnings were triggered.
4. Coordinating among Concern, the local Kenyan government services, the World Food Programme, and World Vision (which provided an important protective ration of food targeted at malnourished children).
Designing for Community Resilience in Chad
There is much interest in creating systems to build resilience at the community level. Unfortunately rigorous data on the best intervention packages is scarce. To address the evidence gap, Concern is partnering with the Feinstein International Center at Tufts University to rigorously evaluate its Community Resilience to Acute Malnutrition program in eastern Chad and generate evidence to contribute to international discussions on the concept of resilience.
Based on knowledge gained from other programs, in early 2012, Concern designed a three-year program involving water, nutrition, disaster risk reduction, livelihoods, and inequality interventions. The program was developed to improve the overall health, nutrition, and livelihood security of the rural population of Dar Sila in eastern Chad while improving their resilience to shocks.
Between 2005 and 2010, many people in the Dar Sila region were displaced due to conflict on both sides of the Chad-Sudan border. While insecurity has decreased, the region remains vulnerable to food insecurity for many reasons, including unpredictable rainfall patterns, market price hikes, limited community and household assets, and limited alternative livelihood options. The population is susceptible to shocks, having experienced poor harvests in 2009, pockets of flooding in 2010, and significantly below-average harvests again in 2011, due in part to pest attacks and erratic rainfall. These events have depleted stocks and led to food shortages, leaving households vulnerable to future disasters.
TABLE 4.2 CHANGES IN CHILD MALNUTRITION RATES IN THREE DISTRICTS OF KENYA, 2010-2011
District Global acute malnutrition Severe acute malnutrition 2010 rate (%) 2011 rate (%) % change 2010 rate (%) 2011 rate (%) % change Marsabit 13,4 27,1 102 1,3 5.0 285 Wajir North 19,8 27,9 41 1.4 6.8 386 Moyale 12,3 13,7 11 3.0 1.5 -50 Source: Erasmus, Mpoke, and Yishak (2012).
Notes: Global acute malnutrition (GAM) is the proportion of children ages 6-59 months who are severely or moderately wasted according to a standardized weight-to-height ratio and/or have nutritional edema. A GAM prevalence of 15 percent or more among children ages 6-59 months has traditionally been considered a "critical" situation, according to the World Health Organization. Severe acute malnutrition (SAM) is the proportion of children ages 6-59 months who are severely wasted. The 2010 and 2011 nutrition surveys were conducted between April and June.Taking an integrated approach, Concern aims to deliver a range of projects addressing multiple needs, coordinating across sectors to achieve common goals. Success will be measured in terms of household wealth via proxies such as livestock ownership and household assets. In turn, greater wealth is expected to lead to increased dietary diversity, less reliance on negative coping strategies, and increased food security. Improvements in health and nutrition will be measured through improved practices related to child health and behavior, while improvements in water and sanitation will be measured through increased access to potable water and latrines. The impact of the program will be reflected in improvements in the nutritional status of children and maternal health.
The first part of the program aims to provide an integrated package to build long-term community resilience. It focuses on four key intervention areas (Figure 4.2) with social and behavior change as a critical ingredient of all four. Resilience-building components of the program include the following:
1. Improving agricultural production and diversifying livelihoods and assets (promoting conservation agriculture and homestead gardening, improving soil fertility, supporting extension and community animal health workers, and promoting links between farmers and markets).
2. Improving access to health services through community health outreach, community case management and care groups, effective management of moderate acute malnutrition, and stronger management of the formal health system.
3. Increasing access to safe water and promoting improved sanitation and sanitary practices at the community level.
4. Working with community groups at all levels, including establishing overall apex bodies such as Village Development Committees for better governance, to enhance their capacities and to ensure that women participate fully. This will involve working closely with community leaders and trying to change their attitudes and behaviors. One output will be a disaster management plan.
5. Promoting social and behavior change among those Concern works with, across all parts of the program. This includes changing child feeding practices, encouraging better hand-washing techniques, and changing how farmers plant their crops using conservation agriculture techniques.
The second part of the program includes a comprehensive community-based early warning system that identifies thresholds for key indicators that signal the need for an emergency response. In the first instance, the community will activate its own disaster management plans. After that, the program will initiate a response, strengthening capacities for conducting market analysis and nutrition surveys, getting systems in place to scale up cash aid, creating a system for immediate distribution of emergency supplies, creating village maps that identify the most vulnerable to shock, and formulating a strategy to scale up staff capacity. The early warning system links primary data from the household level and local and regional markets with rainfall and vegetation data from the Famine Early Warning Systems Network, a provider of information on food security. Data will include the Rainfall Estimation and Normalized Difference Vegetation Index (FEWS NET 2013), which is updated every 10 days. Existing health facility data, such as case incidence and admission rates, will also be used.
FIGURE 4.2 LINKING HUMANITARIAN AND DEVELOPMENT PROGRAMMING IN AN INTEGRATED MANNER
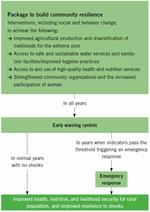
Click on image to enlargeSource: Concern Worldwide.
Primary data will be collected on key food crop prices from a selection of markets and from a Coping Strategies Index that will be calculated on the basis of a sample of households. This will be based on four kinds of locally relevant coping strategies (Maxwell and Caldwell 2008): (1) dietary change; (2) short-term measures to increase household food availability; (3) short-term measures, such as fostering arrangements or sending children to relatives, to decrease the number of people a household must feed; and (4) rationing, or managing the shortfall.
This program will be implemented in 53 of the 88 villages of Kimiti. Thirty-five of these will receive the same package of services and will be rigorously monitored to test the success of the program. Eighteen will receive various elements of the program, in some instances as part of a pilot for new interventions. The remaining 35 villages will receive the benefits of the strengthened government health system in the area and will be included in the early warning system. They will also be surveyed to demonstrate that the intervention has worked. If these villages pass the emergency response threshold, Concern will intervene.
When early warning indicator values, which include rainfall and vegetation measures, exceed a threshold level, an emergency response is triggered. The goal of Concern's resilience-building package is to minimize the impact of the shock by reducing the number of hunger days, reducing the number of people with global acute malnutrition, and speeding up recovery time. The provision of an integrated package should have a positive impact on child and maternal nutrition in a "normal" year but also in those years when the region experiences comprehensive weather-related shocks. This happens about once every three years.
Figure 4.3 shows the expected impact of this program. The red line represents the values for one of Concern's early warning indicators in a normal year. This indicator fluctuates on a seasonal basis and may come close to the intervention threshold, represented by the dashed line. Once this threshold is exceeded (probably about once every three years), an emergency intervention is considered. The value of the indicator may spike in the control area (orange line), but Concern's resilience-building package should reduce the magnitude and duration of the spike in the treatment area (green line).
Collaborative Resilience Programming
When designing programs to build community resilience to undernutrition, context is everything. It is important to use a framework or a set of principles that can be applied to each context that ensures that interventions are responsive to environmental idiosyncrasies as well as cultural issues. Concern has recognized that program managers tend to focus on the practical and tangible issues, while not paying enough attention to the deeper and more difficult-to-resolve issues of process, power, inequality, and to a large extent, the transformation of institutions.
FIGURE 4.3 CONCERN WORLDWIDE'S APPROACH TO IMPROVING COMMUNITY RESILIENCE
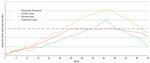
Click on image to enlargeSource: Authors.
Note: The selected early warning indicator could be, for example, the Coping Strategies Index or the price of a key staple crop.FIGURE 4.4 CONTINUUM OF COLLABORATIVE PROGRAMMING
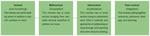
Click on image to enlargeSource: Adapted from Harris and Drimie (2012).
Resilience cannot be built in a bubble. It requires multidis-ciplinary thinking and multisectoral approaches. It also has to work at multiple levels, linking community institutions and governance with district governance and service delivery and national-level policies and strategies.
It is important to be clear about what integration means. In Zambia, Concern's efforts to support collaboration across various ministries to reduce stunting faced significant institutional inertia. Clarifying how community resilience links with sectoral plans is critical here, if some entity is to take ownership of nutritional outcomes. Helping sectoral ministries understand and agree on their form of collaboration (Figure 4.4) is a key part of this. Nutritional outcomes, defined in a country's national nutrition plan, and aligned with the Scaling Up Nutrition guidelines, should be a major driver of collaborative work (SUN 2013).
Conclusion
Community resilience is an outcome. It is about a community's ability or capacity to anticipate, respond to, cope with, and recover from the effects of shocks and stresses without resorting to behaviors that negatively affect well-being or compromise its long-term prospects of moving out of poverty and hunger. Preventing local food and nutrition crises requires communities to analyze the crises' underlying causes and to be involved in the design and implementation of initiatives to address those problems (Box 4.2).
Recognizing more recent initiatives across both regions, including Supporting the Horn of Africa's Resilience (SHARE) and the Global Alliance for Resilience Initiative (AGIR), the current approach to chronic food crises in the Sahel and the Horn of Africa remains fragmented, dysfunctional, and ineffective. In countries like Haiti, shattered by regular natural disasters, the framework is only just becoming part of the conversation. To date, such crises have not been analyzed sufficiently with a resilience lens.
By encouraging systems-based thinking, the concept of resilience may radically transform the compartmentalized ways in which humanitarian and development actors work. Building resilience requires an integrated approach across issues, sectors, and disciplines. Such a collaborative multisectoral approach, and the creation of environments that promote such thinking and practices, are important steps toward improving our collective impact on undernutrition in the most difficult contexts.
BOX 4.2 SOME PRINCIPLES FOR DESIGNING RESILIENCE PROGRAMS These guiding principles may help make resilience program design more practical:
- Undertake systematic risk analysis including analysis and planning for future uncertainty and worst-case scenarios.
- Reduce the causes of vulnerability by building assets and supporting sustainable livelihoods.
- Address drivers of inequality.
- Build up communities' absorptive and adaptive capacities, including better access to safety nets and social protection.
- Support enhanced capacity for effective and timely emergency responses.
- Build institutions for governance, and instill a culture of innovation and learning.
These recommendations are addressed to players with direct influence on policies and programs related to resilience. Civil society and media should monitor and evaluate the use of the resilience lens in the actions of these key players and collect evidence on outcomes.
Recommendations for the International Development, Humanitarian, and Donor Communities
Resilience is not a panacea. Its definition and application will involve choices. While most such choices should work for the poorest and most vulnerable, some may not. The international development and donor communities need to be clear about definitions, try to find a consensus with others, and spell out why a resilience approach will allow them to advance their respective development and humanitarian goals. Once they have agreed upon a joint vision for resilient policy and programming in a specific context, donors should align with it.
1. A resilience lens shines a bright light on the missed opportunities and the sometimes counterproductive separation of the worlds of development and humanitarian assistance. The institutional, financial, and conceptual walls separating the worlds of development and humanitarian assistance within donor and UN agencies need to be broken down to achieve greater synergies in strategies and implementation plans.
2. Broader policy coherence for development is also a key requirement for efforts to strengthen resilience. Policies that undermine resilience must be revised. To foster resilience to undernutrition, policies should be designed with the intention of improving nutrition outcomes and realizing the right to adequate food.
3. To support a pro-poor resilience approach, create multiannual, flexible mechanisms and funding that facilitate multisectoral approaches to tackling chronic food and nutrition crises and addressing the structural causes of food and nutrition insecurity at the regional and country level.
4. Communicate to key stakeholders and to the wider public the potential cost-effectiveness of building resilience and improving food and nutrition security, particularly in fragile contexts.
5. Support a coordinated approach to monitoring resilience-building measures in different contexts and building an evidence base on the impact and effectiveness of such measures. As part of this effort, indicators of resilience need to capture adequate information at appropriate times and frequencies.
- Invest in real time, high-frequency data collection at different levels (individual, household, community, environment) and among different socioeconomic and ethnic groups.
- Establish sentinel sites in the countries that are most shock-prone, poor, and dependent on humanitarian assistance, where data on nutrition, food security, and coping behaviors could be collected every one to three months.
6. Review the effectiveness of early warning systems in order to identify and address the key institutional, especially political, obstacles to early action. Put in place policy responses to the lessons learned from such a review or reviews.
7. Donors should direct more development funding to disaster risk reduction and resilience-building interventions, including better-targeted productive safety nets, with either clear percentage targets or other funding weighting criteria applied. |1| Capacity-building interventions and costs in fragile and conflict-affected states need to be factored in.
Rose Akech
Lira District, Uganda"I and my family were affected by drought in the first rainy season of 2013.... The negative effect of drought on my family was huge, especially on my children.... It is becoming increasingly difficult to provide for food and pay school fees. I have struggled to pay school fees for the first and second term of 2013, and I foresee the challenge of higher school fees in the future...."
"I think that all households should adopt the practice of planting drought-resistant crops such as cassava, sorghum, and peas to minimize droughts' effects in the short to medium term. And I think that the government and NGOs should provide simple and affordable rain-harvesting and irrigation technologies to farmers, as this would help farmers to respond to such hazards."
Adrona Kyalimpa
Kabarole District, Uganda"After the death of my husband, my in-laws divided the land among themselves, and I was given a very small piece--yet I had eight children to look after.... My sisters-in-law sold off their shares and returned to their homes for they were married. The last two seasons were not good. My crops were destroyed by the dry season, and the banana plantation was badly affected by the heavy storm.... "
"The government should have zero tolerance for corruption. Grants have never been distributed fairly. Items like goats and cows are given to those who are rich and known to those distributing them, especially politicians. That is very annoying to people like me who deserve such items."
Jonathan Nturo Employee of Welthungerhilfe, Rwanda
"Before the implementation of the rice policy, the price was high at 300 Rwandan francs (RWF) per kilo, but now the price has been fixed by the Ministry of Commerce at 255 RWF per kilo. In addition, training in planning and budgeting, as well as in creating business plans, in all supported cooperatives is important to increase yield per hectare and handle the market price."
Recommendations for Country-Level Policymakers in Food-Insecure Countries
8. Develop national approaches to food and nutrition security that are resilient to shocks and other stresses. Ensure that external and international actors buy into those approaches and support them. External actors should work with national actors to develop context-specific tools for analyzing, measuring, and assessing resilience.
9. Encourage and facilitate a multisectoral approach to resilience (as the Scaling Up Nutrition movement encourages a multisec-toral approach to nutrition, for example), coordinating plans and programs across line ministries. Evaluate national sectoral strategies and action plans using disaster-proofing and resilience-building lenses.
10. Put in place policies that strengthen resilience to undernutrition, such as tenure security for smallholder farmers, and adjust policies and strategies that undermine the resilience of poor and vulnerable groups, such as the low import tariffs or the structural neglect of smallholder agriculture in Haiti.
11. Ensure that policies and programs draw on a wide range of expertise such as collaborative, multiagency, and multisectoral problem analysis. National governments should support the emergence of multistakeholder platforms and make active use of such forums. In particular, people suffering from a lack of resilience to shocks and stresses that affect their food and nutrition security should be consulted. It is essential that wherever possible, efforts to strengthen resilience should build on the empowering mechanisms and institutions they suggest.
Recommendations for Development and Humanitarian Practitioners
12. A resilience perspective can encourage development programming that factors in uncertainty and volatility and humanitarian programming that works toward sustainable development. Some programs can incorporate both objectives by (1) first providing relief, and then seeking to gradually build individual, household, and community assets or by (2) building assets in normal times but incorporating financial and operational flexibility into programs to allow them to switch quickly to relief operations when shocks hit.
13. Development programs aiming to enhance resilience should build local capacities and strengthen local structures. It is those structures that have the potential to provide the most effective and timely support when shocks and stresses strike. Emergency programs should not work in parallel with these structures, but rather work with and build on them to avoid locking communities and countries into a humanitarian approach.
14. Support positive coping mechanisms that people already use. For example, strengthen community-level saving networks or banks that play a large role in promoting development and providing relief from shocks.
15. Nongovernmental organizations and their national partners should use their long-term experience in development programming more proactively to lobby for resilience-enhancing policy change.
16. Poor nutrition in early childhood (especially during the 1,000 days from conception through age two) reduces resilience because it can have long-term and irreversible effects on the cognitive and physical development of children and their future earning capacity as adults. The humanitarian and development communities should thus focus on improving maternal and child nutrition in developing regions, with both nutrition-specific interventions to address the immediate causes of undernutrition and nutrition-sensitive interventions to address the underlying causes. Nutrition indicators as specified by the World Health Assembly targets should be used to assess nutrition-specific and nutrition-sensitive programs and funding schemes. |2|
Ernestina Amwon
Lira District, Uganda"I suggest that the government put emphasis on controlling population growth since it has a direct effect on how much land can be cultivated and the amount of food available during a food crisis. Households with 4-5 members are more manageable during a food crisis than those with 8-15 members."
Raimati Kadraka
Rayagada District, India"Our crop diversity increased from 14 to 42 due to the revival of millet-based mixed cropping. It strengthens our resilience to climate change. We rejected non-renewable hybrid seeds and synthetic chemical inputs, provided for free by the government ... and NGOs. We reduced our dependence on external agricultural inputs.... We are watching our debts go down and the net yield of our farm increase."
Muhammad Amin
Old Mankial Swat Village, Pakistan"For my children to have a better future, we need to raise their awareness and educate them on disaster mitigation and management. I believe that community conflicts over forests, agricultural land, and misuse of natural resources led to disasters like floods. I want to resolve them and show a commitment to controlling deforestation."
[Source: International Food Policy Research Institute, Institute of Development Studies, Concern Worldwide, Welthungerlife, Bonn, Washington, DC, Dublin, Oct13]
APPENDIXES
A/ Data Sources and Calculation of the 1990, 1995, 2000, 2005, and 2013 Global Hunger Index Scores
All three index components are expressed in percentages and weighted equally. Higher GHI scores indicate more hunger. The index varies between a minimum of 0 and a maximum of 100, but these extremes do not occur in practice. The maximum value of 100 would be reached only if all children died before their fifth birthday, the whole population was undernourished, and all children under five were underweight. The minimum value of zero would mean that a country had no undernourished people in the population, no children under five who were underweight, and no children who died before their fifth birthday. The table below provides an overview of the data sources for the Global Hunger Index.
THE GLOBAL HUNGER INDEX IS CALCULATED AS FOLLOWS: GHI = (PUN + CUW + CM)/3
with GHI: Global Hunger Index
PUN: proportion of the population that is undernourished (in %)
CUW: prevalence of underweight in children younger than five (in %)
CM: proportion of children dying before the age of five (in %)GLOBAL HUNGER INDEX COMPONENTS, 1990, 1995, 2000, 2005, AND 2013 GHI SCORES
GHI Number of countries with GHI Indicators Reference years Data sources 1990 97 Percentage of undernourished in the population |a| 1990-1992 |b| FAO 2013a and authors' estimates Prevalence of underweight in children under five 1988-1992 |c| WHO 2013 and authors' estimates Under-five mortality 1990 IGME 2012 1995 117 Percentage of undernourished in the population |a| 1994-1996 |b| FAO 2013a and authors' estimates Prevalence of underweight in children under five 1993-1997 |d| WHO 2013; UNICEF/WHO/World Bank 2012; |e| and authors' estimates Under-five mortality 1995 IGME 2012 2000 117 Percentage of undernourished in the population |a| 1999-2001 |b| FAO 2013a and authors' estimates Prevalence of underweight in children under five 1998-2002 |f| WHO 2013 and authors' estimates Under-five mortality 2000 IGME 2012 2005 118 Percentage of undernourished in the population |a| 2004-2006 |b| FAO 2013a and authors' estimates Prevalence of underweight in children under five 2003-2007 |g| WHO 2013; UNICEF 2013b; UNICEF 2009; |e| and authors' estimates Under-five mortality 2005 IGME 2012 2013 120 Percentage of undernourished in the population |a| 2010-2012 |b| FAO 2013a and authors' estimates Prevalence of underweight in children under five 2008-2012 |h| WHO 2013; UNICEF 2013a, b; MEASURE DHS 2013; UNICEF/WHO/World Bank 2012; |e| and authors' estimates Under-five mortality 2011 IGME 2012
B/ Data Underlying the Calculation of the 1990, 1995, 2000, 2005, and 2013 GHI Scores
Country Proportion of undernourished in the population (%) Prevalence of underweight in children under five years (%) Under-five mortality rate (%) GHI '90-'92 '94-'96 '99-'01 '04-'06 '10-'12 '88-'92 '93-'97 '98-'02 '03-'07 '08-'12 1990 1995 2000 2005 2011 1990 1995 2000 2005 2013 with data from
1988-92 1993-97 1998-02 2003-07 2008-12 Afghanistan - - - - - - 44.9 31.3* 32.8 25.0 19.2 15.8 136. 11.9 10.1 - - - - - Albania 9.0* 2.4* 3.8* 9.7* 7.8* 14.5* 12.1* 17.0 6.6 6.3 4.1 3.5 2.6 2.0 1.4 9.2 6.0 7.8 6.1 5.2 Algeria 5.2 6.4 5.8 5.0* 3.7* 9.2 11.3 5.4 3.7 5.7* 6.6 5.5 4.6 3.8 3.0 7.0 7.7 5.3 <5 <5 Angola 63.9 56.4 47.5 35.1 27.4 30.4* 37.0 27.5 15.1 14.1* 24.3 22.2 19.9 17.9 15.8 39.5 38.5 31.6 22.7 19.1 Argentina 2.1* 1.2* 0.9* 1.9* 4.0* 3.5* 3.2 2.3* 2.3 1.8* 2.8 2.3 2.0 1.7 1.4 <5 <5 <5 <5 <5 Armenia - 21.3 19.0 5.4 3.0* - 5.4* 2.6 4.2 5.3 - 3.8 3.0 2.3 1.8 - 10.2 8.2 <5 <5 Azerbaijan - 26.3 14.7 2.2* 1.5* - 8.8 14.0 8.4 3.3* - 8.4 6.9 5.7 4.5 - 14.5 11.9 5.4 <5 Bahrain - - - - - 6.3 7.6 5.6* 6.3* 6.6* 2.1 1.6 1.2 1.1 1.0 - - - - - Bangladesh 34.6 36.3 18.4 15.1 16.8 61.5 58.0 45.3 39.2 36.8 13.9 11.1 8.4 6.4 4.6 36.7 35.1 24.0 20.2 19.4 Belarus - 1.1* 2.3* 2.8* 0.4* - 1.5* 1.0 1.3 0.9* - 1.7 1.4 0.9 0.6 - <5 <5 <5 <5 Benin 22.4 18.7 16.4 13.1 8.1 27.3* 26.8 21.5 20.2 21.2* 17.7 15.9 14.0 12.3 10.6 22.5 20.5 17.3 15.2 13.3 Bhutan - - - - - 34.0 26.1* 14.1 14.6* 12.8 13.8 11.2 8.9 7.1 5.4 - - - - - Bolivia 34.6 30.7 28.7 29.1 24.1 9.7 10.0 5.9 5.9 4.5 12.0 10.0 8.1 6.5 5.1 18.8 16.9 14.2 13.8 11.2 Bosnia&Herzegovina - 6.4* 6.3* 2.1* 2.8* - 4.1* 4.2 1.6 1.6 - 1.3 1.0 0.9 0.8 - <5 <5 <5 <5 Botswana 27.4 29.3 34.5 32.9 27.9 17.8* 15.1 10.7 11.4* 11.2 5.3 6.5 8.1 4.6 2.6 16.8 17.0 17.8 16.3 13.9 Brazil 14.9 13.5 12.1 8.7 6.9 5.3 4.5 3.6* 3.0 3.0* 5.8 4.8 3.6 2.5 1.6 8.7 7.6 6.4 <5 <5 Bulgaria 3.5* 7.8* 7.0* 7.9* 6.9* 2.1* 2.6* 2.3* 2.2 1.6* 2.2 2.3 2.1 1.6 1.2 <5 <5 <5 <5 <5 Burkina Faso 22.9 18.6 26.4 25.8 25.9 36.9* 29.6 33.7 37.6 26.2 20.8 19.9 18.2 16.5 14.6 26.9 22.7 26.1 26.6 22.2 Burundi 49.0 58.4 63.0 67.9 73.4 34.2* 38.3* 38.9 35.2 29.1 18.3 17.7 16.5 15.3 13.9 33.8 38.1 39.5 39.5 38.8 Cambodia 39.9 37.7 33.8 27.4 17.1 44.9* 42.6 39.5 28.4 29.0 11.7 11.9 10.2 6.9 4.3 32.2 30.7 27.8 20.9 16.8 Cameroon 38.7 37.3 29.1 19.5 15.7 1.0 20.0* 17.8 15.9 15.1 14.5 14.1 14.0 13.6 12.7 23.7 23.8 20.3 16.3 14.5 Central African Rep. 49.5 50.6 45.1 40.6 30.0 25.7* 20.4 21.8 28.0 23.5 16.9 17.3 17.2 17.0 16.4 30.7 39.4 28.0 28.5 23.3 Chad 61.1 50.5 41.0 37.3 33.4 34.6* 34.3 29.4 33.9 30.3 20.8 19.8 18.9 18.0 16.9 38.8 34.9 29.8 29.7 26.9 Chile 8.1 5.6 4.4* 3.2* 3.7* 1.0* 0.8 0.7 0.6 0.5 1.9 1.4 1.1 0.9 0.9 <5 <5 <5 <5 <5 China 21.4 15.9 14.4 13.1 11.5 12.6 10.7 7.4 4.5 3.4 4.9 4.6 3.5 2.4 1.5 13.0 10.4 8.4 6.7 5.5 Colombia 19.1 14.7 13.0 13.6 12.6 8.8 6.3 4.9 5.1 3.4 3.4 2.9 2.5 2.1 1.8 10.4 8.0 6.8 6.9 5.9 Comoros 43.5 49.1 64.8 58.1 70.0 16.2 22.3 25.0 22.1 22.8* 12.2 11.0 10.0 9.1 7.9 24.0 27.5 33.3 29.8 33.6 Congo, Dem. Rep. - - - - - 21.4* 30.7 33.6 28.2 24.2 18.1 18.1 18.1 18.1 16.8 - - - - - Congo. Rep. 42.8 44.7 30.1 32.9 37.4 16.4* 15.8* 17.0* 11.8 14.1* 11.9 11.3 10.9 10.4 9.9 23.7 23.9 19.3 18.4 20.5 Costa Rica 4.0* 5.0 4.4* 5.0* 6.5 2.5 3.2 1.6* 1.3* 1.1 1.7 1.5 1.3 1.1 1.0 <5 <5 <5 <5 <5 Croatia - 14.6* 11.6* 2.1* 1.5* - 0.5 0.5* 0.3* 0.3* - 1.0 0.8 0.7 0.5 - 5.4 <5 <5 <5 Cuba 11.5 16.1 2.8* 1.1* 0.6* 3.6* 5.0* 3.4 3.5 3.3* 1.3 1.1 0.9 0.7 0.6 5.5 7.4 <5 <5 <5 Côte d'Ivoire 13.7 14.0 19.9 19.6 21.4 20.0* 20.9 18.2 16.7 15.4 15.1 14.6 13.9 12.8 11.5 16.3 16.5 17.3 16.4 16.1 Djibouti 68.0 58.1 47.1 32.6 19.8 20.2 16.0 25.4 29.6 29.8 12.2 11.3 10.6 9.8 9.0 33.5 28.5 27.7 24.0 19.5 Dominican Republic 30.4 25.7 21.6 18.6 15.4 8.4 4.7 3.5 4.6 3.1* 5.8 4.7 3.9 3.2 2.5 14.9 11.7 9.7 8.8 7.0 Ecuador 24.5 18.5 20.9 21.4 18.3 12.2* 12.0* 12.5 6.2 5.0* 5.2 4.2 3.4 2.8 2.3 14.0 11.6 12.3 10.1 8.5 Egypt, Arab Rep. 2.0* 1.6* 1.5* 2.2* 1.6* 10.5 10.8 9.8 5.4 6.8 8.6 6.2 4.4 3.2 2.1 7.0 6.2 5.2 <5 <5 El Salvador 15.6 14.2 9.2 10.6 12.3 11.1 7.2 9.6 6.1 6.6 6.0 4.7 3.4 2.4 1.5 10.9 8.7 7.4 6.4 6.8 Eritrea - 71.8 76.2 74.8 65.4 - 38.3 34.5 34.8* 32.8* - 11.6 9.8 8.3 6.8 - 40.6 40.2 39.3 35.0 Estonia - 6.4* 4.3* 4.3* 3.2* - 1.0* 1.0* 0.9* 2.3* - 1.5 1.1 0.7 0.4 - <5 <5 <5 <5 Ethiopia 68.0 67.2 55.3 47.7 40.2 39.2 43.9* 42.0 34.6 29.2 19.8 17.0 13.9 10.7 7.7 42.3 42.7 37.1 31.0 25.7 Fiji 6.2 5.7 4.8* 2.9* 3.8* 8.1* 6.9 5.6* 4.0* 5.8* 3.0 2.6 2.2 2.0 1.6 5.8 5.1 <5 <5 <5 Gabon 10.1 7.5 6.3 5.8 6.5 9.7* 7.8* 8.8 7.2* 8.6* 9.4 8.7 8.2 7.7 6.6 9.7 8.0 7.8 6.9 7.2 Gambia, The 19.5 23.2 19.8 19.3 14.4 21.3* 23.2 15.4 15.8 17.4 16.5 14.7 13.0 11.6 10.1 19.1 20.4 16.1 15.6 14.0 Georgia - 42.3 21.5 28.9 24.7 - 3.5* 2.7 2.3 1.1 - 4.0 3.3 2.6 2.1 - 16.6 9.2 11.3 9.3 Ghana 40.5 22.7 16.6 9.5 3.4* 24.0 25.1 20.3 13.9 13.4 12.1 10.9 9.9 8.8 7.8 25.5 19.6 15.6 10.7 8.2 Guatemala 16.2 20.5 26.5 29.9 30.4 21.1* 21.7 19.6 17.3* 13.0 7.8 6.0 4.8 3.9 3.0 15.0 16.1 17.0 17.0 15.5 Guinea 18.4 22.1 20.6 17.0 17.3 23.0* 21.2 29.1 22.5 20.8 22.8 20.2 17.5 15.0 12.6 21.4 21.2 22.4 18.2 16.9 Guinea-Bissau 22.0 23.1 21.4 18.5 8.7 22.0* 19.4* 21.9 17.4 18.1 21.0 19.9 18.6 17.3 16.1 21.7 20.8 20.6 17.7 14.3 Guyana 19.7 11.9 7.9 9.0 5.1 17.0* 13.2 11.9 10.8 11.1 6.3 5.6 4.9 4.3 3.6 14.3 10.2 8.2 8.0 6.6 Haiti 63.5 59.1 53.0 53.5 44.5 23.7 24.0 13.9 18.9 18.4* 14.3 12.1 10.2 8.6 7.0 33.8 31.7 25.7 27.0 23.3 Honduras 21.4 18.6 16.3 14.2 9.6 15.8 17.7 12.5 8.6 12.1* 5.5 4.4 3.5 2.8 2.1 14.2 13.6 10.8 8.5 7.9 India 26.9 25.2 21.3 20.9 17.5 59.5 45.9 44.4 43.5 40.2* 11.4 10.1 8.8 7.5 6.1 32.6 27.1 24.8 24.0 21.3 Indonesia 19.9 15.2 17.8 15.1 8.6 31.0 28.9 23.3 24.4 18.6 8.2 6.5 5.3 4.2 3.2 19.7 16.9 15.5 14.6 10.1 Iran, Islamic Rep. 3.4* 3.5* 4.3* 5.8 5.0* 16.0* 13.8 9.5 4.6 4.1* 6.1 4.9 4.4 3.4 2.5 8.5 7.4 6.1 <5 <5 Iraq - - - - - 10.4 - 12.9 7.6 8.5 4.6 4.5 4.3 4.1 3.8 - - - - - Jamaica 9.0 8.1 6.9 7.0 8.7 5.2 4.0 3.8 3.4 3.2 3.5 3.0 2.6 2.4 2.1 5.9 5.0 <5 <5 <5 Jordan 6.7 8.6 6.1 2.9* 3.7* 4.8 3.8 3.6 1.9* 1.9 3.7 3.2 2.8 2.4 2.1 5.1 5.2 <5 <5 <5 Kazakhstan - 0.8* 8.0 1.0* 0.5* - 6.7 3.8 4.9 3.7 - 5.1 4.2 3.5 2.8 - <5 5.3 <5 <5 Kenya 35.6 31.9 32.8 32.9 30.4 18.7* 19.8 17.5 18.4 16.4 9.8 11.2 11.3 9.4 7.3 21.4 21.0 20.5 20.2 18.0 Kuwait 28.7 4.8* 1.6* 0.9* 1.6* 6.7* 9.2 2.2 2.7 1.7 1.7 1.4 1.3 1.2 1.1 12.4 5.1 <5 <5 <5 Kyrgyz Republic - 13.8 15.8 9.4 6.4 - 8.2 5.8* 2.7 3.5* - 5.8 4.7 3.9 3.1 - 9.3 8.8 5.3 <5 Lao PDR 44.6 44.1 39.5 33.4 27.8 40.9* 35.9 36.4 31.6 24.2* 14.8 11.0 8.1 6.0 4.2 33.4 30.3 28.0 23.7 18.7 Latvia - 2.0* 5.6* 3.2* 4.1* - 0.7* 1.2* 1.0* 2.6* - 2.3 1.7 1.3 0.8 - <5 <5 <5 <5 Lebanon 3.5* 4.0* 3.5* 3.3* 3.1* 5.9* 3.5 4.0* 4.2 2.8* 3.3 2.6 1.9 1.4 0.9 <5 <5 <5 <5 <5 Lesotho 16.9 18.0 17.1 16.3 16.6 13.8 16.4 15.1 16.6 13.5 8.8 9.4 11.7 11.9 8.6 13.2 14.6 14.6 14.9 12.9 Liberia 32.9 39.2 34.9 29.6 31.4 13.3* 23.4* 22.8 20.4 14.4 24.1 21.9 16.4 11.7 7.8 23.4 28.2 24.7 20.6 17.9 Libya 1.0* 1.2* 1.6* 1.4* 1.8* 7.7* 4.3 4.5* 5.6 5.7* 4.4 3.5 2.7 2.2 1.6 <5 <5 <5 <5 <5 Lithuania - 4.0* 2.3* 1.5* 1.1* - 1.1* 0.8* 0.8* 2.4* - 1.6 1.2 0.9 0.6 - <5 <5 <5 <5 Macedonia, FYR - 12.3* 6.8* 4.5* 4.7* - 2.5* 1.9 1.8 1.3 - 2.5 1.6 1.3 1.0 - 5.8 <5 <5 <5 Madagascar 24.8 30.3 32.4 28.1 33.4 35.5 30.4 35.0* 36.8 36.0* 16.1 13.2 10.4 8.2 6.2 25.5 24.6 25.9 24.4 25.2 Malawi 44.8 35.8 26.8 24.7 23.1 24.4 26.5 21.5 18.4 13.8 22.7 20.4 16.4 12.9 8.3 30.6 27.6 21.6 18.7 15.1 Malaysia 4.6* 2.2* 2.9* 3.5* 3.0* 22.1 17.7 16.7 12.9 12.7* 1.7 1.3 1.1 0.9 0.7 9.5 7.1 6.9 5.8 5.5 Mali 25.3 26.1 21.5 14. 7 7.9 31.2* 31.0 30.1 27.9 18.9 25.7 23.5 21.4 19..6 17.6 27.4 26.9 24.3 20.7 14.8 Mauritania 12.4 10.5 9.4 8.9 9.3 43.3 25.9* 30.4 23.2 19.0 12.5 12.1 11.8 11.6 11.2 22.7 16.2 17.2 14.6 13.2 Mauritius 8.6 7.5 6.5 5.9 5.7 14.4* 13.0 11.2* 10.1* 8.3* 2.4 2.2 1.9 1.6 1.5 8.5 7.6 6.5 5.9 5.2 Mexico 3.3* 3.2* 3.1* 0.1* 2.1* 13.9 10.3 6.0 3.4 2.8 4.9 3.9 2.9 2.2 1.6 7.4 5.8 <5 <5 <5 Moldova - 15.4* 19.8* 16.6* 23.3* - 4.7* 4.3* 3.2 2.6* - 2.9 2.4 2.0 .6 - 7.7 8.8 7.3 9.2 Mongolia 37.5 48.5 37.6 32.5 24.2 10.8 13.8* 11.6 5.3 5.0 10.7 8.4 6.3 4.6 3.1 19.7 23.6 18.5 14.1 10.8 Montenegro - - - - 2.8* - - - - 1.5* - - - - 0.7 - - - - <5 Morocco 7.1 6.5 6.2 5.2 5.5 8.1 7.7 7.0* 9.9 3.1 8.1 6.6 5.3 4.3 3.3 7.8 6.9 6.2 6.5 <5 Mozambique 57.1 51.7 45.3 40.3 39.2 28.3* 23.9 23.0 21.2 14.9 22.6 20.5 17.2 13.9 10.3 36.0 32.0 28.5 25.1 21.5 Myanmar - - - - - 28.8 38.7 30.1 29.6 22.6 10.7 9.5 8.4 7.3 6.2 - - - - - Namibia 37.5 37.2 24.9 26.8 33.9 21.5 21.6* 20.3 17.5 17.2* 7.3 6.8 7.4 6.9 4.2 22.1 21.9 17.5 17.1 18.4 Nepal 25.9 27.1 24.5 21.7 18.0 44.6* 44.1 43.0 38.8 29.1 13.5 10.6 8.3 6.5 4.8 28.0 27.3 25.3 22.3 17.3 Nicaragua 55.1 44.9 34.3 26.7 20.1 10.5* 9.6 7.8 4.3 5.8* 6.6 5.3 4.2 3.4 2.6 24.1 19.9 15.4 11.5 9.5 Niger 36.9 36.3 25.8 20.0 12.6 41.0 40.7* 43.6 39.9 35.7 31.4 26.7 21.6 16.9 12.5 36.4 34.6 30.3 25.6 20.3 Nigeria 19.3 11.7 10.2 6.8 8.5 35.1 35.1 24.7 26.5 24.2 21.4 21.1 18.8 15.6 12.4 25.3 22.6 17.9 16.3 15.0 North Korea 25.4 33.1 37.0 36.1 32.0 26.4* 27.1* 24.7 20.6 18.8 4.5 7.6 5.8 3.2 3.3 18.8 22.6 22.5 20.0 18.0 Oman - - - - - 21.4 10.0 11.3 11.6* 8.6 4.8 3.3 2.2 1.4 0.9 - - - - - Pakistan 26.4 23.2 24.0 22.8 19.9 39.0 34.2 31.3 32.4* 30.9 12.2 11.0 9.5 8.4 7.2 25.9 22.8 21.6 21.2 19.3 Panama 22.8 23.3 25.7 19.7 10.2 8.8* 6.3 5.9* 5.1 3.9 3.3 2.9 2.6 2.3 2.0 11.6 10.8 11.4 9.0 5.4 Papua New Guinea - - - - - 19.2* 17.8* 17.9* 18.0 14.5* 8.8 7.9 7.2 6.5 5.8 - - - - - Paraguay 19.7 15.3 13.0 12.6 25.5 2.8 2.9* 2.9* 3.4 2.6* 5.3 4.3 3.5 2.9 2.2 9.3 7.5 6.5 6.3 10.1 Peru 32.6 25.7 22.5 21.4 11.2 8.8 5.7 5.2 5.4 3.4 7.5 5.5 3.9 2.8 1.8 16.3 12.3 10.5 9.9 5.5 Philippines 24.2 21.3 20.9 18.0 17.0 29.9 26.3 28.3 20.7 20.2 5.7 4.7 3.9 2.8 1.8 19.9 17.4 17.7 14.0 13.2 Qatar - - - - - - 4.8 - 0.9* 0.7* 2.0 1.6 1.0 1.0 0.8 - - - - - Romania 2.2* 2.1* 1.3* 0.4* 0.4* 5.0 4.6* 3.7 3.0* 2.0* 3.7 3.2 2.7 2.1 1.3 <5 <5 <5 <5 <5 Russian Federation - 5.0* 4.7* 2.0* 1.7* - 2.6 2.3* 0.8* 1.2* - 2.5 2.1 1.7 1.2 - <5 <5 <5 <5 Rwanda 52.6 60.1 46.5 42.1 28.9 24.3 24.2 22.2 18.0 11.7 15.6 27.5 18.3 10.8 5.4 30.8 37.3 29.0 23.6 15.3 Saudi Arabia 3.0* 3.4* 1.3* 2.0* 2.6* 12.3* 12.9 8.5* 5.3 9.3* 4.3 3.0 2.1 1.4 0.9 6.5 6.4 <5 <5 <5 Senegal 21.7 25.7 24.2 16.9 20.5 19.0 19.6 20.3 14.5 14.4 13.6 14.2 13.0 9.7 6.5 18.1 19.8 19.2 13.7 13.8 Serbia - - - - 4.9 - - - - 1.6 - - - - 0.7 - - - - <5 Sierra Leone 41.9 36.2 41.1 35.5 28.8 25.4 26.1* 24.7 28.3 21.1 26.7 26.2 24.1 21.4 18.5 31.3 29.5 30.0 28.4 22.8 Slovak Republic - 3.5* 5.3* 5.4* 4.5* - 1.3* 1.1* 1.0* 2.1* - 1.4 1.2 1.0 0.8 - <5 <5 <5 <5 Somalia - - - - - - - 22.8 32.8 - 18.0 18.0 18.0 18.0 18.0 - - - - - South Africa 5.0* 5.2 4.8* 3.8* 2.9* 10.4* 8.0 10.1 11.6 8.7 6.2 6.2 7.4 7.8 4.7 7.2 6.5 7.4 7.7 5.4 Sri Lanka 33.9 31.3 28.7 27.9 24.0 30.1* 28.3 22.8 21.1 21.6 2.9 2.4 1.9 1.6 1.2 22.3 20.7 17.8 16.9 15.6 Sudan (former) 42.1 32.7 31.7 32.0 39.4 36.7* 31.8 38.4 31.7 32.2 14.5 12.7 11.6 10.5 9.4 31.1 25.7 27.2 24.7 27.0 Suriname 17.7 15.5 17.9 15.7 11.4 10.9* 9.8* 11.4 7.5 5.8 5.2 4.5 4.0 3.5 3.0 11.3 9.9 11.1 8.9 6.7 Swaziland 16.1 22.6 17.7 18.7 27.0 6.9* 7.1* 9.1 6.1 5.8 8.3 9.1 11.4 12.8 10.4 10.4 12.9 12.7 12.5 14.4 Syrian Arab Republic 4.8* 4.1* 3.5* 3.4* 3.2* 14.6* 11.3 6.0 10.0 10.1 3.6 2.8 2.3 1.9 1.5 7.7 6.1 <5 5.1 <5 Tajikistan - 34.0 40.8 34.3 31.7 - 18.4* 17.5* 14.9 11.0* - 11.1 9.5 7.9 6.3 - 21.2 22.6 19.0 16.3 Tanzania 29.4 38.5 40.4 35.1 38.8 25.1 26.9 25.3 16.7 16.2 15.8 15.3 12.6 9.8 6.8 23.4 26.9 26.1 20.5 20.6 Thailand 43.8 33.7 19.6 11.2 7.3 16.6* 15.4 9.1* 7.0 9.0* 3.5 2.3 1.9 1.6 1.2 21.3 17.1 10.2 6.6 5.8 Timor-Leste - - - 28.5 38.2 - - 40.6 41.5 45.3 - - - 7.9 5.4 - - - 20.6 29.6 Togo 32.8 26.8 25.2 20.4 16.5 21.5 16.7 23.2 22.3 16.6 14.7 13.7 12.8 12.0 11.0 23.0 19.1 20.4 18.2 14.7 Trinidad&Tobago 13.6 14.8 13.0 13.3 9.3 7.9* 7.6* 4.4 4.6* 2.6* 3.7 3.4 3.2 3.0 2.8 8.4 8.6 6.9 7.0 <5 Tunisia 0.9* 1.0* 0.7* 0.9* 0.9* 8.5 8.1 3.5 3.3 2.3 5.1 3.9 3.0 2.2 1.6 <5 <5 <5 <5 <5 Turkey 0.5* 0.6* 0.9* 1.0* 0.9* 6.4* 9.0 7.0 3.5 1.7 7.2 5.3 3.5 2.4 1.5 <5 5.0 <5 <5 <5 Turkmenistan - 10.2 8.1 5.5 3.4* - 12.4* 10.5 8.0 5.5* - 8.2 7.1 6.2 5.3 - 10.3 8.6 6.6 <5 Uganda 26.6 30.6 26.5 27.9 34.6 19.7 21.5 19.0 16.4 14.1 17.8 16.6 14.1 11.6 9.0 21.4 22.9 19.9 18.6 19.2 Ukraine - 3.9* 4.2* 1.3* 0.9* - 2.1* 4.1 0.8* 1.2* - 1.9 1.9 1.4 1.0 - <5 <5 <5 <5 Uruguay 7.3 5.1 4.3* 4.6* 5.0* 6.8* 3.9 5.2 6.0 4.5 2.3 2.0 1.7 1.4 1.0 5.5 <5 <5 <5 <5 Uzbekistan - 2.8* 14.7 9.8 6.1 - 15.3 7.1 4.4 5.0* - 6.7 6.1 5.5 4.9 - 8.3 9.3 6.6 5.3 Venezuela, RB 13.5 16.4 15.5 9.7 2.7* 6.7 4.1 3.9 4.1 2.9 3.1 2.6 2.2 1.9 1.5 7.8 7.7 7.2 5.2 <5 Vietnam 46.9 30.6 22.0 15.6 9.0 40.7 40.6 28.9 22.7 12.0 5.0 4.1 3.4 2.8 2.2 30.9 25.1 18.1 13.7 7.7 Yemen, Rep. 28.6 31.0 30.4 31.7 32.4 48.1* 40.9 40.5* 43.1 39.3* 12.6 11.2 9.9 8.8 7.7 29.8 27.7 26.9 27.9 26.5 Zambia 34.3 35.5 43.9 48.3 47.4 21.2 19.6 19.6 14.9 16.7* 19.3 18.4 15.4 12.7 8.3 24.9 24.5 26.3 25.3 24.1 Zimbabwe 44.1 44.8 43.1 38.2 32.8 8.0 11.7 11.5 14.0 10.1 7.9 9.4 10.6 9.4 6.7 20.0 22.0 21.7 20.5 16.5
C/ Country Trends for the 1990, 1995, 2000, 2005, and 2013 Global Hunger Index Scores
Near East and North Africa
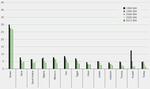
Click to enlargeWest Africa
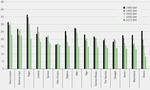
Click to enlargeCentral and Southern Africa
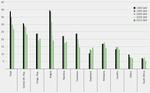
Click to enlargeEast Africa
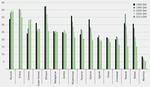
Click to enlargeSouth Anerica
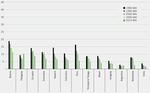
Click to enlargeCentral America and Caribbean
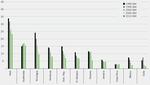
Click to enlargeSouth, East, and Southeast Asia
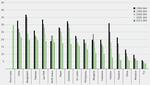
Click to enlargeEastern Europe and Commonwealth of Independent States
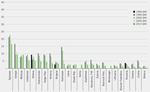
Click to enlarge
A
- Aker, J. C., R. Boumnijel, A. McClelland, and N. Tierney. 2011. Zap It to Me: The Short-Term Impacts of a Mobile Cash Transfer Program. CGD Working Paper 268. Washington, DC: Center for Global Development.
- Aker, J. C., and M. Nene. 2012. Cash Transfers, Nutrition and Household Well-Being in Niger. An Operations Research Report for Concern Worldwide. Dublin and Medford, MA, US: Concern Worldwide and Tufts University.
- Alinovi, L., M. D'Errico, E. Mane, and D. Romano. 2010. Livelihoods Strategies and Household Resilience to Food Insecurity: An Empirical Analysis to Kenya. Paper presented at conference organized by the European Report of Development, Dakar, Senegal, June 28-30.
- Alkire, S., and M. E. Santos. 2010. Multidimensional Poverty Index: 2010 Data. Oxford, UK: Oxford Poverty and Human Development Initiative, University of Oxford. www.ophi.org.uk/policy/multidi-mensional-poverty-index/.
- AlterPresse. 2012. Haiti-Agriculture: Martelly, de Retour du Japon, Affirme Disposer d'un Nouveau Plan d'Autosuffisance Alimentaire. December 12. www.alterpresse.org/spip.php?article13824#.UfZdhqx0Yrg.
B
- Barrett, C. B. 2010. Measuring Food Insecurity. Science 327 (5967): 825-828.
- Barrett, C. B., and M. Constas. 2012. Resilience to Avoid and Escape Chronic Poverty: Theoretical Foundations and Measurement Principles. Paper presented at a roundtable discussion on resilience at CARE, Washington, DC, December 11.
- Bene, C., R. Godfrey-Wood, A. Newsham, and M. Davies. 2012. Resilience: New Utopia or New Tyranny?: Reflection about the Potentials and Limits of the Concept of Resilience in Relation to Vulnerability Reduction Programmes. IDS Working Paper 405. Brighton, UK: Institute of Development Studies.
- Berhane, G., J. Hoddinott, N. Kumar, and A. S. Taffesse. 2011. The Impact of Ethiopia's Productive Safety Nets and Household Asset Building Programme: 2006-2010. IFPRI Discussion Paper 839. Washington, DC: International Food Policy Research Institute.
- Berkes, F., J. Colding, and C. Folke. 2003. Navigating Social-Ecological Systems: Building Resilience for Complexity and Change. Cambridge, UK: Cambridge University Press.
- Berkes, F., and C. Folke, ed. 1998. Linking Social and Ecological Systems Management Practices and Social Mechanisms for Building Resilience. Cambridge, UK: Cambridge University Press.
- Bhutta, Z. A., J. K. Das, A. Rizmi, M. F. Gahhey, N. Walker, S. Horton, P. Webb, A. Lartey, R. E. Black, the Lancet Nutrition Interventions Review Group, and the Maternal and Children Nutrition Study Group. 2013. Evidence-Based Interventions for Improvement of Maternal and Child Nutrition: What Can Be Done and at What Cost? The Lancet (June): 452-477.
- Black, R. E., C. G. Victora, S. P. Walker, Z. A. Bhutta, P. Christian, M. de Onis, M. Ezzati, S. Grantham-McGregor, J. Katz, R. Martorell, R. Uauy, and the Maternal and Child Nutrition Study Group. 2013. Maternal and Child Undernutrition and Overweight in Low-Income and Middle-Income Countries. The Lancet (June): 15-29.
- Bliss, J. R. 2012. The Impact of Cash Transfers on Nutrition and Dietary Practices of Children 6-24 Months of Age in the District of Tahoua, Niger. Concern Worldwide and Cornell University, Division of Nutritional Sciences, Dublin and Ithaca, NY, US. Unpublished.
- Bloem, M. W., R. Moench-Pfanner, and D. Panagides, ed. 2003. Health and Nutritional Surveillance for Development. Singapore: Helen Keller Worldwide.
- Boyd, E., H. Osbahr, P. Ericksen, E. Tompkins, M. C. Lemos, and F. Miller. 2008. Resilience and 'Climatizing' Development: Examples and Policy Implications. Development 51 (3): 390-396.
- Bundnis Entwicklung Hilft (Alliance Development Works). 2012. World Risk Report 2012. Berlin. www.worldriskreport.com/uploads/media/WRR_2012_en_online.pdf.
C
- Cadre de Liaison Inter-ONG Haiti. 2013. Prévenir une Crise Alimentaire Imminente en Haïti: Les Organisations Signataires Encouragent le Gouvernement et ses Partenaires à Prendre des Actions Immédiates et Durables. http://bit.ly/15PIlhC.
- Cayemittes, M., M. F. Placide, S. Mariko, B. Barrere, B. Severe, and C. Alexandre. 2007. Enquête Mortalité, Morbidité et Utilisation des Services, Haïti, 2005-2006. Calverton, MD, US: Ministère de la Santé Publique et de la Population, Institut Haïtien de l'Enfance, et Macro International Inc.
- Cayemittes, M., M. Fatuma Busangu, J. de Dieu Bizimana, B. Barrere, B. Severe, V. Cayemittes, and E. Charles. 2013. Enquête Mortalité, Morbidité et Utilisation des Services, Haïti, 2012. Calverton, MD, US: Ministère de la Santé Publique et de la Population, Institut Haïtien de l'Enfance, and ICF International.
- CIA (Central Intelligence Agency). 2013. The World Factbook. Washington, DC. www.cia.gov/library/publications/the-world-factbook/.
- Constas, M., and C. Barrett. 2013. Principles of Resilience Measurement for Food Insecurity: Metrics, Mechanisms, and Implementation Plans. Paper presented at the Expert Consultation on Resilience Measurement Related to Food Security sponsored by the Food and Agriculture Organization and World Food Programme, Rome, February 20.
D
- Davidson, D. J. 2010. The Applicability of the Concept of Resilience to Social Systems: Some Sources of Optimism and Nagging Doubts. Society and Natural Resources 23 (12): 1135-1149.
- Democracy Now. 2011. Dr. Paul Farmer on Bill Clinton's Apology for Devastating Haitian Rice Farming: A Great Relief. Accessed July 31, 2013. www.democracynow.org/2011/7/14/dr_paul_farmer_on_bill_clintons.
- Demombynes, G., and S. F. Trommlerova. 2012. What Has Driven the Decline of Infant Mortality in Kenya? World Bank Policy Research Working Paper 6057. Washington, DC: World Bank.
- Duit, A., V. Galaz, and K. Eckerberg. 2010. Governance, Complexity, and Resilience. Global Environmental Change 20 (3): 363-368.
E
- Economist. 2012. Bangladesh and Development: The Path through the Fields. November 3.
- EM-DAT (Emergency Events Database). 2013. EM-DAT: The International Disaster Database. Accessed July 5. www.em-dat.net.
- Erasmus, W., L. Mpoke, and Y. Yishak. March 2012. Mitigating the Impact of Drought in Moyale District, Northern Kenya. Humanitarian Exchange Magazine. Accessed July 18, 2013. http://www.odihpn.org/humanitarian-exchange-magazine/issue-53/mitigating-the-impact-of-drought-in-moyale-district-northern-kenya.
F
- FAO (Food and Agriculture Organization of the United Nations). 2011. The State of Food Insecurity in the World 2011. Rome.
- ----. 2012. The State of Food Insecurity in the World 2012. Rome.
- ----. 2013a. Food Security Indicators. http://www.fao.org/economic/ess/ess-fs/fs-data/en/.
- ----. 2013b. Situation Update: The Sahel Crisis. July 1. Rome. http://www.fao.org/fileadmin/user_upload/emergencies/docs/SITUATION%20UPDATE%20Sahel%201%2007%202013.pdf.
- FAO, WFP (World Food Programme), and UNICEF. 2012. Building Resilience: Rethinking Aid Strategy for Somalia: A FAO-WFP-UNICEF Joint Strategy on Building Resilience against Shocks for Somalia. Rome and New York. Unpublished
- FEWS NET (Famine Early Warning Systems Network). 2013. Agro-Climatic Monitoring. www.fews.net/Pages/imageryhome.aspx?l=en.
- Folke, C. 2006. Resilience: The Emergence of a Perspective for Social-ecological Systems Analyses. Global Environmental Change 16 (3): 253-267.
- Frankenberger, T., and S. Nelson. 2013. Summary of the Expert Consultation on Resilience Measurement for Food Security. Paper presented at the Expert Consultation on Resilience Measurement Related to Food Security sponsored by the Food and Agriculture Organization and World Food Programme, Rome, February 19-21.
G
- Gilligan, D., J. Hoddinott, and A. Seyoum Taffesse. 2009. The Impact of Ethiopia's Productive Safety Net Programme and Its Linkages. Journal of Development Studies 45 (10): 1684-1706.
- Glaeser, L. M., P. Horjus, and S. Strother. 2011. Haiti Prospective Food Security Assessment. Washington, DC: FANTA-2 Bridge (Food and Nutrition Technical Assistance)/FHI 360. http://www.fantaproject.org/downloads/pdfs/Haiti_Prospective_FoodSecurity_Assessment_Nov2011.pdf.
- Glantz, M. D., and J. L. Johnson, ed. 1999. Resilience and Development. New York: Kluwer Academic.
H
- Haiti. 2010. Haiti Earthquake PDNA (Post-Disaster Needs Assessment): Assessment of Damage, Losses, General and Sectoral Needs: Annex to the Action Plan for National Recovery and Development of Haiti. http://bit.ly/18XMPky.
- Haiti Grassroots Watch. 2010. The Pitfalls of Cash for Work. Originally published in Haiti Liberte. November 3-9. http://canadahaitiaction.ca/content/pitfalls-cash-work.
- Harris, J., and S. Drimie. 2012. Toward an Integrated Approach for Addressing Malnutrition in Zambia: A Literature Review and Institutional Analysis. IFPRI Discussion Paper 1200. Washington, DC: International Food Policy Research Institute.
- Headey, D., and O. Ecker. 2013. Rethinking the Measurement of Food Security: From First Principles to Best Practice. Food Security 5 (3): 327-343.
- Headey, D., A. Seyoum Taffesse, and L. You. 2012. Enhancing Resilience in the Horn of Africa: An Exploration into Alternative Investment Options. IFPRI Discussion Paper 1176. Washington, DC : International Food Policy Research Institute.
- Headey, D., A. Seyoum Taffesse, and L. You. Forthcoming. Diversification and Development in Pastoralist Ethiopia. World Development.
- Holling, C. S. 1973. Resilience and Stability of Ecological Systems. Annual Review of Ecology and Systematics 4: 2-23.
- Hornborg, A. 2009. Zero-Sum World: Challenges in Conceptualizing Environmental Load Displacement and Ecologically Unequal Exchange in the World-System. International Journal of Comparative Sociology 50 (3-4): 237-262. Accessed August 11, 2012. www.lucid.lu.se/Hornborg__2009__zero_sum_world.pdf.
- Huong, L. T., and V. T. T. Nga. 2013. Nutritional Practices among Ethnic Minorities and Child Malnutrition in Mountainous Areas of Central Vietnam. Food and Nutrition Sciences 4 (1): 82-89.
I
- IFPRI (International Food Policy Research Institute)/Welthungerhilfe/Concern. 2007. The Challenge of Hunger 2007: Global Hunger Index: Facts, Determinants, and Trends. Washington, DC, Bonn, and Dublin.
- IGME (Inter-agency Group for Child Mortality Estimation). 2012. CME Info Database. New York. www.childmortality.org/index.
J
- Joseph, M. V. 2013. Allocution du Secrétaire d'Etat à la Relance Agricole, M. Vernet Joseph, Chef de la Délégation Haïtienne à la 38e Session de la Conference de la FAO. Accessed July 31, 2013. www.fao.org/fileadmin/user_upload/bodies/Conference_2013/Statements/Haiti.pdf.
K
- Kennard, M. 2012. Haiti and the Shock Doctrine. Open Democracy, August 14. www.opendemocracy.net/matt-kennard/haiti-and-shock-doctrine.
- Klein, R. J. T., R. J. Nicholls, and F. Thomalla. 2003. Resilience to Natural Hazards: How Useful Is This Concept? Environmental Hazards 5 (1-2): 35-45.
- Kundermann, B. , R. Exceus, and O. Almqvist. 2012. Etude des Effets et Impacts du Programme Nord-Ouest 2000--2011 de la Welthungerhilfe en Haïti (Impact Study of the Welthungerhilfe Program in North-Western Haiti from 2000 to 2011). Unpublished, Welthungerhilfe, Bonn.
L
- Lancet. 2013. Maternal and Child Nutrition. www.thelancet.com/series/maternal-and-child-nutrition.
- Leach, M. 2008. Re-framing Resilience: A Symposium Report. STEPS Working Paper 13. Brighton, UK: Institute of Development Studies.
- Lybbert, T. J., C. B. Barrett, S. Desta, and D. L. Coppock. 2004. Stochastic Wealth Dynamics and Risk Management among a Poor Population. Economic Journal 114 (498): 750-777.
M
- Maplecroft Global Risk Analytics. 2011. World's Fastest Growing Populations Increasingly Vulnerable to the Impacts of Climate Change - 4th Global Atlas Reports. October 26. http://maplecroft.com/about/news/ccvi_2012.html.
- Maxwell, D., and R. Caldwell. 2008. The Coping Strategies Index: A Tool for Rapid Measurement of Household Food Security and the Impact of Food Aid Programs in Humanitarian Emergencies. Field Methods Manual. 2d ed. Atlanta: CARE International. http://home.wfp.org/stellent/groups/public/documents/manual_guide_proced/wfp211058.pdf.
- McKay, A. 2009. Assets and Chronic Poverty: Background Paper. Working Paper 100. Manchester, UK: Chronic Poverty Research Centre, University of Manchester.
- MEASURE DHS. 2013. Demographic and Health Surveys. Calverton, MD, USA. www.measuredhs.com.
N
- Neumeyer, E., and T. Plumper. 2007. The Gendered Nature of Natural Disasters: The Impact of Catastrophic Events on the Gender Gap in Life Expectancy, 1981-2002. Annals of the Association of American Geographers 97 (3): 551-566.
O
- Oxfam. 2013. No Accident: Resilience and the Inequality of Risk. Oxfam Briefing Paper. Oxford, UK. http://www.oxfam.org/sites/www.oxfam.org/files/bp172-no-accident-resilience-inequality-of-risk-210513-en_1.pdf.
R
- Radtke, K. 2010. Welthungerhilfe in Fragile States. Policy Paper 3. Bonn: Welthungerhilfe.
- Ruel, M. T., H. Alderman, and the Maternal and Child Nutrition Study Group. 2013. Nutrition-Sensitive Interventions and Programmes: How Can They Help to Accelerate Progress in Improving Maternal and Child Nutrition? The Lancet (June): 536-551.
S
- Sapountzaki, K. 2007. Social Resilience to Environmental Risks: A Mechanism of Vulnerability Transfer? Management of Environmental Quality: An International Journal 18 (3): 274-297.
- Schwarz, A. M., C. Bene, G. Bennett, D. Boso, Z. Hilly, C. Paul, R. Posala, S. Sibiti, and N. Andrew. 2011. Vulnerability and Resilience of Rural Remote Communities to Shocks and Global Changes: Empirical Analysis from the Solomon Islands. Global Environmental Change 21 (3): 1128-1140.
- Shoham, J., F. Watson, and C. Dolan. 2001. The Use of Nutritional Indicators in Surveillance. London: Overseas Development Institute.
- SUN (Scaling Up Nutrition). 2013. SUN Countries: Policies and Plans. http://scalingupnutrition.org/resources-archive/country-resources/sun-countries-policies-and-plans.
T
- Tontisirin, K., and P. Winichagoon. 1999. Community-Based Programmes: Success Factors for Public Nutrition Derived from the Experience of Thailand. Food and Nutrition Bulletin 20 (3): 315322.
- Tulane University and UEH (State University of Haiti). 2012. Haiti Humanitarian Assistance Evaluation: From a Resilience Perspective. New Orleans: Disaster Resilience Leadership Academy, Tulane University.
- Twigg, J. 2007. Characteristics of a Disaster-Resilient Community: A Guidance Note to the DFID Disaster Risk Reduction Interagency Coordination Group. http://practicalaction.org/reducing-vulnerability/docs/ia1/community-characteristics-en-lowres.pdf.
U
- UN (United Nations) 2011. Has Aid Changed? Channelling Assistance to Haiti before and after the Earthquake. New York: United Nations Office of the Special Envoy for Haiti. http://reliefweb.int/sites/reliefweb.int/files/resources/has_aid_changed_en.pdf.
- ----. 2013a. Analysis Shows 56.0 Percent Disbursement Rate for Haiti Recovery among Public Sector Donors. Press release, January 8. New York: United Nations Office of the Secretary-General's Special Adviser. http://www.lessonsfromhaiti.org/press-and-media/press-releases/public-sector-disbursement-as-of/.
- ----. 2013b. A New Global Partnership: Eradicate Poverty and Transform Economies through Sustainable Development: The Report of the High-Level Panel of Eminent Persons on the Post-2015 Development Agenda. New York.
- ----. 2013c. World Population Prospects: The 2012 Revision. CD-ROM. New York: United Nations, Department of Economic and Social Affairs, Population Division.
- UNAIDS (Joint United Nations Programme on HIV/AIDS). 2010. Global Report: UNAIDS Report on the Global AIDS Epidemic 2010. Geneva.
- ----. 2012. Global Report: UNAIDS Report on the Global AIDS Epidemic 2012. Geneva.
- UNICEF (United Nations Children's Fund). 2009. Childinfo: Underweight: Nutritional Status According to the NCHS/WHO/CDC Reference. Accessed May 4, 2011. www.childinfo.org/undernutrition_underweight.php.
- ----. 2013a. Childinfo: Nutritional Status. Accessed June 13, 2013. www.childinfo.org/malnutrition_nutritional_status.php.
- ----. 2013b. Childinfo: Multiple Indicator Cluster Surveys (MICS). Accessed June 21, 2013. www.childinfo.org/mics_available.html.
- UNICEF/WHO (World Health Organization)/World Bank. 2012. Levels and Trends in Child Malnutrition: UNICEF-WHO-The World Bank Joint Child Malnutrition Estimates. New York, Geneva, and Washington, DC.
- USAID (US Agency for International Development). 2012. Building Resilience to Recurrent Crisis: USAID Policy and Program Guidance. Washington, DC.
V
- Vaitla, B., G. Tesfay, M. Rounseville, and D. Maxwell. 2012. Resilience and Livelihoods Change in Tigray, Ethiopia. Somerville, MA: Tufts University, Feinstein International Center.
- VFL (Views from the Front Line). 2011. If We Do Not Join Hands. Middlesex, UK: Global Network for Civil Society Organizations for Disaster Reduction.
- von Braun, J., M. Ruel, and A. Gulati. 2008. Accelerating Progress toward Reducing Malnutrition in India: A Concept for Action. Washington, DC: International Food Policy Research Institute.
- von Grebmer, K., H. Fritschel, B. Nestorova, T. Olofinbiyi, R. Pandya-Lorch, and Y. Yohannes. 2008. Global Hunger Index: The Challenge of Hunger 2008. Bonn, Washington, DC, and Dublin: Deutsche Welthungerhilfe, International Food Policy Research Institute, and Concern Worldwide.
- von Grebmer, K., B. Nestorova, A. Quisumbing, R. Fertziger, H. Fritschel, R. Pandya-Lorch, and Y. Yohannes. 2009. 2009 Global Hunger Index: The Challenge of Hunger: Focus on Financial Crisis and Gender Inequality. Bonn, Washington, DC, and Dublin: Deutsche Welthungerhilfe, International Food Policy Research Institute, and Concern Worldwide.
- von Grebmer, K., M. T. Ruel, P. Menon, B. Nestorova, T. Olofinbiyi, H. Fritschel, Y. Yohannes, C. von Oppeln, O. Towey, K. Golden, and J. Thompson. 2010. 2010 Global Hunger Index: The Challenge of Hunger: Focus on the Crisis of Child Undernutrition. Bonn, Washington, DC, and Dublin: Deutsche Welthungerhilfe, International Food Policy Research Institute, and Concern Worldwide.
- von Grebmer, K., M. Torero, T. Olofinbiyi, H. Fritschel, D. Wiesmann, Y. Yohannes, L. Schofield, and C. von Oppeln. 2011. 2011 Global Hunger Index: The Challenge of Hunger: Taming Price Spikes and Excessive Food Price Volatility. Bonn, Washington, DC, and Dublin: Deutsche Welthun-gerhilfe, International Food Policy Research Institute, and Concern Worldwide.
- von Grebmer, K., C. Ringler, M. W. Rosegrant, T. Olofinbiyi, D. Wiesmann, H. Fritschel, O. Badi-ane, M. Torero, Y. Yohannes, J. Thompson, C. von Oppeln, and J. Rahall. 2012. 2012 Global Hunger Index: The Challenge of Hunger: Ensuring Sustainable Food Security under Land, Water, and Energy Stresses. Bonn, Washington, DC, and Dublin: Welthungerhilfe, International Food Policy Research Institute, and Concern Worldwide.
W
- Walker, B., C. S. Holling, S. R. Carpenter, and A. Kinzig. 2004. Resilience, Adaptability and Trans-formability in Social-ecological Systems. Ecology and Society 9 (2): 5.
- WFP (World Food Programme). 2013. Food Aid Quantity Reporting Database. Accessed July 5, 2013. www.wfp.org/fais/quantity-reporting.
- WHO (World Health Organization). 2013. Global Database on Child Growth and Malnutrition. www.who.int/nutgrowthdb/en/.
- Wiesmann, D. 2004. An International Nutrition Index: Concept and Analyses of Food Insecurity and Undernutrition at Country Levels. Development Economics and Policy Series 39. Frankfurt: Peter Lang.
- ----. 2006a. 2006 Global Hunger Index: A Basis for Cross-Country Comparisons. Washington, DC: International Food Policy Research Institute.
- ----. 2006b. A Global Hunger Index: Measurement Concept, Ranking of Countries, and Trends. Food Consumption and Nutrition Division Discussion Paper 212. Washington, DC: International Food Policy Research Institute.
- Wiesmann, D., J. von Braun, and T. Feldbrugge. 2000. An International Nutrition Index: Successes and Failures in Addressing Hunger and Malnutrition. ZEF Discussion Papers on Development Policy No. 26. Bonn, Germany: Zentrum fur Entwicklungsforschung (ZEF) [Center for Development Research].
- Wiesmann, D., L. Weingartner, and I. Schoninger. 2006. The Challenge of Hunger: Global Hunger Index: Facts, Determinants, and Trends. Bonn and Washington, DC: Deutsche Welthungerhilfe and International Food Policy Research Institute.
- World Bank. 2006. Repositioning Nutrition as Central to Development: A Strategy for Large-Scale Action. Washington, DC.
- ----. 2013a. Cereal Yield (kg per hectare). http://data.worldbank.org/indicator/AG.YLD.CREL.KG.
- ----. 2013b. World Development Indicators Online. http://data.worldbank.org/products/wdi.
Notes:
1. For background information on the concept, see Wiesmann (2004) and Wiesmann, von Braun, and Feldbrügge (2000). [Back]
2. According to recent estimates, undernutrition is responsible for 45 percent of deaths of children younger than five years (Black et al. 2013). [Back]
3. For a multidimensional measure of poverty, see the index developed by the Oxford Poverty and Human Development Initiative for the United Nations Development Programme (Alkire and Santos 2010). [Back]
4. FAO stopped publishing country-level estimates of undernourishment for the Democratic Republic of Congo and Myanmar in 2011 (FAO 2011). According to past GHI reports, the GHI score of the Democratic Republic of Congo was in the "extremely alarming" category with the highest levels of hunger. For South Sudan, which became independent in 2011, and Sudan, separate undernourishment estimates are not yet available from FAO (FAO 2013a). Therefore GHI scores calculated for former Sudan refer to the population of both countries. [Back]
5. For previous GHI calculations, see von Grebmer et al. (2012, 2011, 2010, 2009, 2008); IFPRI/Welthungerhilfe/Concern (2007); Wiesmann (2006a, b); and Wiesmann, Weingartner, and Schoninger (2006). [Back]
1. The reason for greater progress in reducing undernourishment (one of the three component indicators of the GHI) is that FAO's new methodology produces larger 1990-1992 baseline estimates than its old methodology, and against this new baseline, progress appears greater (FAO 2012). In addition, some of the decline in the proportion of undernourished reflects the growth in world population, against which a stagnant absolute number of undernourished people since 20062008 makes up a decreasing share (FAO 2013a). [Back]
2. The "world" includes all developing countries for which the GHI has been calculated. It also includes Afghanistan, Democratic Republic of Congo, Iraq, Myanmar, Papua New Guinea, and Somalia. Country GHI scores were not calculated for these countries because much of the data for them is estimated or provisional. They were incorporated into the 2013 world GHI and regional GHI scores because data on child underweight and child mortality are available or could be estimated and because provisional estimates of undernourishment were provided by FAO only for regional and global aggregation. As noted earlier, data for some other countries are not available, and most high-income countries are excluded from the GHI calculation. [Back]
3. The year 1990 was chosen for comparison because it is the reference point for achieving the targets under the Millennium Development Goals. [Back]
4. For Eastern Europe and the Commonwealth of Independent States, the 1995 GHI score was used for comparison because most countries in this region became independent after 1990 and no 1990 GHI scores were calculated. [Back]
5. The numbers in these first three sentences refer to the 88 countries for which (1) data for the 1990 and 2013 GHI scores are available and (2) either or both of those scores is greater than 5. [Back]
6. Although the Democratic Republic of Congo and Somalia are likely to have high proportions of undernourished as well, they could not be included in this comparison because of lack of reliable data. [Back]
1. Inequality also shapes vulnerability and makes it harder for poor people to escape and manage risk, thus undermining their resilience capacities (Oxfam 2013). [Back]
2. As examples, see Leach (2008); Hornborg (2009); Davidson (2010); Duit, Galaz, and Eckerberg (2010). [Back]
3. Some of these livelihood strategies may be short-term "negative" coping strategies; others clearly involve longer-term maladaptations that cannot be considered simply survival coping behaviors. "Negative" forms of resilience are thus possible and often empirically observed (Sapountzaki 2007). [Back]
4. Moreover, the mobility of pastoralist populations makes the range of fixed public works projects, such as the construction of roads and crop infrastructure, more limited, though they are still possible, particularly in more sedentary agro-pastoralist settings. [Back]
5. See Bloem, Moench-Pfanner, and Panagides (2003) and Shoham, Watson, and Dolan (2001) for an introduction to the approach. [Back]
1. Findings from the 2012 Haiti Demographic and Health Survey (DHS) were not considered in Haiti's 2013 GHI score, because the report became available after data compilation for the GHI ended. Compared to the 2005-2006 Haiti DHS, the 2012 Haiti DHS indicates tangible improvements in child malnutrition (Cayemittes et al. 2007, 2013). FAO's data on undernourishment and dietary energy supply per capita also show a positive trend for recent years (FAO 2013a). [Back]
2. Out of 100 people who cannot meet their basic needs, 77 are in rural areas, 9 are in the greater Port-au-Prince metropolitan area, and 14 are in other urban areas. A 2007 Comprehensive Food Security and Vulnerability Assessment found that rural households bought 68 percent of their food. These purchases equal 59 percent of their total expenditures (Glaeser, Horjus, and Strother 2011). [Back]
3. In the mid-1990s, US President Bill Clinton supported dramatic cuts to Haiti's tariffs on imported US rice. On March 10, 2010, however, he told the US Senate Foreign Relations Committee, "It may have been good for some of my farmers in Arkansas, but it has not worked. It was a mistake" (Democracy Now 2011). [Back]
1. This recommendation is also promoted by the High-Level Panel of Eminent Persons on the Post-2015 Development Agenda in their report A New Global Partnership (United Nations 2013b). [Back]
2. These recommendations follow from the findings presented in a special issue of The Lancet on maternal and child nutrition (June 2013). [Back]
a. Proportion of the population with calorie deficiency. [Back]
b. Average over a three-year period [Back]
c. Data collected from the year closest to 1990; where data for 1988 and 1992, or 1989 and 1991, were available, an average was used. The authors' estimates are for 1990. [Back]
d. Data collected from the year closest to 1995; where data for 1993 and 1997, or 1994 and 1996, were available, an average was used. The authors' estimates are for 1995. [Back]
e. WHO 2013 data are the primary data source, and UNICEF/WHO/World Bank 2012; UNICEF 2013a, b; UNICEF 2009; and MEASURE DHS 2013 are secondary data sources. [Back]
f. Data collected from the year closest to 2000; where data for 1998 and 2002, or 1999 and 2001, were available, an average was used. The authors' estimates are for 2000. [Back]
g. Data collected from the year closest to 2005; where data for 2003 and 2007, or 2004 and 2006, were available, an average was used. The authors' estimates are for 2005. [Back]
 | This document has been published on 17Oct13 by the Equipo Nizkor and Derechos Human Rights. In accordance with Title 17 U.S.C. Section 107, this material is distributed without profit to those who have expressed a prior interest in receiving the included information for research and educational purposes. |