| Information |  | |
Derechos | Equipo Nizkor
| ||
| Information | | |
Derechos | Equipo Nizkor
| ||
23Jun16
World Drug Report 2016
Back to topCONTENTS
1. ILLICIT DRUG MARKETS: SITUATION AND TRENDS
A. Extent of drug use
B. Health impact of drug use
C. Extent of drug supply
D. Market analysis by drug type2. THE WORLD DRUG PROBLEM AND SUSTAINABLE DEVELOPMENT
A. Social development
B. Economic development
C. Environmental sustainability
D. Peaceful, just and inclusive societies
E. PartnershipStatistical tables
Regional groupings
Glossary
The World Drug Report 2016 comes at a decisive moment, just months after Member States, at a special session of the General Assembly, adopted a comprehensive set of operational recommendations on the world drug problem.
The session was only the third in the history of the General Assembly to focus on drugs, and the resulting outcome document, entitled "Our joint commitment to effectively addressing and countering the world drug problem", provides a concrete way forward to take action on shared challenges.
In the outcome document, Member States reaffirmed their commitment to addressing persistent, new and evolving challenges in line with the three international drug control conventions, which were recognized as allowing States parties sufficient flexibility to design and implement national drug policies consistent with the principle of common and shared responsibility.
The operational recommendations contained in the outcome document encompass measures to address demand and supply reduction, as well as to improve access to controlled medicines while preventing their diversion; they cover human rights, youth, children, women and communities and highlight emerging challenges and the need to promote long-term, comprehensive, sustainable, development-oriented and balanced drug control policies and programmes that include alternative development.
The text highlights the importance of drug abuse prevention and treatment; encourages the development, adoption and implementation of alternative or additional measures with regard to conviction or punishment; and promotes proportionate national sentencing policies, practices and guidelines for drug-related offences.
Now the international community must come together to make good on its commitments.
The World Drug Report 2016, which provides a comprehensive overview of major developments in drug markets, trafficking routes and the health impact of drug use, sup-ports comprehensive, balanced and integrated rights-based approaches.
This year's report offers insight into the wide-ranging impact of drugs not only on the health and well-being of individuals, but also on the people around them — families and communities. This can include such harms as HIV, as well as the threat of violence, faced in particular by women and children.
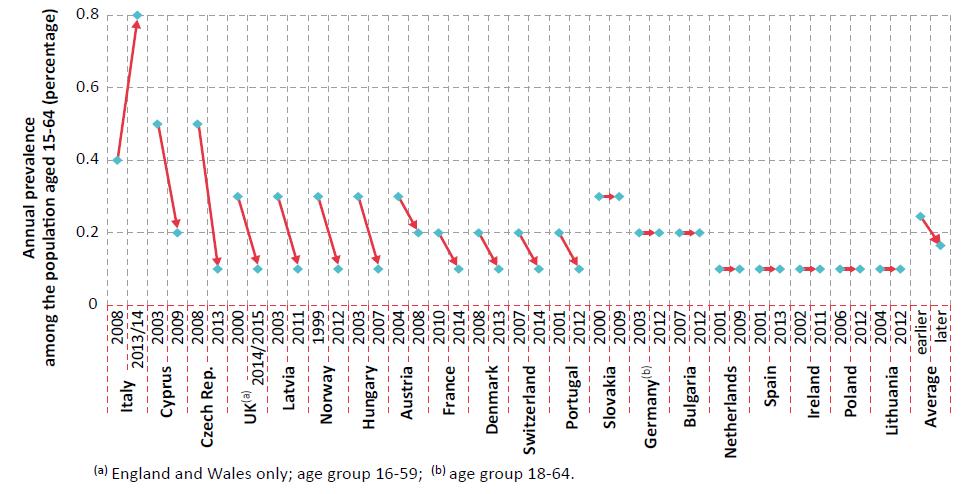
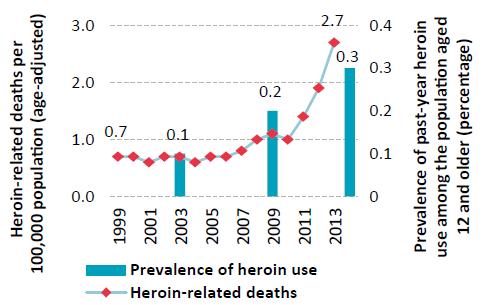
The report also flags the alarming rise in heroin use in some regions. While the challenges posed by new psychoactive substances remain a serious concern, heroin continues to be the drug that kills the most people. This resurgence must be addressed urgently.
The report looks at issues of gender, marginalization, stigmatization, violence and human rights, and considers how counter-narcotics strategies can be sensitive to environmental concerns such as deforestation and pollution. It examines the use of the "dark net" and new technologies for drug trafficking, as well as the potential of illicit drug profits to fund terrorism and violent extremism.
Moreover, the 2016 report's thematic chapter focuses on the interlinkages between drugs and development and the importance of "development-sensitive" drug control policies. This is a topic of particular relevance: as Governments noted in the outcome document, "efforts to achieve the Sustainable Development Goals and to effectively address the world drug problem are complementary and mutually reinforcing".
The research contained in the report can support effective drug and development policies. The evidence is clear: illicit drug cultivation and manufacturing can be eradicated only if policies are aimed at the overall social, economic and environmental development of communities; confronting drug trafficking and its associated violence requires strong, transparent and fair criminal justice institutions and targeted efforts to dismantle transnational organized criminal organizations; prevention and treatment of drug use work if they are based on scientific evidence and are gender-sensitive; and the excessive use of imprisonment for drug-related offences of a minor nature is ineffective in reducing recidivism and overburdens criminal justice systems.
There is clearly much work to be done to tackle the many evolving and emerging challenges posed by drugs. The outcome document and its operational recommendations offer a solid foundation, one built on agreed frameworks, informed by evidence and based on the principle of common and shared responsibility.
This report, as with all of the Office's expertise and on-the-ground experience in addressing the many aspects of the world drug problem, is at the disposal of Member States as they strive to meet this call to action.
Yury Fedotov
Executive Director
United Nations Office on Drugs and Crime
The boundaries and names shown and the designations used on maps do not imply official endorsement or acceptance by the United Nations. A dotted line represents approximately the line of control in Jammu and Kashmir agreed upon by India and Pakistan. The final status of Jammu and Kashmir has not yet been agreed upon by the parties. Disputed boundaries (China/India) are represented by cross-hatch owing to the difficulty of showing sufficient detail.
The designations employed and the presentation of the material in this publication do not imply the expression of any opinion whatsoever on the part of the Secretariat of the United Nations concerning the legal status of any country, territory, city or area, or of its authorities or concerning the delimitation of its frontiers or boundaries.
Countries and areas are referred to by the names that were in official use at the time the relevant data were collected.
All references to Kosovo in the present publication should be understood to be in compliance with Security Council resolution 1244 (1999).
Since there is some scientific and legal ambiguity about the distinctions between "drug use", "drug misuse" and "drug abuse", the neutral terms "drug use" and "drug consumption" are used in the present report.
All uses of the word "drug" in this report refer to substances under the control of the international drug control conventions.
All analysis contained in this report is based on the official data submitted by Member States to the United Nations Office on Drugs and Crime through the annual report questionnaire unless indicated otherwise.
The data on population used in the present report are from: United Nations, Department of Economic and Social Affairs, Population Division, World Population Prospects: The 2015 Revision.
References to dollars ($) are to United States dollars, unless otherwise stated.
References to tons are to metric tons, unless otherwise stated. R stands for the correlation coefficient, used as measure of the strength of a statistical relationship between two or more variables, ranging from 0 to 1 in case of a positive correlation or from 0 to -1 in case of a negative correlation; R2 stands for the square of the coefficient of correlation.
The following abbreviations have been used in the present report:
ATS amphetamine-type stimulants CICAD Inter-American Drug Abuse Control Commission (Organization of American States) CND Commission on Narcotic Drugs EMCDDA European Monitoring Centre for Drugs and Drug Addiction Europol European Police Office GDP gross domestic product ha hectares INCB International Narcotics Control Board INCSR International Narcotics Control Strategy Report of the United States State Department INTERPOL International Criminal Police Organization MDMA 3,4-methylenedioxymethamphetamine MSM Men who have sex with men MDPV 3,4-methylenedioxypyrovalerone NIDA National Institute on Drug Abuse (United States) NPS new psychoactive substances OECD Organization for Economic Cooperation and Development PMMA para-methoxymethamphetamine PWID people who inject drugs alpha-PVP alpha-pyrrolidinopentiophenone SAMHSA Substance Abuse and Mental Health Services Administration (United States of America) SCORE Sewage Analysis CORe group Europe UNAIDS Joint United Nations Programme on HIV/AIDS UNDP United Nations Development Programme UNFDAC United Nations Fund for Drug Abuse Control WCO World Customs Organization WHO World Health Organization
"We reiterate our commitment to strengthen our efforts in addressing and countering emerging and persistent challenges and threats of all aspects of the world drug problem ... and we recommend the following: ... promote, as appropriate, the use and analysis of relevant, reliable and objective data ... to improve the implementation of comprehensive, integrated and balanced national drug control strategies, policies and programmes ... and encourage the sharing of best practices and lessons learned."
Outcome document of the special session of the General Assembly on the world drug problem, entitled "Our joint commitment to effectively addressing and countering the world drug problem"
The World Drug Report 2016 is published in the wake of the landmark moment in global drug policy, the special session of the General Assembly on the world drug problem. Chapter I provides a global overview of the supply of and demand for opiates, cocaine, cannabis, amphetamine-type stimulants (ATS) and new psychoactive substances (NPS), as well as their impact on health. It also reviews the scientific evidence on polydrug use, treatment demand for cannabis and developments since the legalization of cannabis for recreational use in some parts of the world. Chapter II focuses on the mechanisms of the interaction between the world drug problem and all aspects of sustainable development through the lens of the Sustainable Development Goals.
Drug use and its health consequences
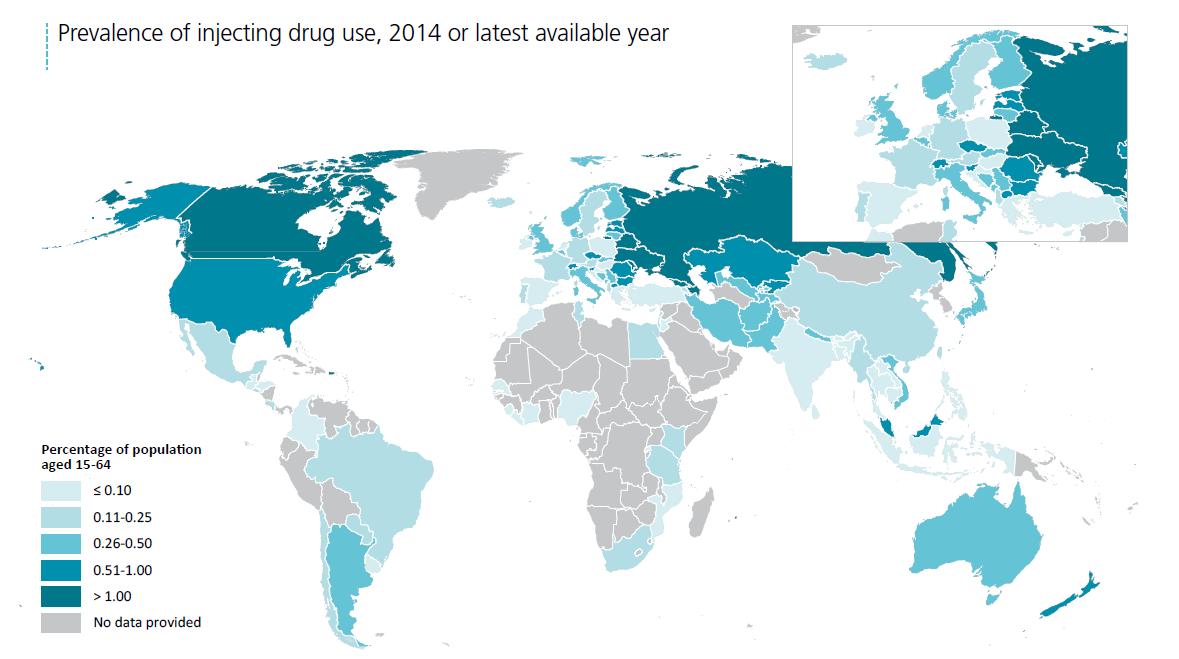
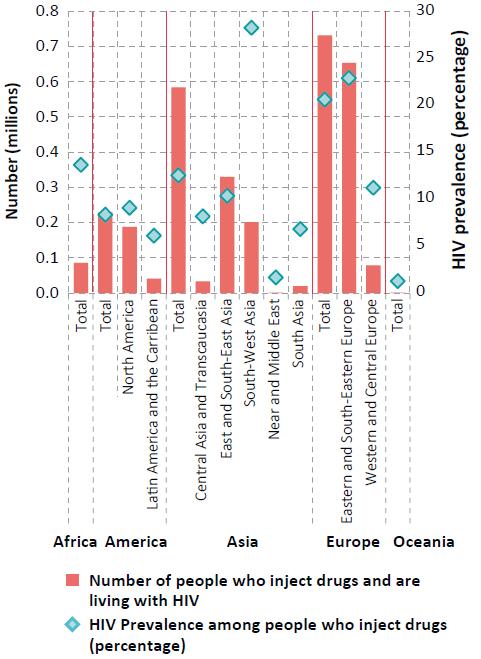
Prevalence of injecting drug use, 2014 or latest available year
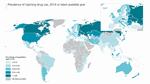
Click to enlargeNote: The boundaries and names shown and the designations used on this map do not imply official endorsement or acceptance by the United Nations. Dashed lines represent undetermined boundaries. The dotted line represents approximately the Line of Control in Jammu and Kashmir agreed upon by India and Pakistan. The final status of Jammu and Kashmir has not yet been agreed upon by the parties. The final boundary between the Sudan and South Sudan has not yet been determined. A dispute exists between the Governments of Argentina and the United Kingdom of Great Britain and Northern Ireland concerning sovereignty over the Falkland Islands (Malvinas).
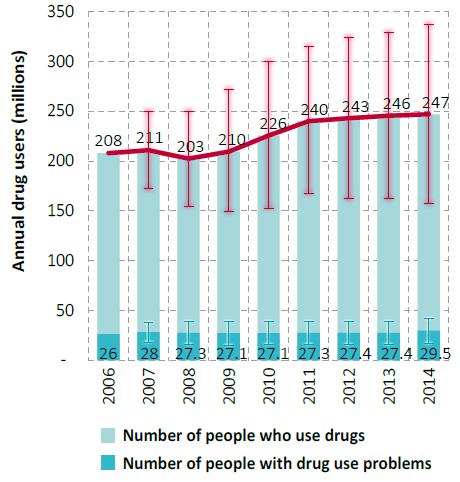
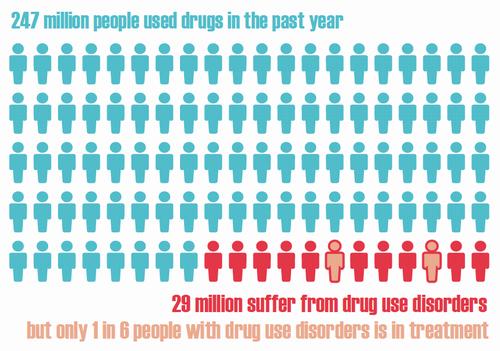
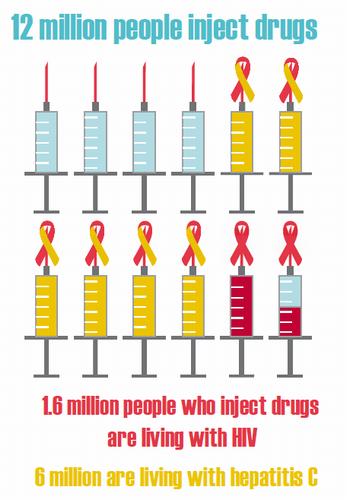
It is estimated that 1 in 20 adults, or a quarter of a billion people between the ages of 15 and 64 years, used at least one drug in 2014. Roughly the equivalent of the combined populations of France, Germany, Italy and the United Kingdom, though a substantial amount, it is one that does not seem to have grown over the past four years in proportion to the global population. Nevertheless, as over 29 million people who use drugs are estimated to suffer from drug use disorders, and of those, 12 million are people who inject drugs (PWID), of whom 14.0 per cent are living with HIV, the impact of drug use in terms of its consequences on health continues to be devastating.
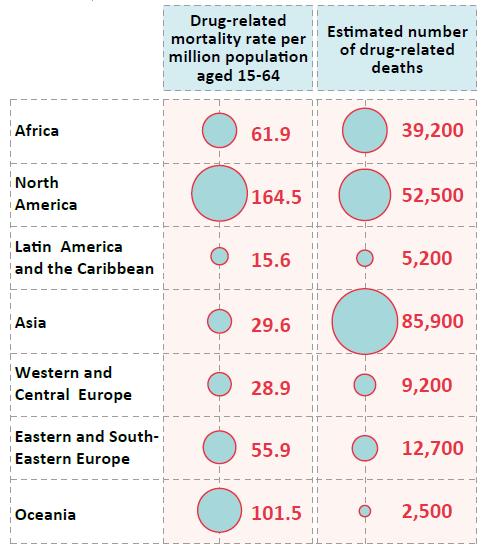
With an estimated 207,400 drug-related deaths in 2014, corresponding to 43.5 deaths per million people aged 15-64, the number of drug-related deaths worldwide has also remained stable, although unacceptable and preventable. Overdose deaths contribute to between roughly a third and a half of all drug-related deaths, which are attributable in most cases to opioids. The time period shortly after release from prison is associated with a substantially increased risk of death from drug-related causes (primarily as a result of drug overdoses), with a mortality rate much higher than from all causes among the general population.
In many countries, prisons remain a high-risk environment for infectious diseases, which is a significant concern for prison health. A number of studies report high levels of drug use in prison, including the use of opiates and injecting drug use. In addition, the prevalence of HIV, hepatitis and tuberculosis among persons held in prison can be substantially higher than among the general population. However, despite the high-risk environment and scientific evidence for effective health interventions, there are significant gaps in prevention and treatment services in many prisons around the world.
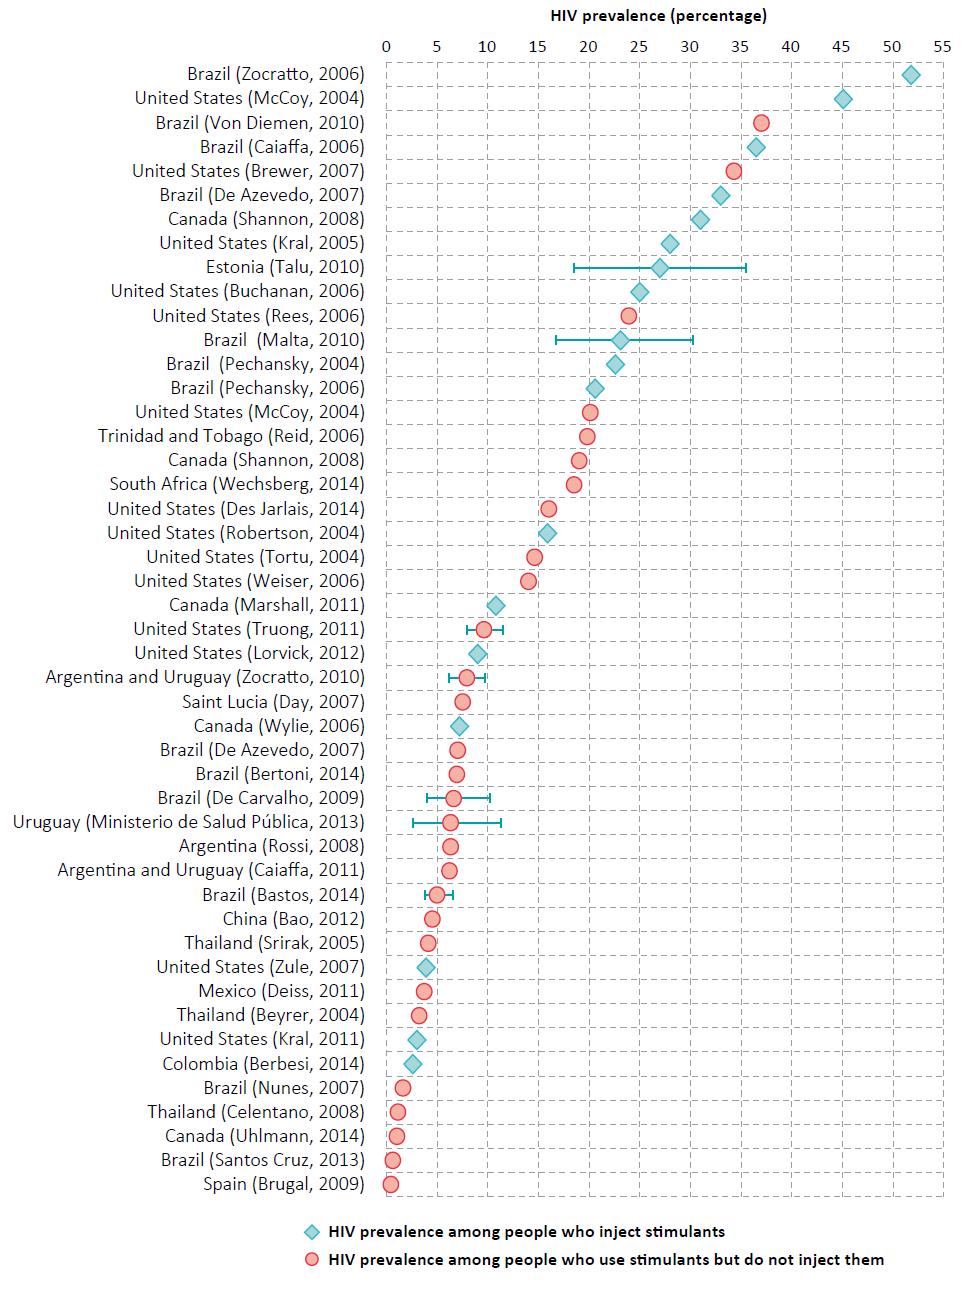
PWID experience some of the most severe health-related harms associated with unsafe drug use, overall poor health outcomes, including a high risk of non-fatal and fatal overdoses, and a greater chance of premature death. One in seven PWID is living with HIV, and one in two with hepatitis C. PWID are a key at-risk population for HIV and hepatitis, with almost a third of new HIV infections outside sub-Saharan Africa occurring among PWID. Moreover, studies have found people who inject stimulants to engage in more risky sexual behaviours, resulting in a higher risk of HIV infection than for those injecting opiates.
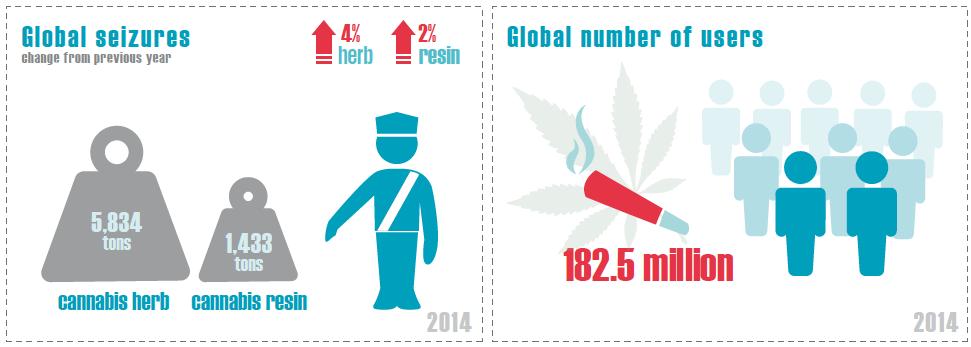
Cannabis remains the most commonly used drug at the global level, with an estimated 183 million people having used the drug in 2014, while amphetamines remain the second most commonly used drug. With an estimated 33 million users, the use of opiates and prescription opioids is less common, but opioids remain major drugs of potential harm and health consequences. The fact that a sharp increase in heroin use has been documented in some markets (particularly North America) where it was previously declining, shows that heroin remains one of the major drugs of public health concern.
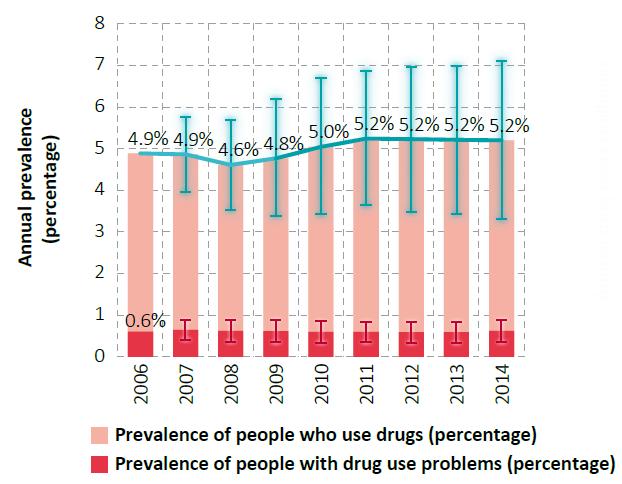
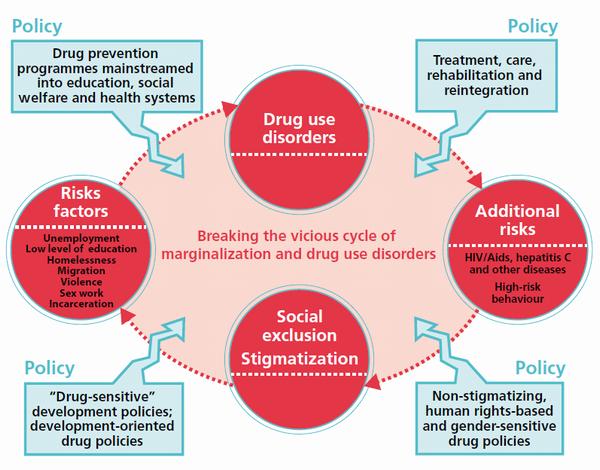
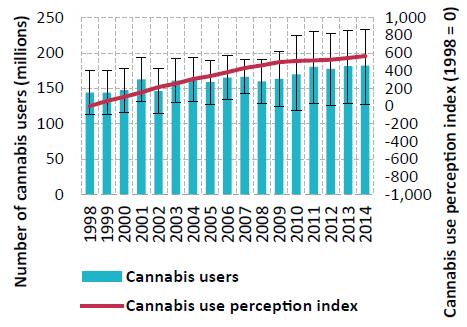
Global trends in the estimated prevalence of drug use, 2006-2014
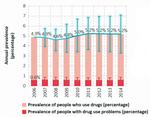
Click to enlargeSource: Responses to the annual report questionnaire.
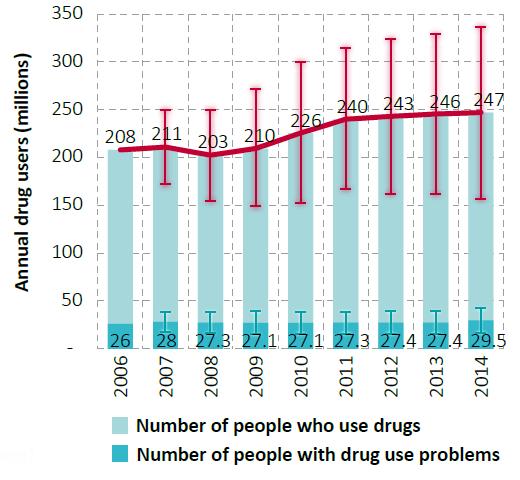
Note: Estimated percentage of adults (ages 15-64) who used drugs in the past year.Global trends in the estimated number of people who use drugs, 2006-2014
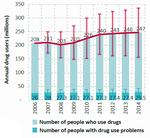
Click to enlargeSource: Responses to the annual report questionnaire.
Note: Estimates are for adults (ages 15-64), based on past-year use.As an overall trend at the global level, the use of cannabis has remained stable over the past three years. In some sub-regions, however, particularly North America and Western and Central Europe, cannabis use has increased. After a period of stability, since 2010 cocaine use has also been rising, mainly because of an increase in cocaine use in South America. On the other hand, the use of amphetamines appears to be stable, but that may underplay the situation in subregions, specifically East and South-East Asia, where recent information on the extent of drug use is unavailable.
Making the global picture of drug use more blurred is the fact that many people who use drugs, both occasionally and regularly, tend to be polydrug users who use more than one substance concurrently or sequentially. For example, the non-medical use of prescription drugs, synthetic stimulants and NPS in lieu of or in combination with more conventional drugs clouds the distinction between users of a particular drug, presenting an interlinked or cyclical epidemic of drug use and related health consequences in recent years.
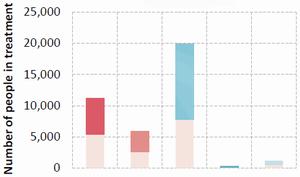
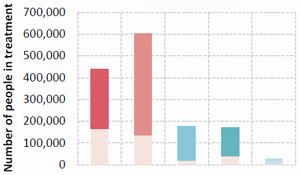
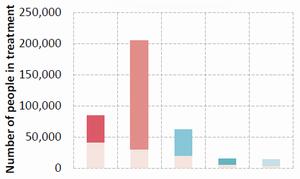
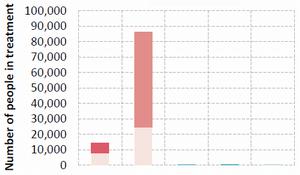
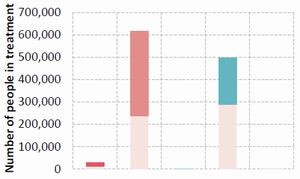
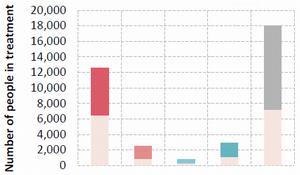
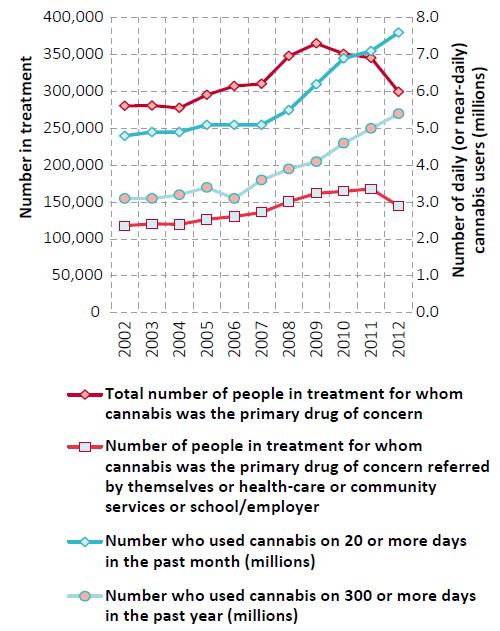
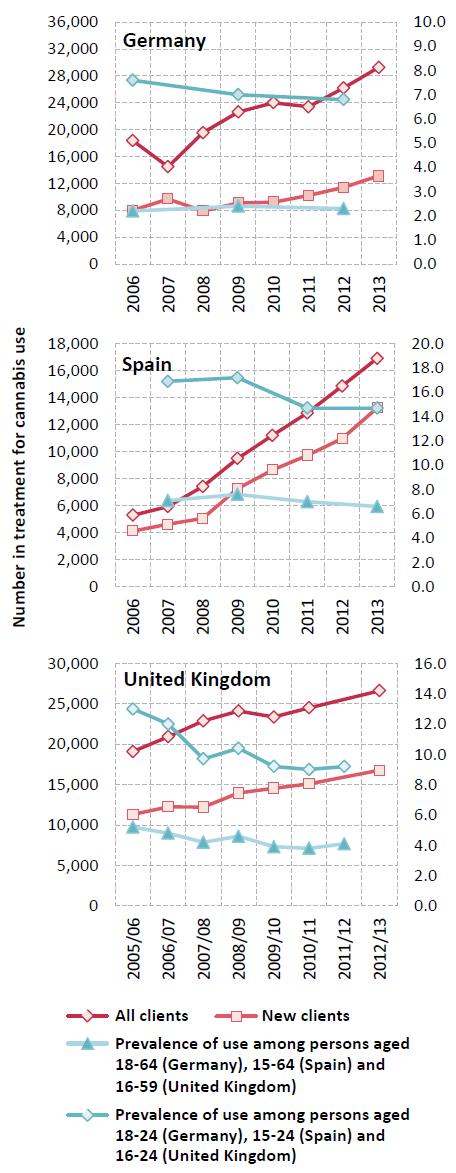
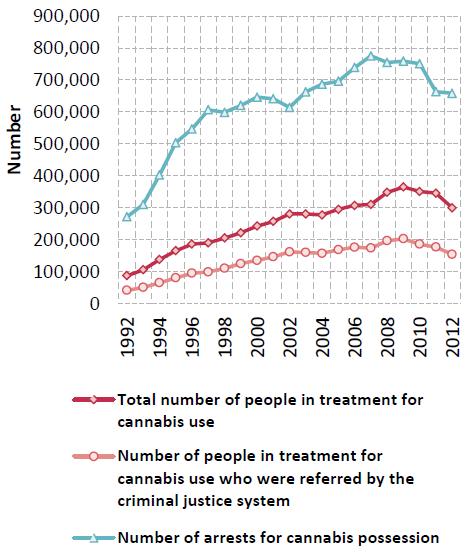
Treatment related to cannabis use has been increasing in many regions over the past decade. In Europe, an increase in the numbers in treatment for cannabis use has been observed in several countries, despite a decline in the number of frequent (monthly) users. The proportion of people seeking treatment for the first time for cannabis use disorders remains high globally, with nearly half of the people treated for cannabis use disorders being first-time entrants. Changes in patterns of the people in treatment for cannabis use may be attributed to a number of factors, including practices in referrals by the criminal justice system and an expansion in the provision of treatment for cannabis in some countries. While there is some evidence that higher potency cannabis is now more widely available in Europe and the United States, how this might translate into greater harm for cannabis users is not clearly understood.
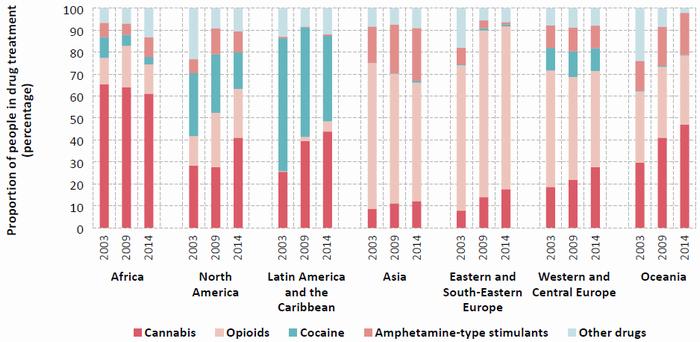
On average, younger people are seeking treatment for cannabis and amphetamines use disorders more than for other drugs. This reflects the trends in increasing use of cannabis and amphetamines and the resulting increase in people seeking treatment for disorders related to the use of can-nabis and amphetamines. People in treatment for opioid-or cocaine-related disorders are typically in their thirties, and, in many subregions, this reflects an ageing cohort of users in treatment and an overall decrease in the proportion of treatment demand.
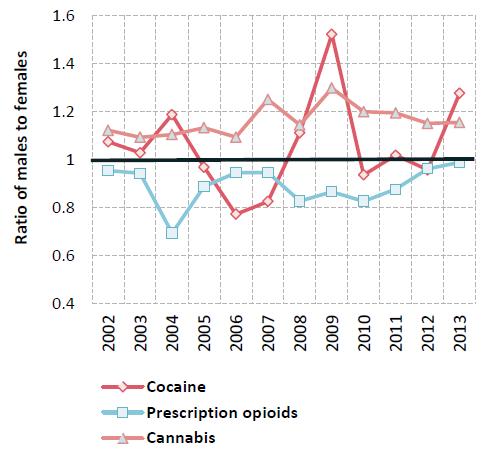
Overall, men are three times more likely than women to use cannabis, cocaine or amphetamines, whereas women are more likely than men to engage in the non-medical use of opioids and tranquilizers. Gender disparities in drug use are more attributable to opportunities to use drugs in a social environment than to either gender being more or less susceptible or vulnerable to the use of drugs. Moreover, while in most surveys the prevalence of drug use among young people is reportedly higher than among adults, the gender divide in drug use is narrower among young people than among adults.
DRUG SUPPLY AND MARKETS
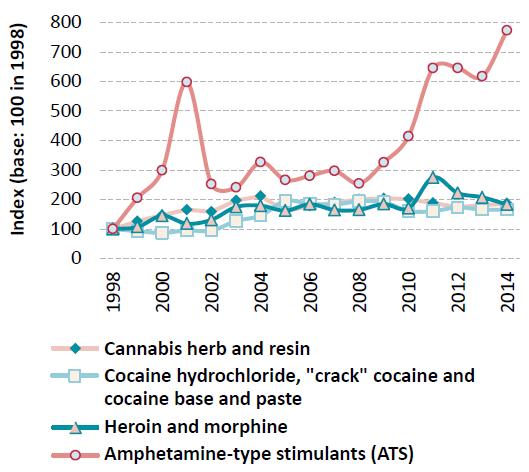
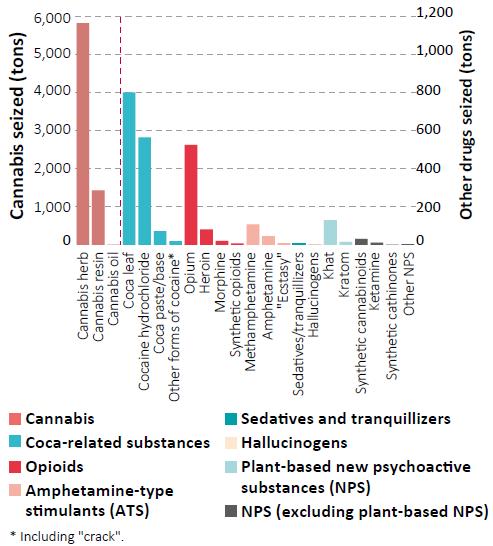
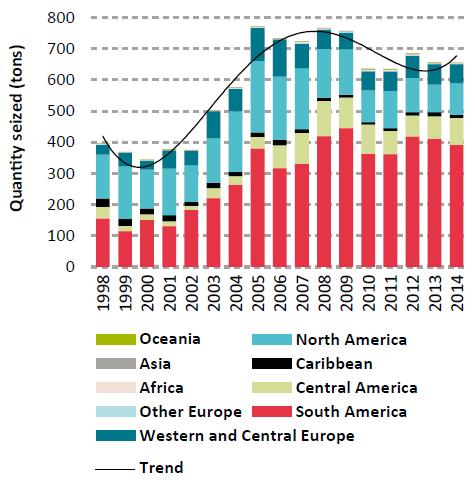
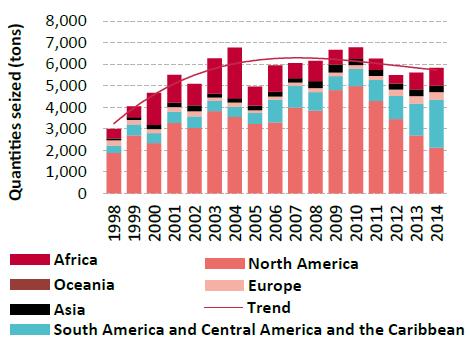
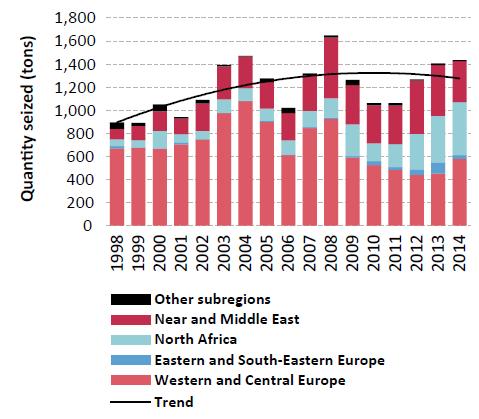
Trends in the quantities of drugs seized worldwide, 1998-2014
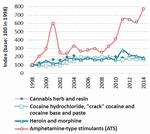
Click to enlargeSource: Responses to the annual report questionnaire
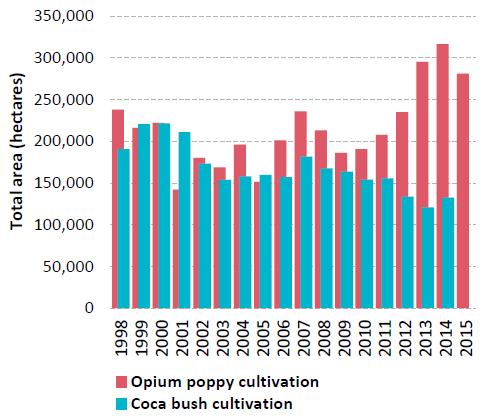
The most widely cultivated drug crop continues to be cannabis, which was reported by 129 countries over the period 2009-2014, far more than the 49 countries that reported opium poppy cultivation (mostly located in Asia and the Americas) and the 7 countries that reported coca cultivation (located in the Americas). Leaving aside the disparity in their respective numbers of cultivating countries, opium poppy cultivation has been decreasing in the past year while coca cultivation has been rising.
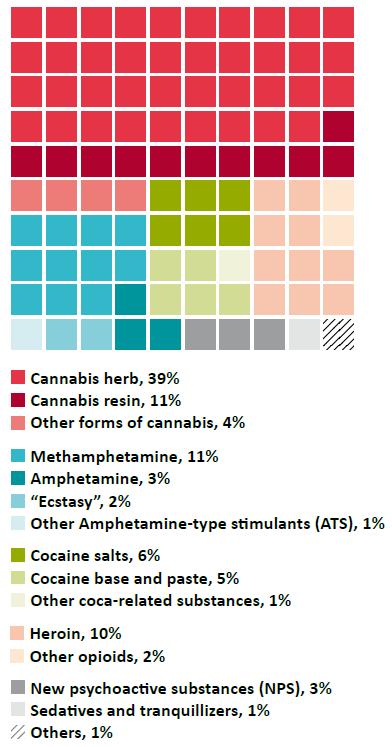
Cannabis also continues to be the most trafficked drug worldwide, while there has been a large increase in seizures of synthetic drugs. Although there were 234 substances under international control in 2014 (244 in January 2016), the bulk of trafficking (based on reported drug seizures, which reflect both law enforcement activity and drug flows) was concentrated on a far smaller number of substances. Cannabis in its various forms was intercepted in 95 per cent of reporting countries in 2014 and accounted for over half of the 2.2 million drug seizure cases reported to the United Nations Office on Drugs and Crime (UNODC) that year, followed by ATS, opioids and coca-related substances.
In all countries, more men (90 per cent of the total, on average) than women are brought into formal contact with the criminal justice system for trafficking in drugs or for possession of drugs for personal use. However, the reporting of gender-disaggregated data has improved over the years and shows an increased number of women arrested for drug-related offences in absolute terms. Nevertheless, the proportion of women in drug-related arrests, while fluctuating, showed a downward trend over the 1998-2014 period, particularly for drug trafficking-related offences.
Drug supply via the Internet, including via the anonymous online marketplace, the "dark net", may have increased in recent years. This raises concerns in terms of the potential of the "dark net" to attract new populations of users by facilitating access to drugs in both developed and developing countries.
Opiates
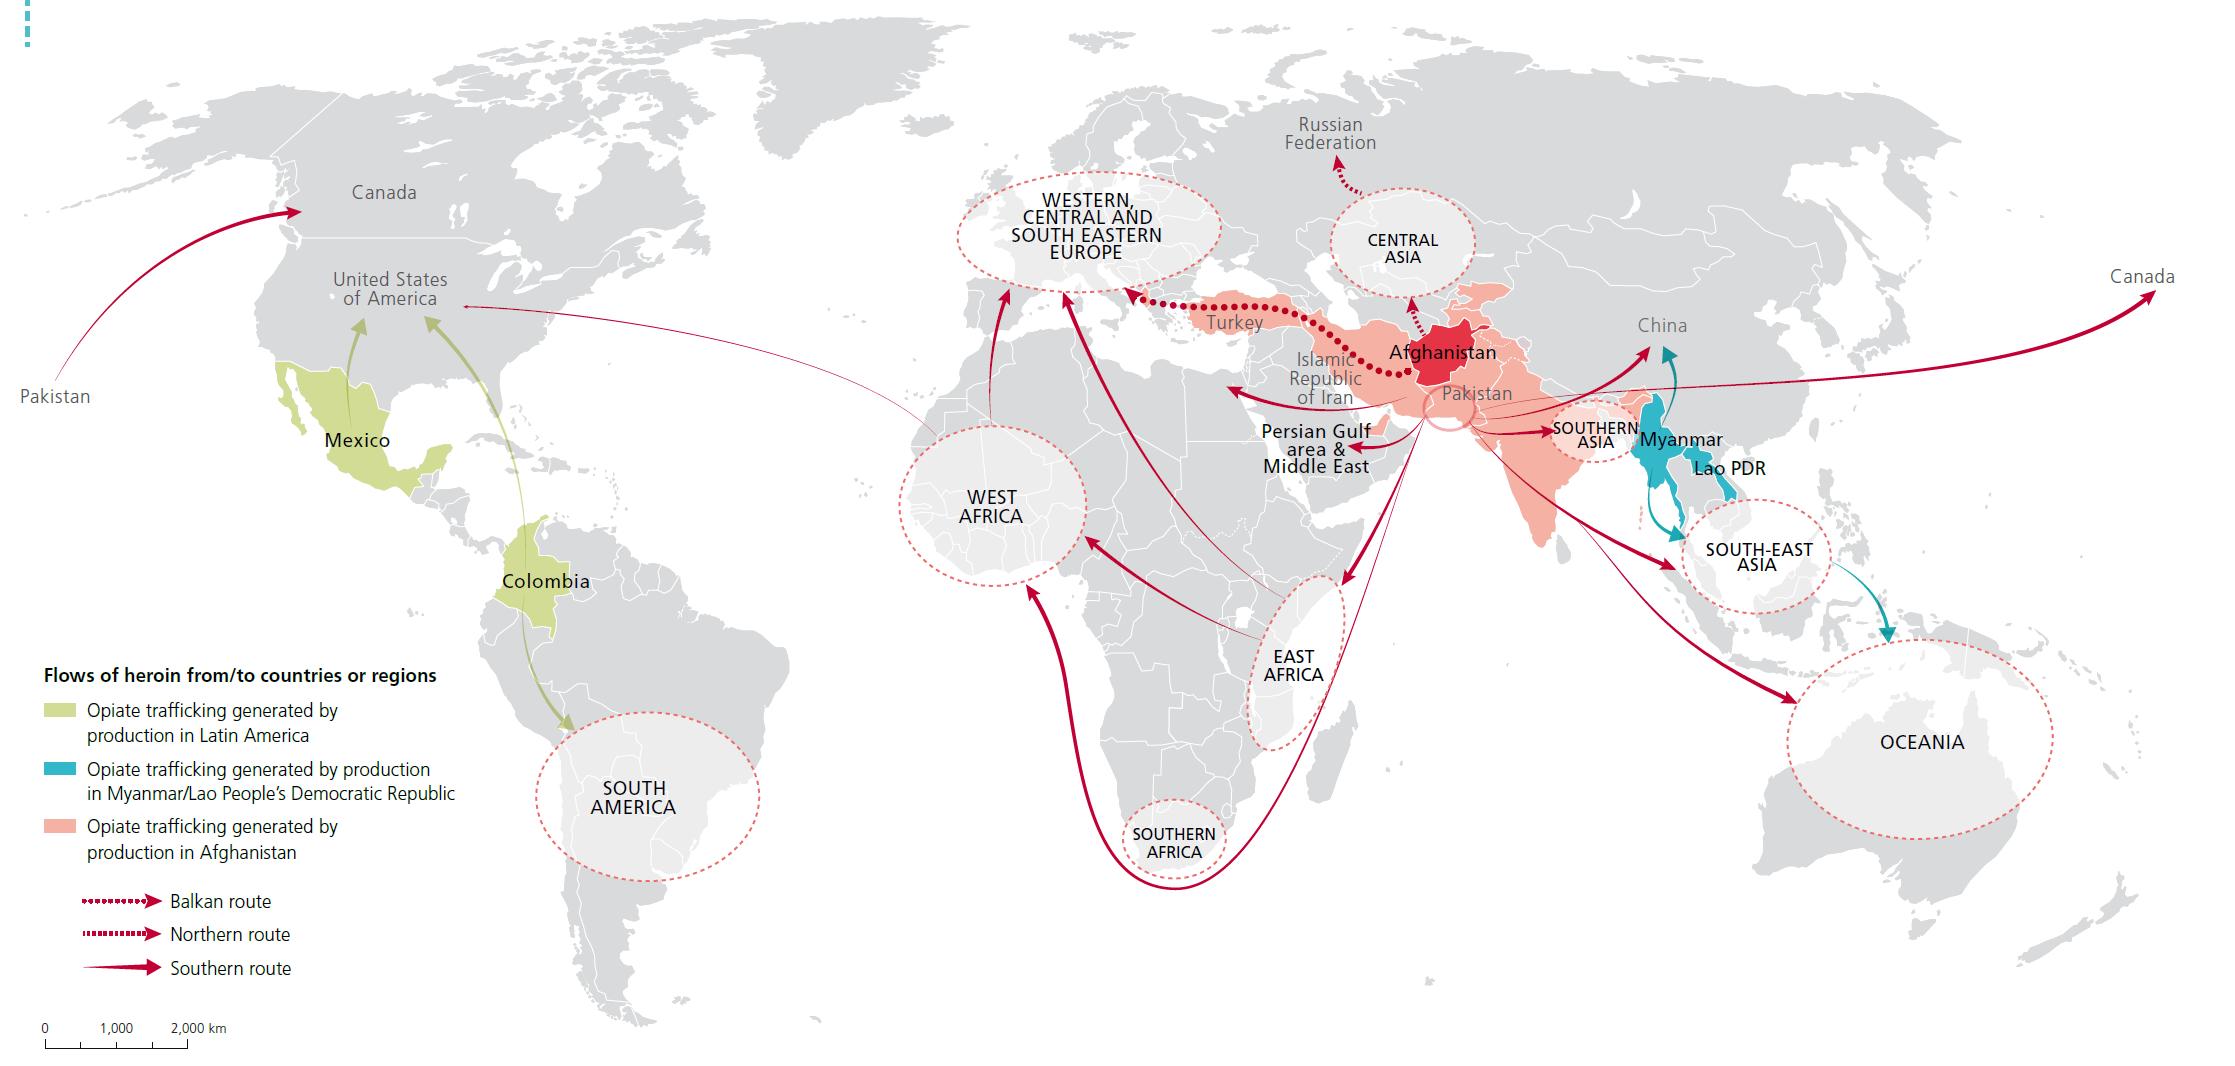
Main trafficking flows of heroin
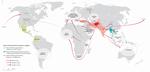
Click to enlargeSource: UNODC, responses to annual report questionnaire and individual drug seizure database
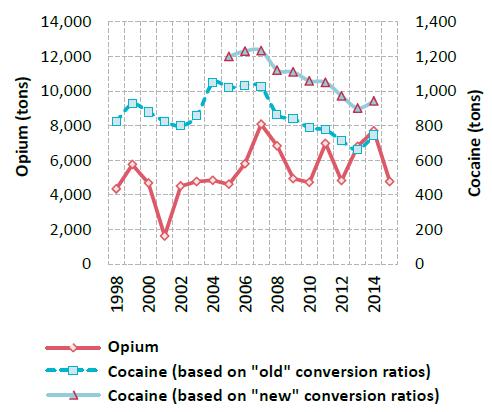
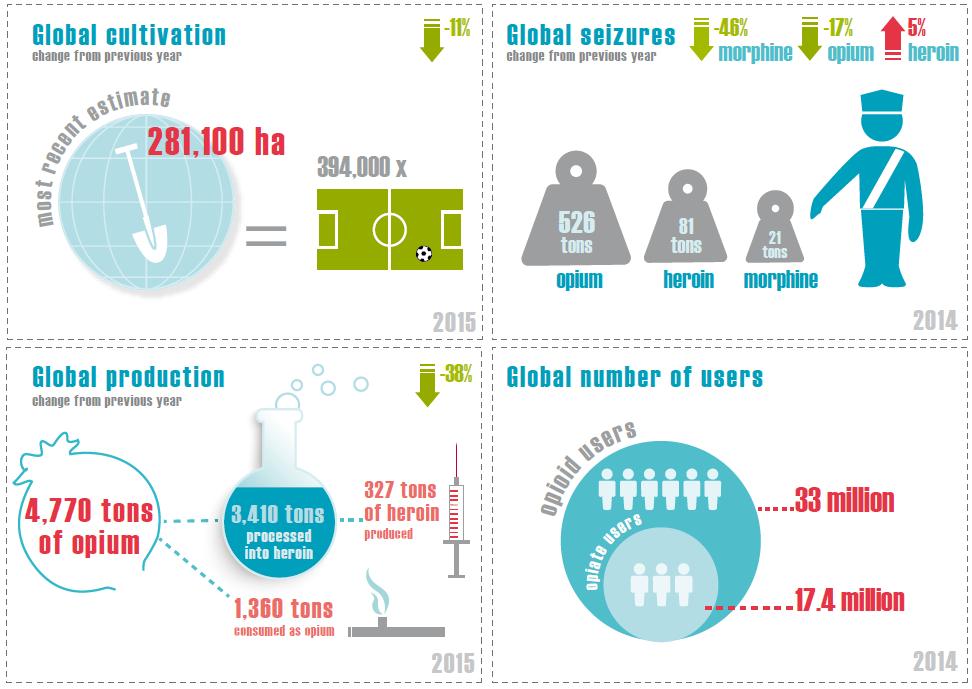
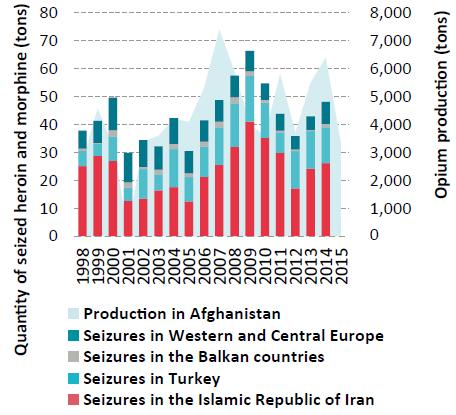
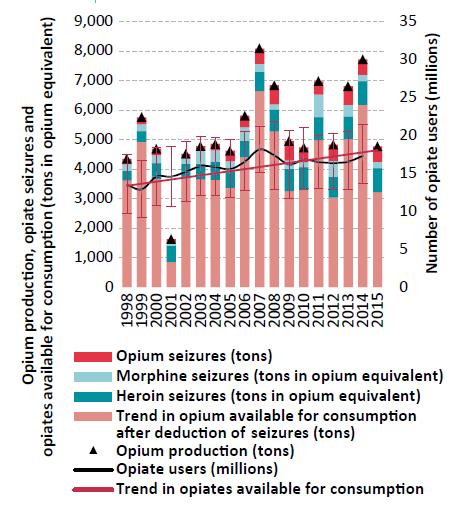
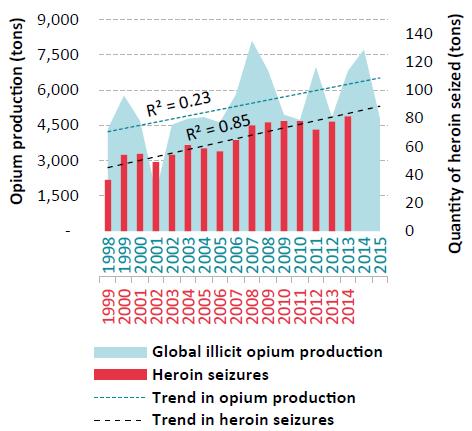
Notes: The trafficking routes represented on this map should be considered broadly indicative and based on data analyses rather than definitive route outlines. Such analyses are based on data related to official drug seizures along the trafficking route as well as official country reports and responses to annual report questionnaires. Routes may deviate to other countries that lie along the routes and there are numerous secondary flows that may not be reflected. The boundaries shown on this map do not imply official endorsement or acceptance by the United Nations. Dashed lines represent undetermined boundaries. The dotted line represents approximately the Line of Control in Jammu and Kashmir agreed upon by India and Pakistan. The final status of Jammu and Kashmir has not yet been agreed upon by the parties. The final boundary between the Sudan and South Sudan has not yet been determined.Primarily carried out in South-West Asia and, to a lesser extent, in South-East Asia and Latin America, global opium production in 2015 fell by 38 per cent from the previous year to some 4,770 tons, i.e., to the levels of the late 1990s. The decrease was primarily a consequence of a decline in opium production in Afghanistan (a decrease of 48 per cent from the previous year), mainly as a result of poor yields in the country's southern provinces. However, at 183,000 hectares, Afghanistan still accounted for almost two thirds of the global area under illicit opium poppy cultivation, which decreased by 11 per cent from the previous year to around 281,000 hectares.
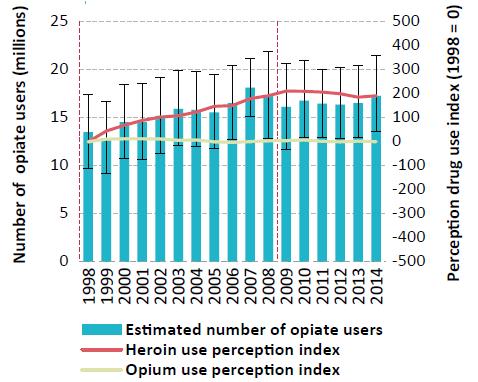
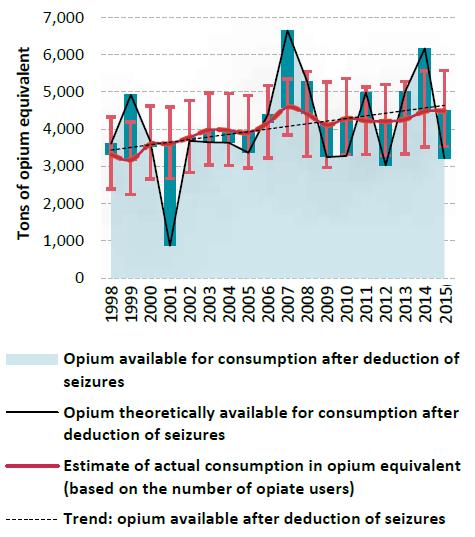
UNODC estimates indicate that the global number of opiate users (i.e., users of opium, morphine and heroin) has changed little in recent years and that opiates continued to affect some 17 million people in 2014. It seems unlikely that the sharp decline in opium production in 2015 will lead to major shortages in the global heroin market given the high opium production levels of previous years. The build-up or depletion of previous years' opium inventories may be used to offset annual changes in production and maintain the supply of heroin to user markets. It may take a period of sustained decline in opium production for the repercussions to be felt in the heroin market.
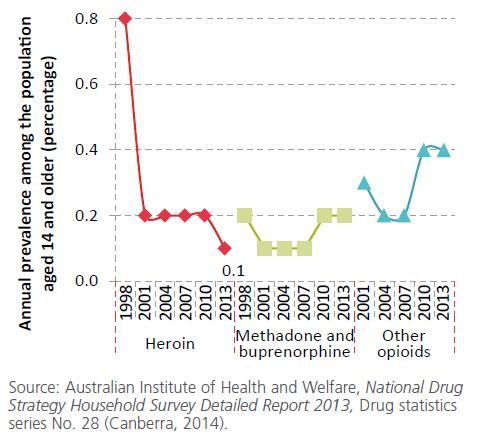
Indeed, the global opiate market appears to be stable despite important regional changes. There are indications that heroin use may be undergoing a resurgence in some countries where it was previously declining. Heroin use increased in North America in the past decade, which resulted in an increase in the level of heroin-related deaths. Long-term trends, in contrast, have been stable or declining in Western and Central Europe since the late 1990s. There are early signs, however, of a surge in the heroin market, with an increase in the availability and use of heroin in some markets in Europe, as well as a major increase in the size of individual seizure cases of heroin destined for Europe. Meanwhile, based on trend perceptions reported to UNODC, the use of opioids may have grown in Africa. Overall opiate use in Asia is reported by experts to have remained largely unchanged over the period 1998-2014 whereas opiate use in Oceania has declined.
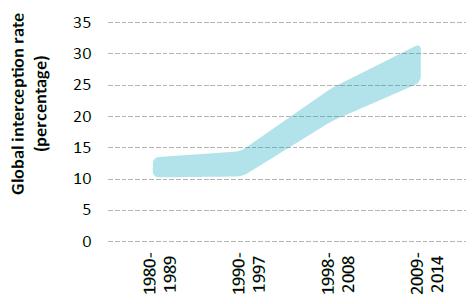
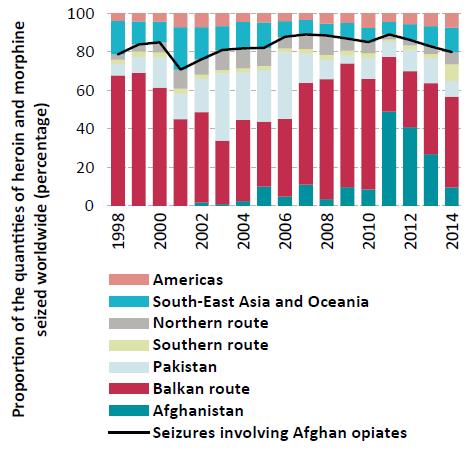
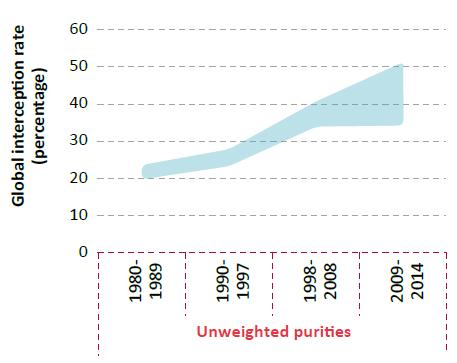
The global interception rate for opiates doubled from the period 1980-1997 (particularly after the special session of the General Assembly on the world drug problem in 1998) to the 2009-2014 period. The largest amount of opiates seized takes place in South-West Asia, followed by Europe. Accounting for 75 per cent of global opium seizures, 61 per cent of global morphine seizures and 17 per cent of global heroin seizures, the largest aggregated opiate seizures worldwide in 2014 were reported by the Islamic Republic of Iran.
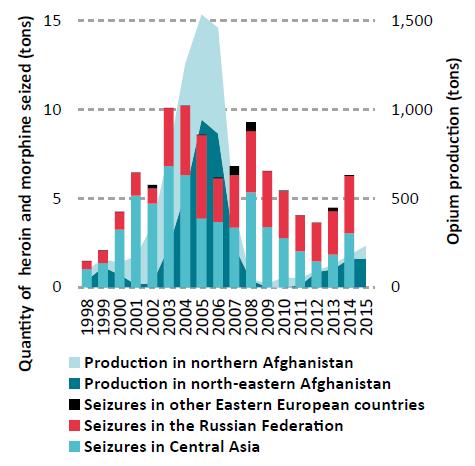
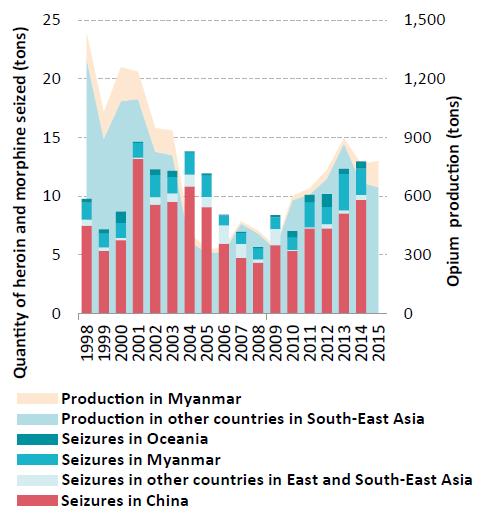
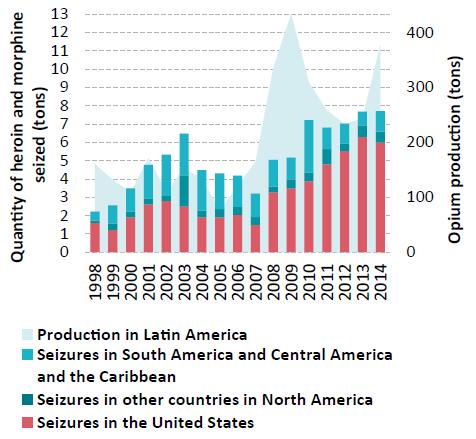
The so-called "Balkan route", which supplies Western and Central Europe with Afghan opiates, through Iran (Islamic Republic of) and Turkey via South-Eastern Europe, continues to be the most important conduit for heroin trafficking. However, the so-called "southern route" (through Pakistan or the Islamic Republic of Iran by sea to the Gulf region, Africa (particularly East Africa), South Asia and, to a lesser extent, South-East Asia, the Oceania region and North America), has grown in importance. Meanwhile, opiate trafficking on the so-called "northern route", from Afghanistan to neighbouring States in Central Asia, the Russian Federation and other countries of the Commonwealth of Independent States, has started to undergo a resurgence after the decline in the period 2008-2012, while trafficking out of the Golden Triangle is on the increase, mainly due to rising levels of opium production in Myanmar after 2006. Moreover, heroin trafficking in the Americas continues to increase, with heroin and morphine seizures rising from an average of 4 tons over the period 1998-2008 to 7 tons per year over the period 20092014, in line with reported increases in opium production in Latin America over those periods.
Cocaine
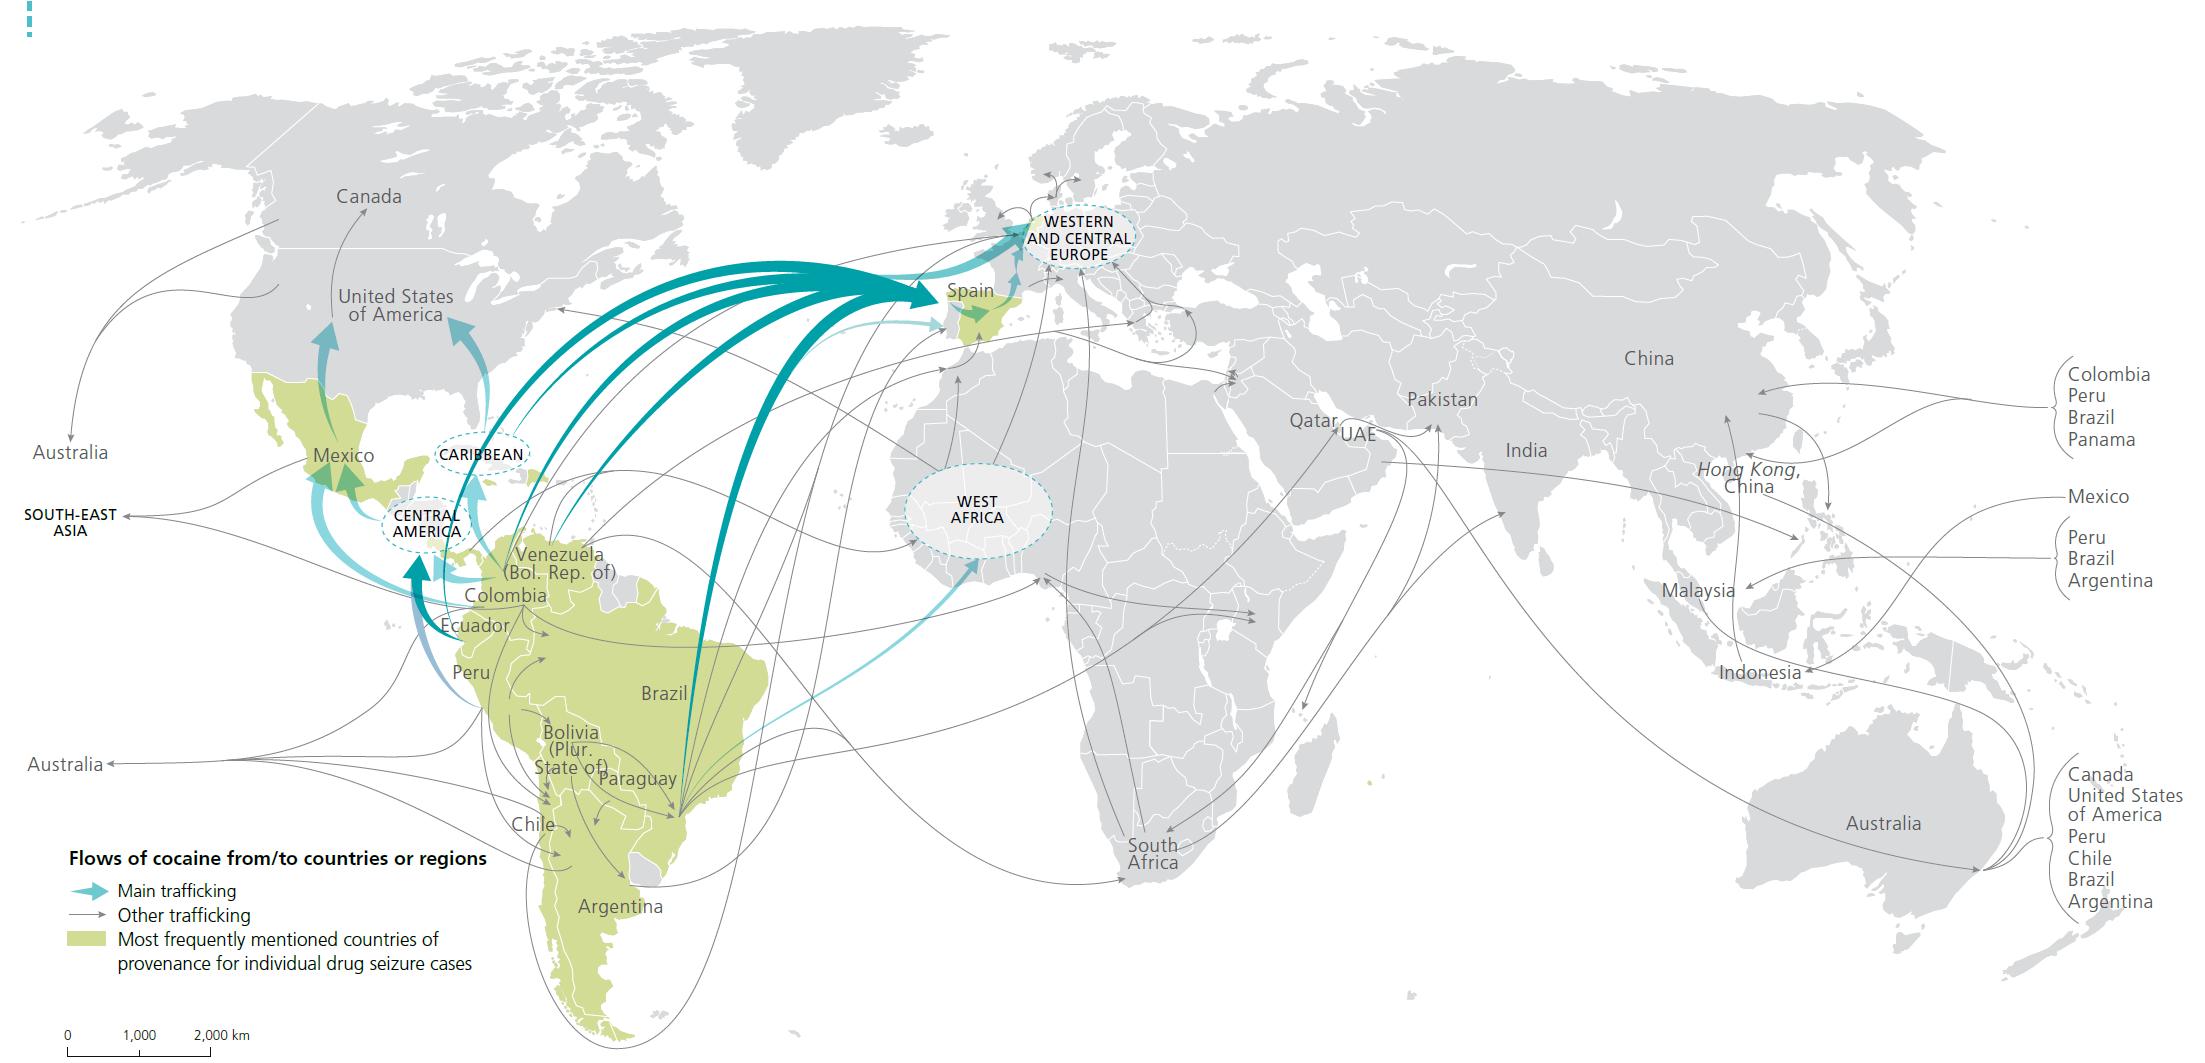
Main trafficking flows of cocaine
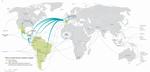
Click to enlargeSource: UNODC, responses to annual report questionnaire and individual drug seizure database
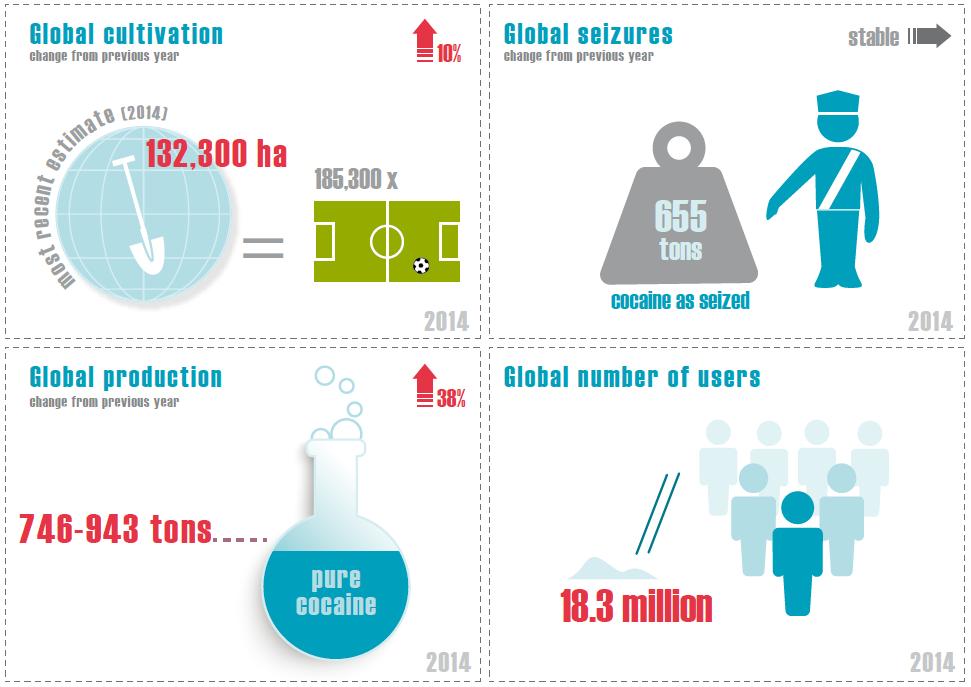
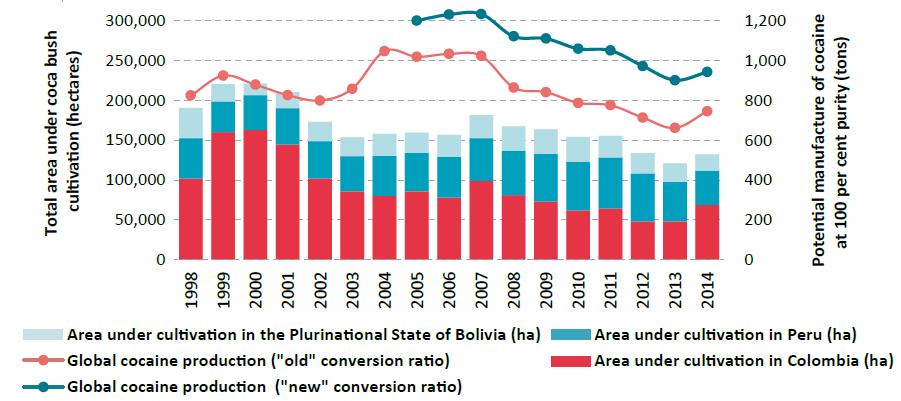
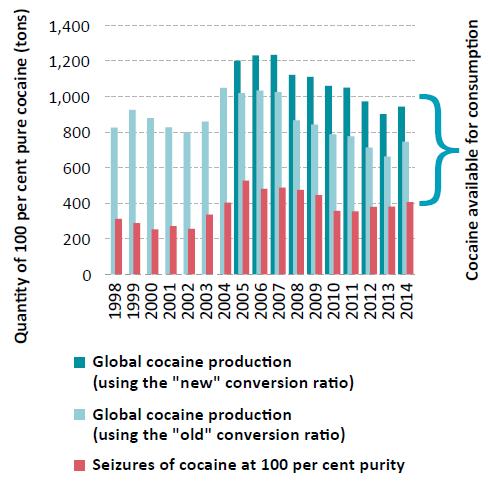
Notes: The trafficking routes represented on this map should be considered broadly indicative and based on data analyses rather than definitive route outlines. Such analyses are based on data related to official drug seizures along the trafficking route as well as official country reports and responses to annual report questionnaires. Routes may deviate to other countries that lie along the routes and there are numerous secondary flows that may not be reflected. The boundaries shown on this map do not imply official endorsement or acceptance by the United Nations. Dashed lines represent undetermined boundaries. The dotted line represents approximately the Line of Control in Jammu and Kashmir agreed upon by India and Pakistan. The final status of Jammu and Kashmir has not yet been agreed upon by the parties. The final boundary between the Sudan and South Sudan has not yet been determined.Although global coca bush cultivation in 2014 increased by 10 per cent from the previous year, the actual area under coca bush cultivation was the second smallest since the late 1980s. Global cocaine manufacture was slightly higher than in the previous year but still 24-27 per cent lower than the peak in 2007, and thus basically back to the levels reported in the late 1990s. At the same time, there are indications that the increase in global cocaine manufacture observed in 2014 was not a one-off event and may have continued in 2015.
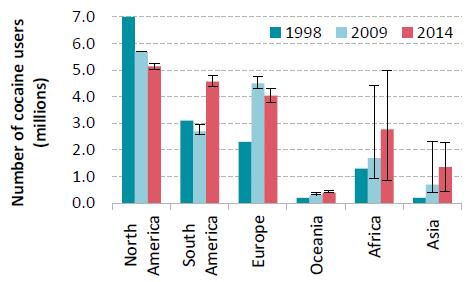
Cocaine trafficking via Africa may be regaining importance, and there are signs of increases in the trafficking of cocaine to Asia, particularly to East and South-East Asia and the Middle East, as cocaine seizures in Asia tripled from an average of 0.45 tons per year over the period 1998-2008 to 1.5 tons per year over the period 20092014. In Oceania, the cocaine market appears to be stabilizing, following rapid growth over the past decade.
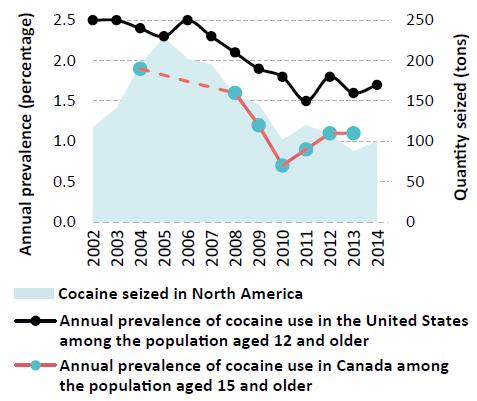
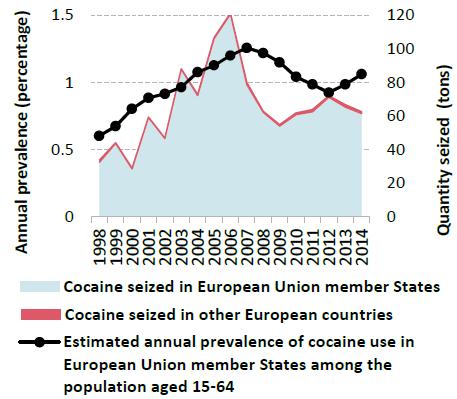
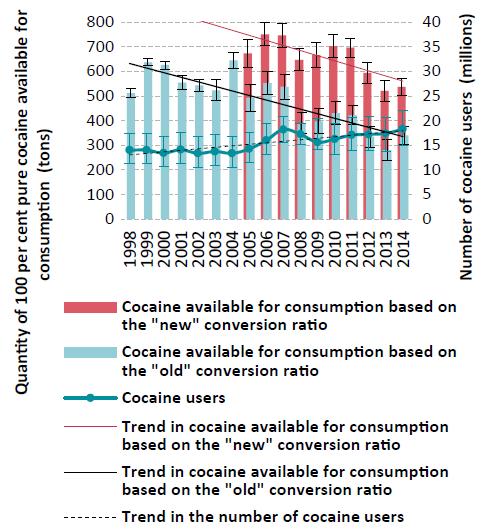
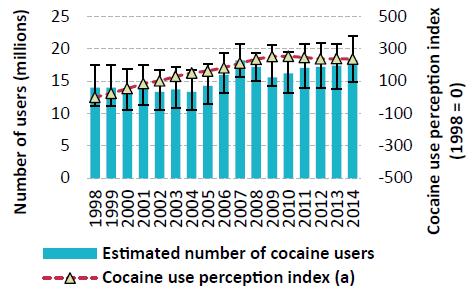
Despite these regional fluctuations, the annual prevalence of cocaine use remained largely stable at the global level over the period 1998-2014, fluctuating at between 0.3 and 0.4 per cent of the population aged 15-64. However, as the population has grown, the number of cocaine users has increased, from some 14 million in 1998 to 18.8 million in 2014. Meanwhile, it is likely that there has been a decline in per capita consumption of cocaine, prompted by a decline in the amount of cocaine available for consumption over the period 2007-2014, mainly linked to a drop in cocaine production in the Andean region. In parallel, the number of heavy cocaine users in North America has declined. This points to an overall shrinking of the cocaine market, although the number of (recreational rather than regular) cocaine users in several emerging markets continues to rise.
Cannabis
Despite major changes in some regions, global cannabis consumption has remained somewhat stable in recent years. In 2014, some 3.8 per cent of the global population had used cannabis in the past year, a proportion that has remained stable since 1998. Given the global population growth, this has gone in parallel with an increase in the total number of cannabis users since 1998. The Americas, followed by Africa, remain the main production and consumption regions for cannabis herb, with about three quarters of all cannabis herb seizures worldwide taking place in the Americas in 2014, the largest amounts in North America, while Africa accounted for 14 per cent of all cannabis herb seizures and Europe for 5 per cent. On the other hand, Europe, North Africa and the Near and Middle East remain the principal markets for cannabis resin, the majority of which continues to be produced in Morocco and Afghanistan, as reflected in information provided by Member States on the sources of cannabis resin seized. Accounting for 40 per cent of the total, the largest amounts of cannabis resin seized in 2014 took place once again in Western and Central Europe.
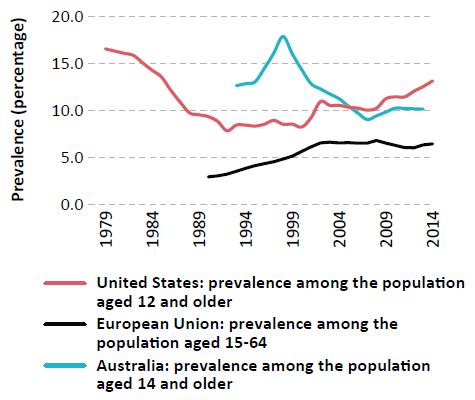
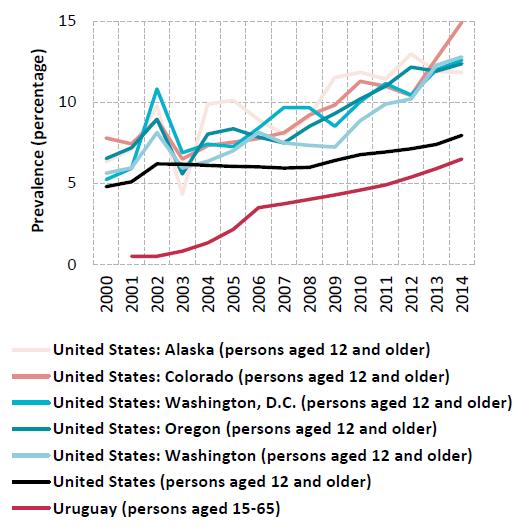
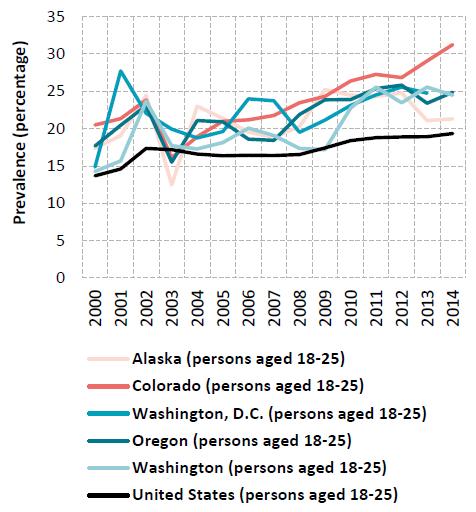
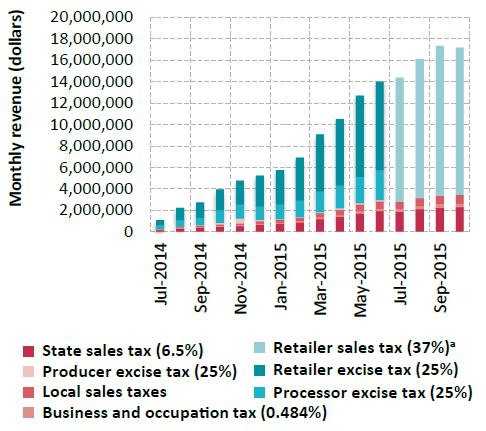
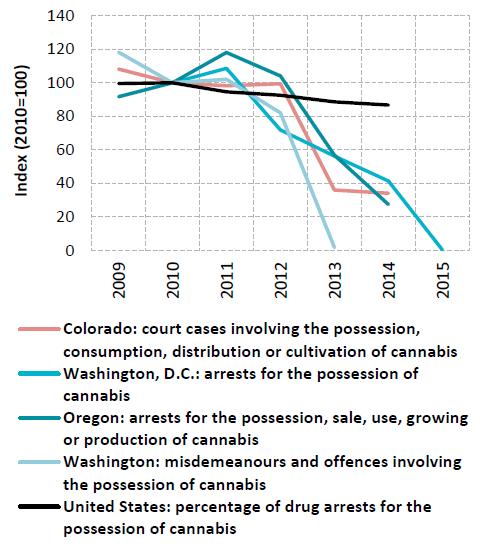
In the United States, although outcome measures such as the burden on the health and criminal justice systems need to continue to be monitored regularly, recent data from the states that have legalized marijuana for recreational use show an increase in cannabis use, as well as in public health and public safety indicators (cannabis-related emergency room visits, hospitalizations, traffic accidents and related deaths), while cannabis-related arrests, court cases and criminal justice system referrals into treatment have declined.
Synthetics: amphetamine-type stimulants and new psychoactive substances
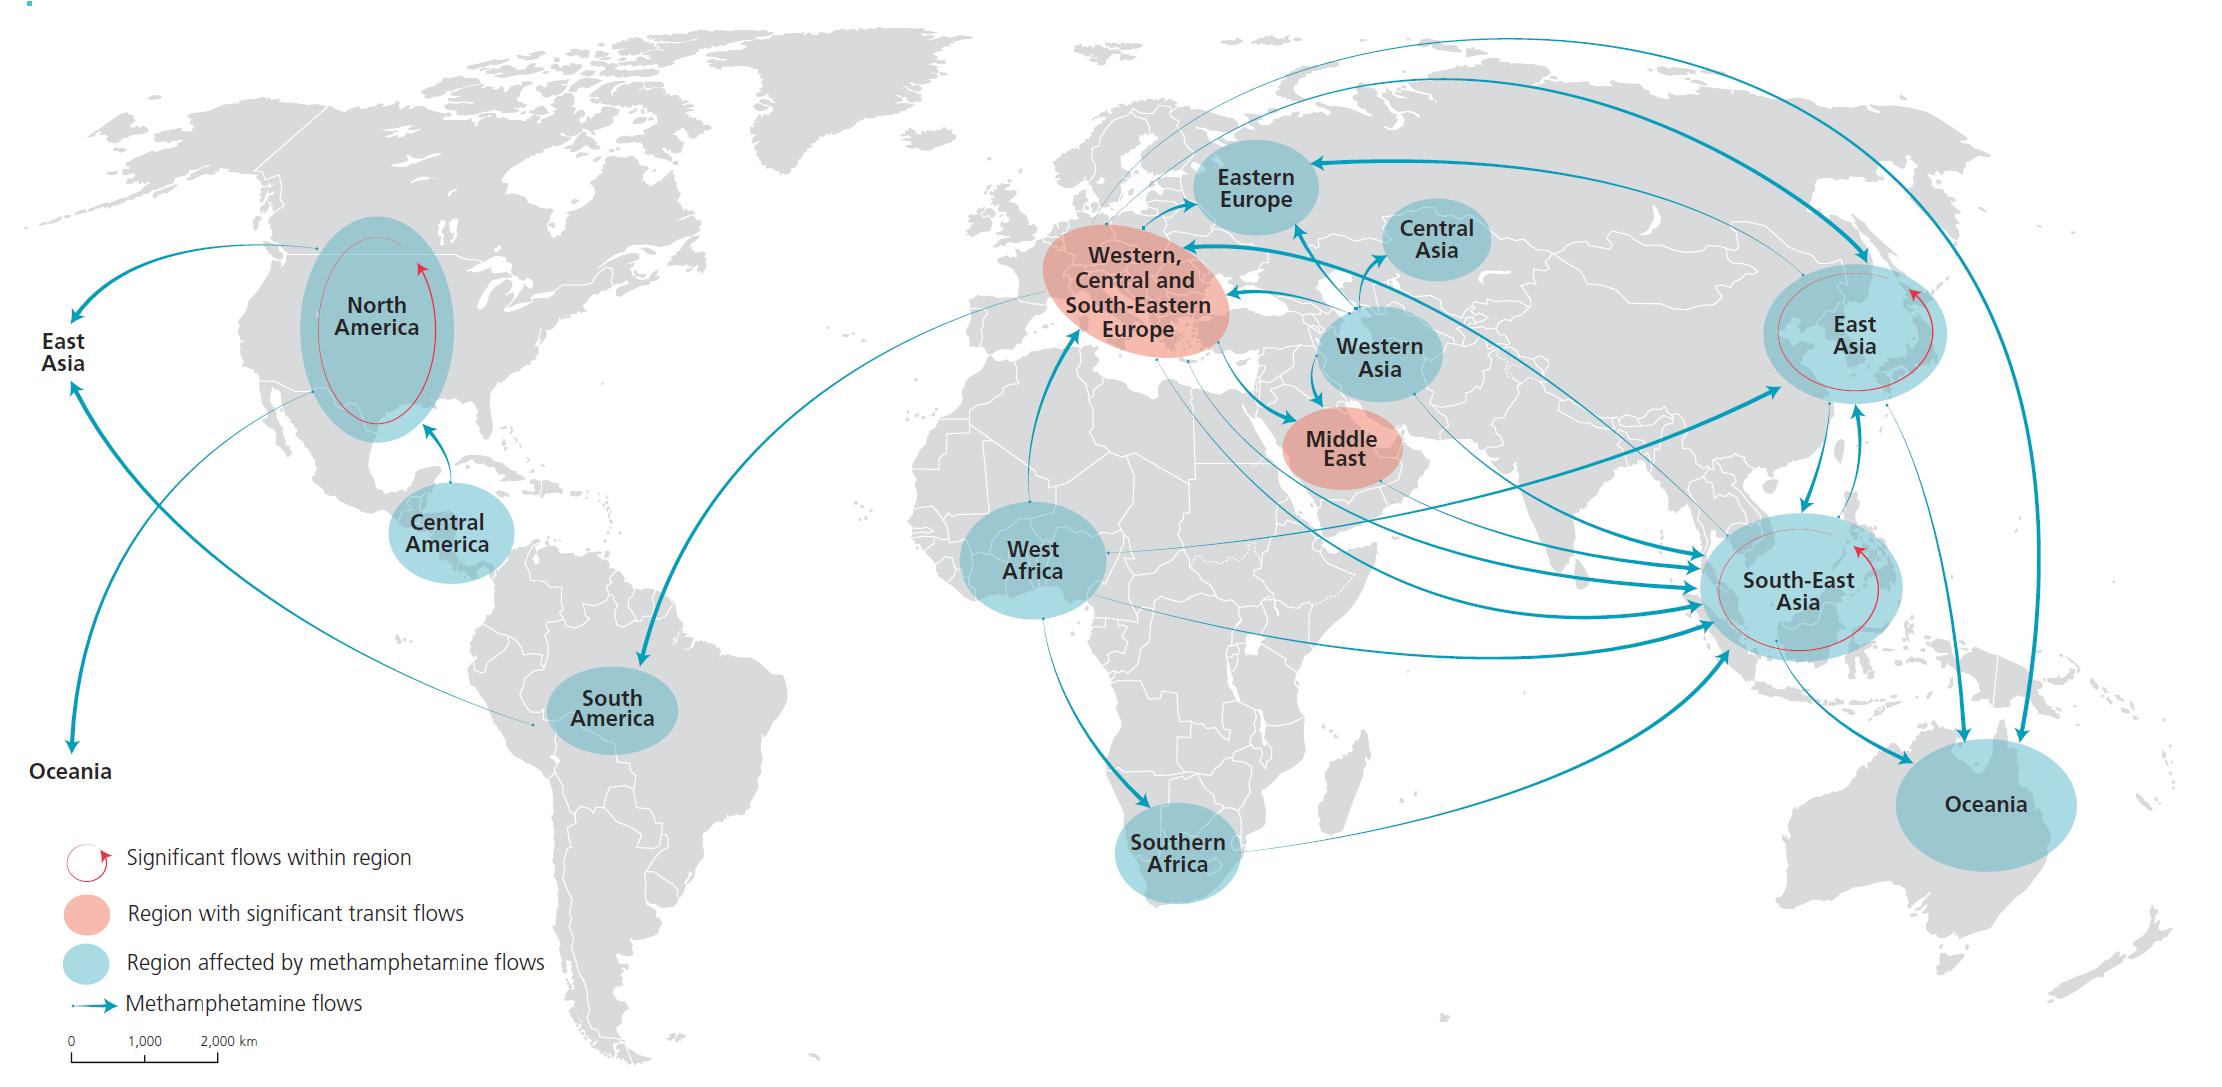
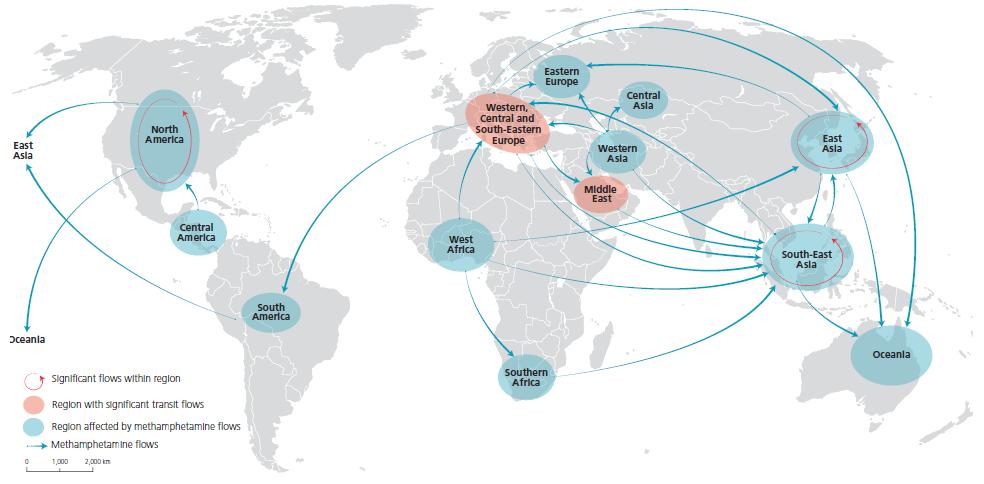
Interregional trafficking flows of methamphetamine, 2011-2014
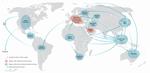
Click to enlargeSource: UNODC, responses to annual report questionnaire.
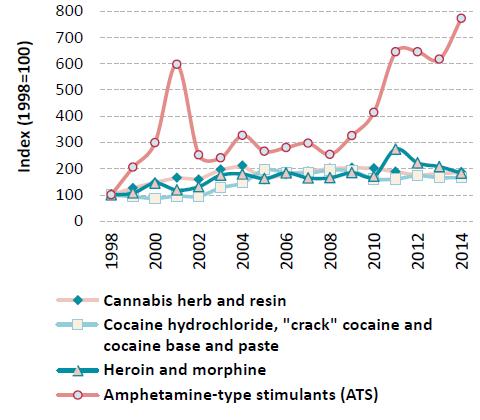
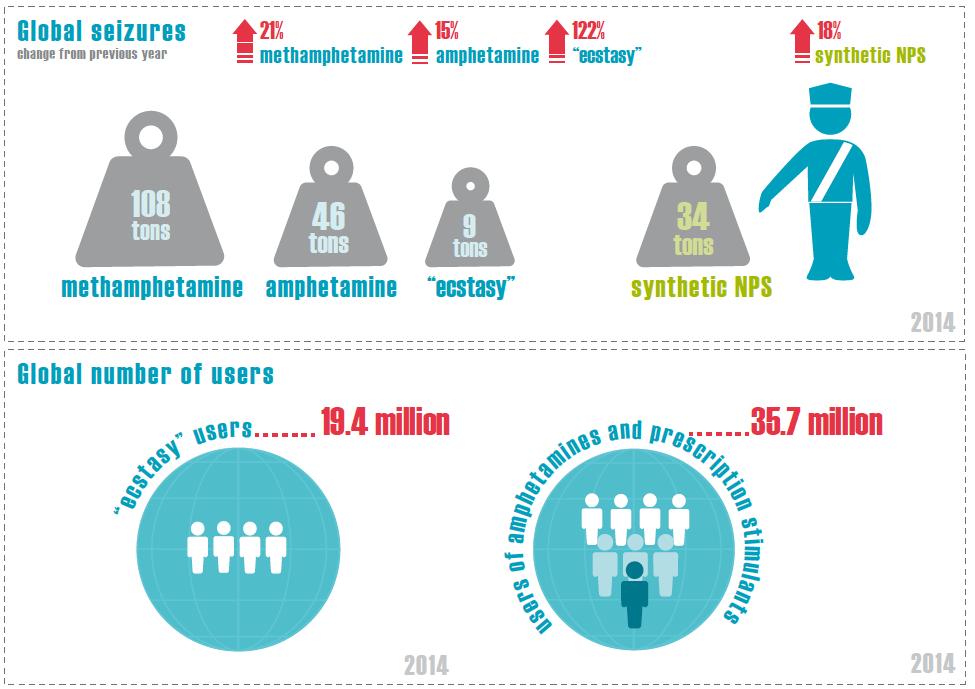
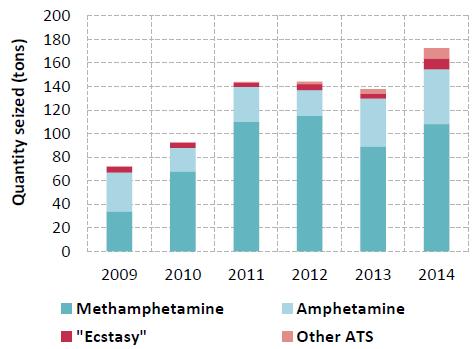
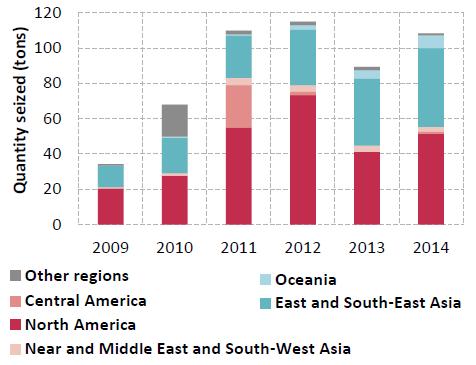
Note: The origins of the flow arrows do not necessarily indicate the source/manufacture of methamphetamine. These arrows represent the flows as perceived by recipient countries. Flow arrows represent the direction of methamphetamine trafficking and are not an indication of the quantity trafficked. The boundaries shown on this map do not imply official endorsement or acceptance by the United Nations. Dashed lines represent undetermined boundaries. The dotted line represents approximately the Line of Control in Jammu and Kashmir agreed upon by India and Pakistan. The final status of Jammu and Kashmir has not yet been agreed upon by the parties. The final boundary between the Sudan and South Sudan has not yet been determined.After three years of relative stability, ATS seizures reached a new peak of more than 170 tons in 2014. Since 2009, global amphetamine seizures have fluctuated annually between about 20 and 46 tons, while "ecstasy" seizures more than doubled in 2014, to 9 tons, compared with the annual averages of 4-5 tons since 2009. For the past few years, methamphetamine seizures have accounted for the largest share of global ATS seizures annually, but, although methamphetamine is a feature of ATS markets worldwide, it is particularly dominant in East and South-East Asia and North America. Since 2009, those subregions together have annually accounted for most global methamphetamine seizures. Compared with other subregions, North America has consistently reported the largest amount of methamphetamine seizures each year, whereas between 2009 and 2014, methamphetamine seizures reported in East and South-East Asia almost quadrupled.
In Oceania, strong increases in methamphetamine seizures have been recorded since 2012. There is a growing number of users of crystalline methamphetamine in the region, as well as increased frequency of use among certain user groups, an increase in methamphetamine purity and a decline in purity-adjusted prices, all of which could aggravate the negative impact on the health of individuals and on society in general.
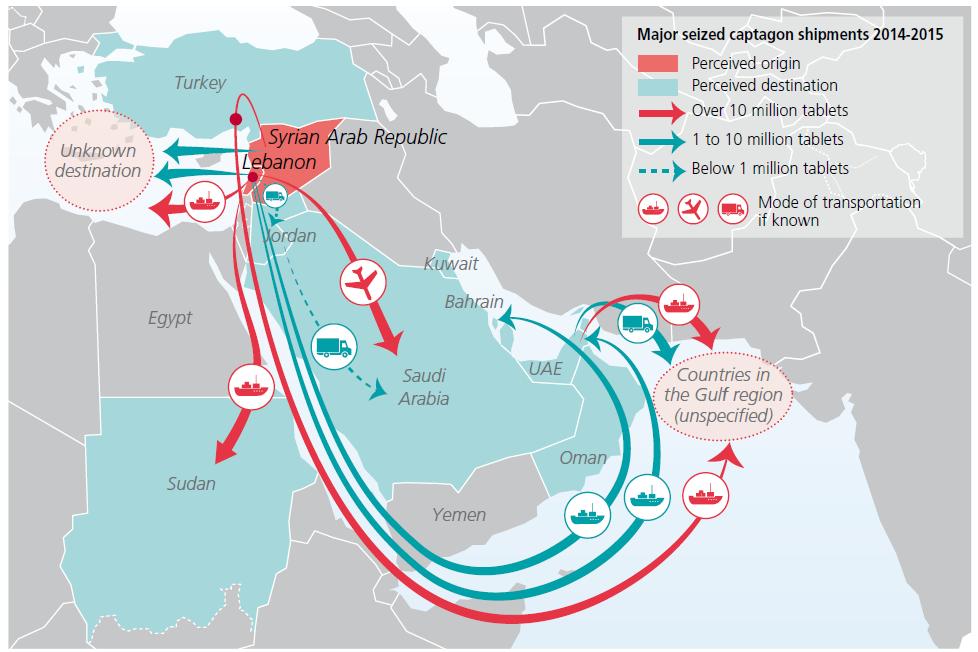
Large amounts of amphetamine tablets labelled with the brand name "Captagon" were reported to have been seized in the Middle East between March 2014 and November 2015. In 2013 and 2014, amphetamine seizures reported in the Middle East were mostly perceived to have originated in Lebanon and the Syrian Arab Republic. Over the same period, some countries reporting amphetamine seizures in the Middle East found that these were intended for trafficking onward to other destinations within the region.
The NPS market continues to be characterized by the large number of new substances being reported. Although data collection for 2015 is still in progress, 75 new substances have been reported to UNODC for the first time, compared with a total of only 66 new substances reported in 2014. Between 2012 and 2014, most substances reported for the first time belonged to the group of synthetic can-nabinoids, but the data reported for 2015 so far show a different pattern: firstly, almost as many synthetic cathi-nones (20) were reported for the first time as were synthetic cannabinoids (21); secondly, a wide range of substances (21) not belonging to any of the major groups identified in previous years were reported for the first time, which included synthetic opioids (e.g., fentanyl derivatives) and sedatives (e.g., benzodiazepines).
Significant quantities of NPS seized have been reported over the past few years. The global market for synthetic NPS continues to be dominated by synthetic cannabinoids (seizures of 32 tons), with North America (specifically the United States with 26.5 tons of seizures) accounting for the largest quantities seized worldwide in 2014, out of the global total of 34 tons (excluding plant-based NPS and ketamine). However, global seizures of synthetic cathi-nones have been steadily increasing since they were first reported in 2010, with seizures tripling to 1.3 tons in 2014 from the previous year.
UNODC monitoring of NPS since 2008 has so far shown a rather dynamic supply situation with elements of persistence (a small number of substances emerge, spread and stay for several years) and change (a considerable number of substances appear for a short time or only locally).
THE WORLD DRUG PROBLEM AND SUSTAINABLE DEVELOPMENT
"We welcome the 2030 Agenda for Sustainable Development, and we note that efforts to achieve the Sustainable Development Goals and to effectively address the world drug problem are complementary and mutually reinforcing."
Outcome document of the special session of the General Assembly on the world drug problem, entitled "Our joint commitment to effectively addressing and countering the world drug problem"
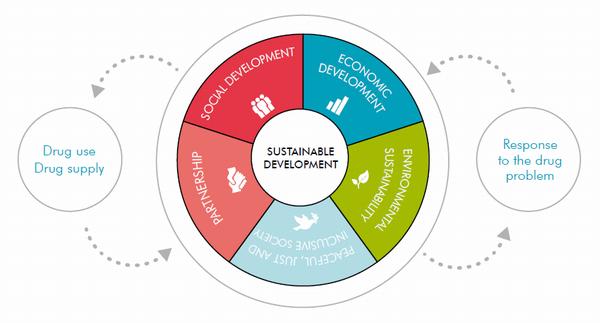
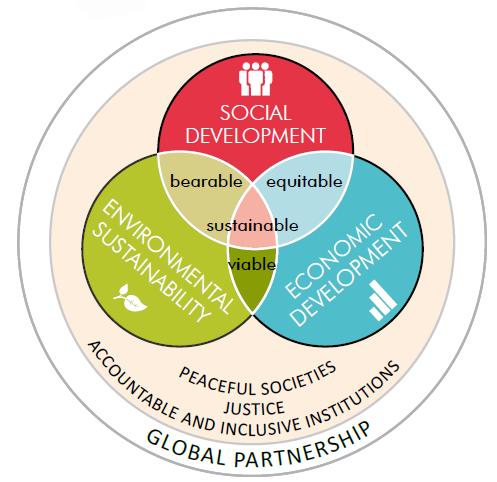
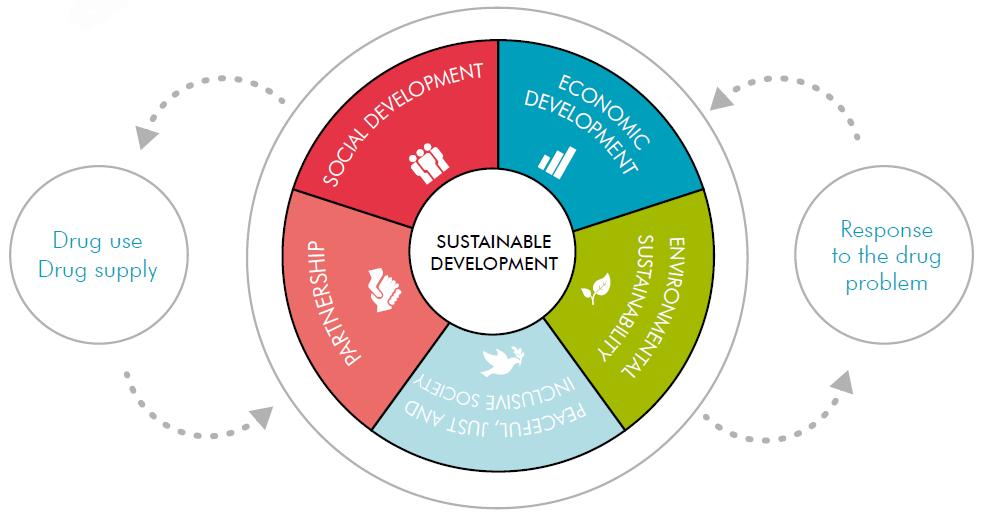
The world drug problem is intertwined with all aspects of sustainable development. The analysis of the drug problem, and the response thereto, through the lens of the Sustainable Development Goals reveals the mechanisms of this interaction. All areas of sustainable development, as identified in the 17 Sustainable Development Goals, shape the nature and dynamic of the drug problem. At the same time, the impact of the drug problem, and the response thereto, on development can be observed at the individual, community and national levels. In analysing those linkages, the 17 Sustainable Development Goals have been divided into five broad areas: social development, economic development, environmental sustainability, peaceful, just and inclusive societies, and partnership.
Social development
Sustainable Development Goal 10. Reduce inequality within and among countries
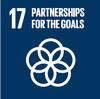
The failure to accept or understand that drug dependence is a health condition feeds the cycle of marginalization that often affects people with drug use disorders, making their recovery and social integration more challenging. Furthermore, stigmatizing attitudes towards people who use drugs, which may extend to staff in health-care services, can affect the delivery of effective treatment to those who most need it.
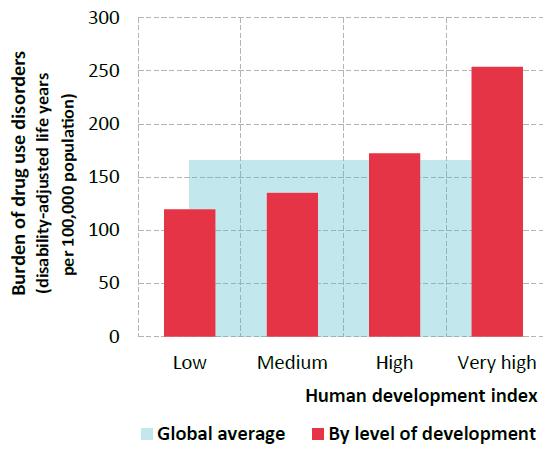
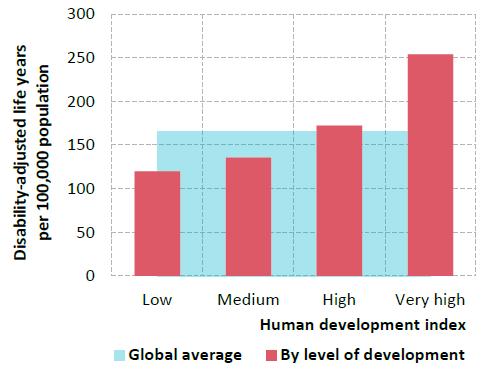
The health impact of drug use increases with development
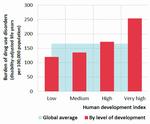
Click to enlargeSources: Human development index from the United Nations Development Programme (UNDP); data on burden of disease (disability-adjusted life years) are from the Institute for Health Metrics and Evaluation, University of Washington, GBD Compare, 2015. Available from http://vizhub.healthdata.org/gbd-compare.
Health
Sustainable Development Goal 3. Ensure healthy lives and promote well-being for all at all ages
The Global Burden of Disease Study indicates that opi-oids, cocaine, amphetamines and cannabis together accounted for almost 12 million life years lost due to premature death or disability in 2013, of which more than 8 million were linked to opioid use disorders. One of the risk factors for the negative health impact of drugs stems from their mode of administration. Injecting drug use, in particular, carries a much greater risk of overdose and infection, including the transmission of blood-borne viruses, such as HIV and hepatitis C, than does smoking, swallowing, snorting or inhaling drugs. Drug use may have repercussions on the health of society in general as PWID may become a group through which sexually transmitted diseases are passed on to other subgroups and the general population. Some studies also corroborate the hypothesis that the use of certain stimulants (whether injected or not) may also influence sexual behaviour itself, thereby increasing the likelihood of high-risk behaviour and sexual transmission — a pattern that raises concern particularly in the case of specific at-risk groups such as men who have sex with men.
Among its targets, Sustainable Development Goal 3 explicitly includes strengthening "the prevention and treatment of substance abuse, including narcotic drug abuse". Drug policies based on scientific evidence can, through measures such as prevention and treatment, mitigate the negative health impact of drug use. But when policies are not appropriately tuned to the principles of the international drug control conventions, they can undermine the accessibility of controlled drugs for both medical and research purposes. Three quarters of the global population still have little or no access to medicines containing narcotic drugs and have inadequate access to treatment for moderate to severe pain. The importance of the accessibility of essential medicines, which typically include controlled drugs such as morphine, codeine, diazepam and phenobarbital, has been recognized in target 3.b of the Sustainable Development Goals.
The world drug problem and sustainable development: a complex relationship
Women, girls and youth
Drug use undermines the aspect of sustainable development related to gender equality and the empowerment of women and girls. There are marked differences between male and female drug users in terms of preferred drugs and drug-related vulnerabilities. Coupled with the fact that users of several drug types are predominantly male, this leads to a danger that the entire continuum of care may fail to cater adequately for the needs of female drug users, who also have a lack of access to such services.
Sustainable Development Goal 5. Achieve gender equality and empower all women and girls
Women affected by drug dependence and HIV are more vulnerable and more stigmatized than men. They suffer from co-occurring mental health disorders to a greater extent than men, and they are more likely to have been victims of violence and abuse. Women often also bear a heavy burden of violence and deprivation associated with the drug dependence of family members, hindering the achievement of the sustainable development target of eliminating all forms of violence against all women and girls. Female offenders and prisoners, especially those with drug use disorders, face particular hardship as, in many instances, criminal justice systems are not yet equipped for the special needs of women.
Drug use often affects people during their most productive years. When youth become trapped in a cycle of drug use, and even in the drug trade itself, as opposed to being engaged in legitimate employment and educational opportunities, distinct barriers are effectively raised to the development of individuals and communities.
Economic development
Sustainable Development Goal 1. End poverty in all its forms everywhere
The toll taken by the drug problem may vary in size and shape across countries, both developed and developing, but in one way or another it affects all. Vulnerability to drugs, be it in terms of cultivation, production, trafficking or use, exists in countries at all levels of development.
The relationship between economic development and drugs is particularly evident in the case of the illicit cultivation of drug crops. In rural areas, socioeconomic elements such as poverty and a lack of sustainable livelihoods are important risk factors leading farmers to engage in illicit cultivation. They are also manifestations of poor levels of development which, alongside other development issues linked to security and governance, are enabling elements of large-scale illicit cultivation.
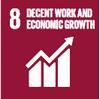
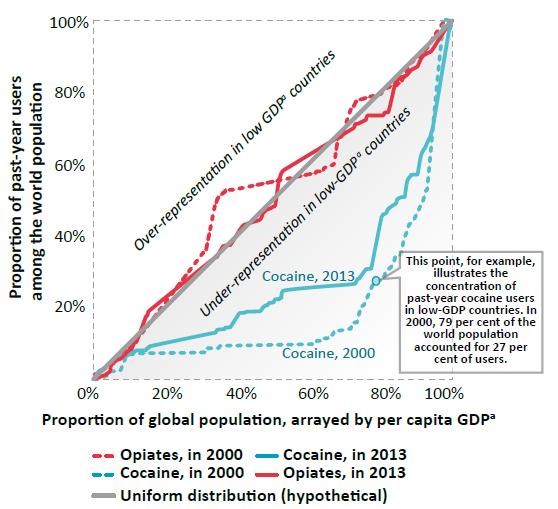
The impact of income on drug use depends on the type of drug
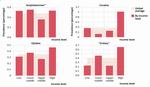
Click to enlargeSource: World Bank (for income levels) and UNODC estimates based on responses to the annual report questionnaire and other official sources (for drug use data).
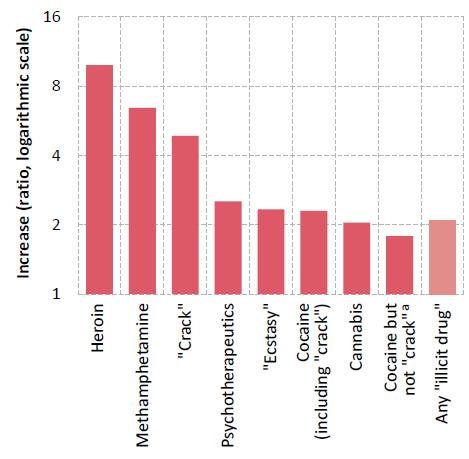
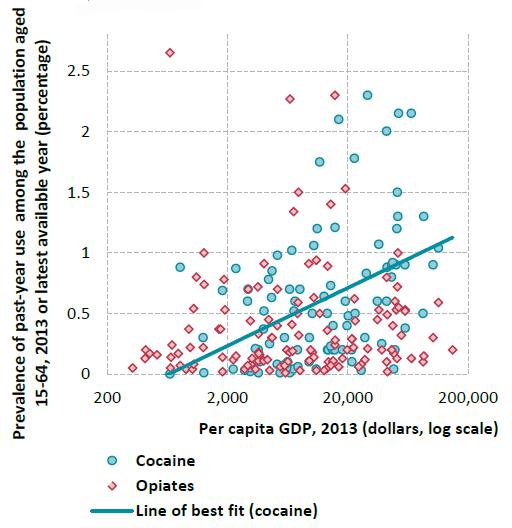
* Including prescription stimulants.Higher socioeconomic groups have a greater propensity to initiate drug use than lower socioeconomic groups, but it is the lower socioeconomic groups that pay the higher price as they are more likely to become drug dependent
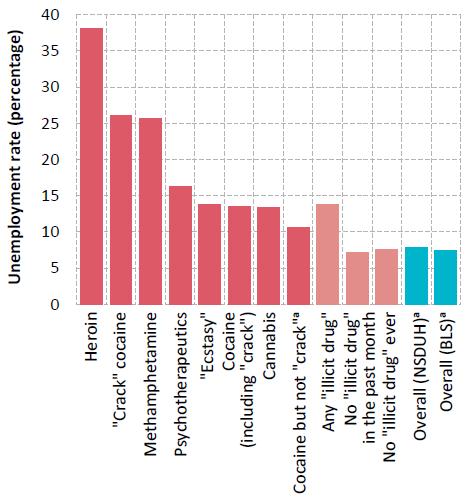
Poverty also has strong links with drug use, albeit in a complex and mutually reinforcing manner. Indeed, the brunt of the drug use problem is borne by people who are poor in relation to the societies in which they live, as can be seen in stark terms in the wealthier countries. More broadly, there is a strong association between social and economic disadvantage and drug use disorders. This pattern can also be seen when looking at different reflections of marginalization and social exclusion, such as unemployment and low levels of education.
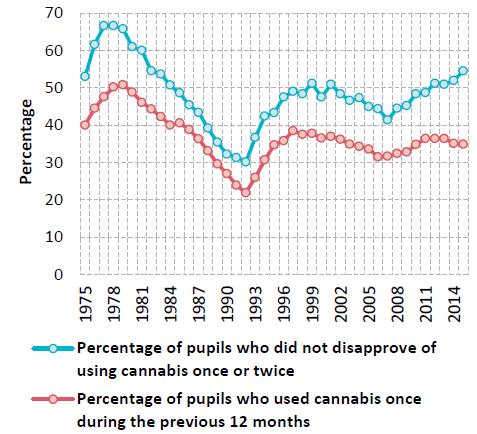
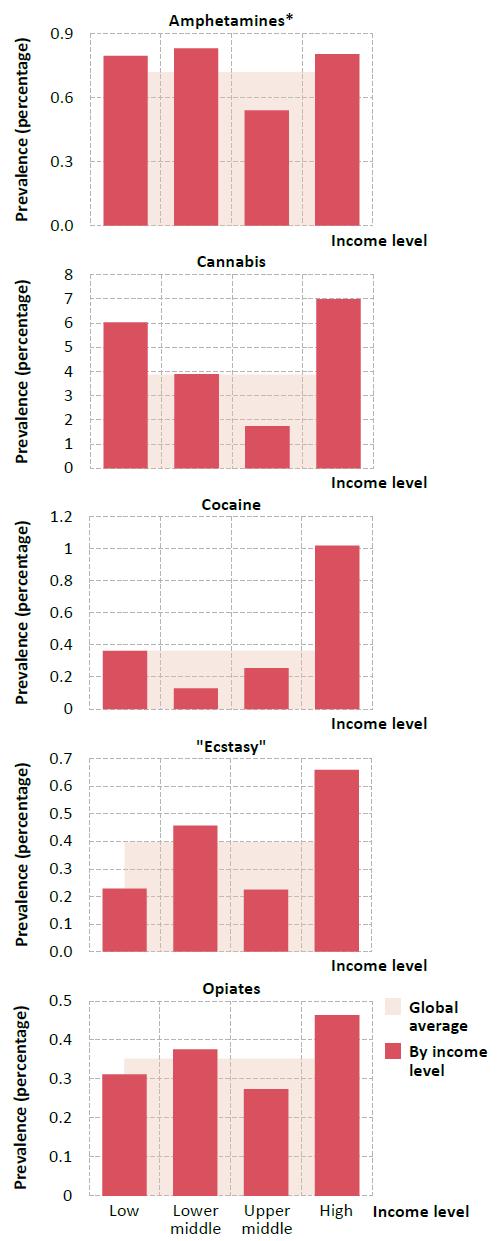
Beyond development, a multitude of factors, including geographic location, play a role in shaping the drug problem in a given country. Proximity to a drug-producing area or a major drug trafficking route can, for example, explain the above-average rates of opiate use in the Near and Middle East and South-West Asia, and use of cocaine, including "crack" cocaine, in South America and West Africa. A breakdown of national data on people who use drugs, based on income level, shows, however, that "high-income" countries tend to have a higher prevalence of past-year drug use across the drug categories. Drugs that can command a relatively high price, and ultimately higher profits for traffickers, find an easier foothold in countries with relatively higher levels of per capita income. In the case of substances such as cocaine and heroin, the level of economic development contributes to the formation of consumer markets that are large in terms of both number of users and total revenue.
Different levels of socioeconomic well-being within individual countries also have an effect on the type of drugs used. For example, in the United States, the association between drug use and unemployment is much stronger in the case of "crack" cocaine than other types of cocaine.
Drug markets tend to be influenced by local idiosyncrasies in both developed and developing countries, but sizeable markets for certain substances, notably cocaine and synthetic substances, have taken hold in developed countries before subsequently expanding to developing countries. Prime examples are the emergence of "ecstasy" and other hallucinogens in North America and Europe, as well as the ongoing proliferation of the consumption of NPS in Europe, Japan and North America. The relationship between development and the drug problem thus needs to be viewed in dynamic terms.
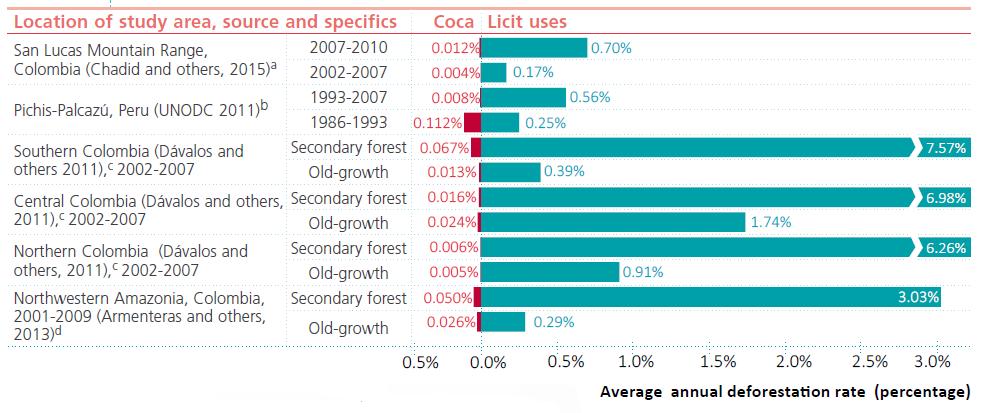
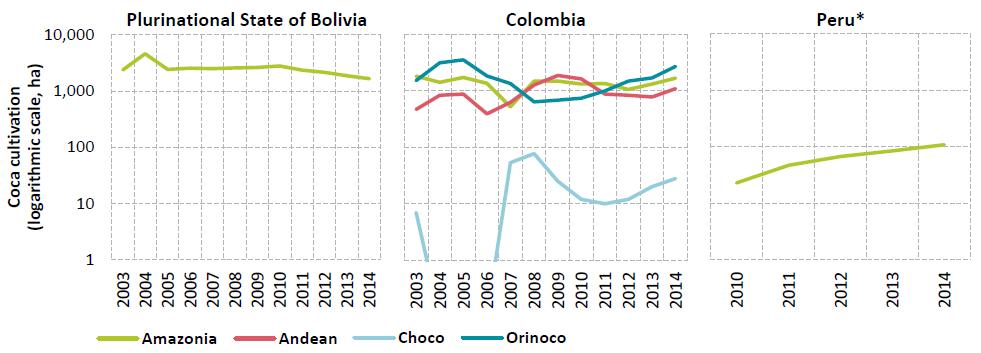
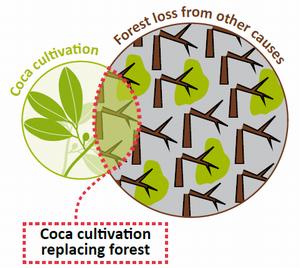
Coca cultivation and deforestation in perspective
Environmental sustainability
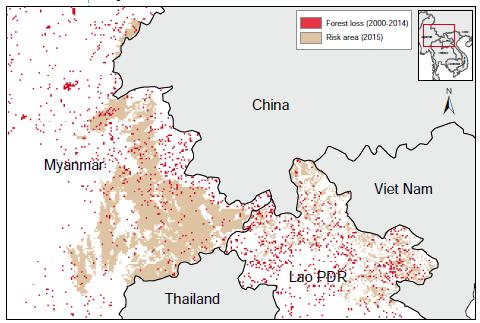
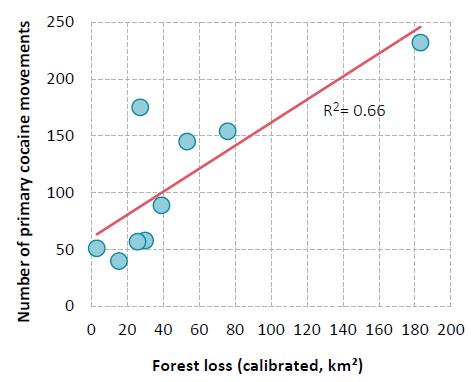
Sustainable Development Goal target 15. 5. Take urgent and significant action to reduce the degradation of natural habitats, halt the loss of biodiversity and, by 2020, protect and prevent the extinction of threatened species Illicit crop cultivation often occurs in forested areas and contributes to deforestation when it results in the clearing of woodland. Moreover, illicit crop cultivation frequently takes place in biodiversity hotspots hosting a large number of species with a limited habitat, some of which are protected areas. It tends to occur close to the agricultural frontier, which demarcates the border between pristine forest and developed areas, and can result in the clearing of forests. Although empirical evidence and rigorous analysis do not support the claim that illicit cultivation is the major driver of deforestation, research does suggest that a lack of rural development drives the phenomenon. Analysis has shown, moreover, that drug trafficking can have a direct impact on deforestation through the construction of infrastructure such as landing strips and illegal roads, as well as indirectly through the privatization of public land to create "narco-estates". When eradication induces a displacement of the location of drug crops it may result in deforestation as farmers react to eradication initiatives and seek places out of the reach of law enforcement.
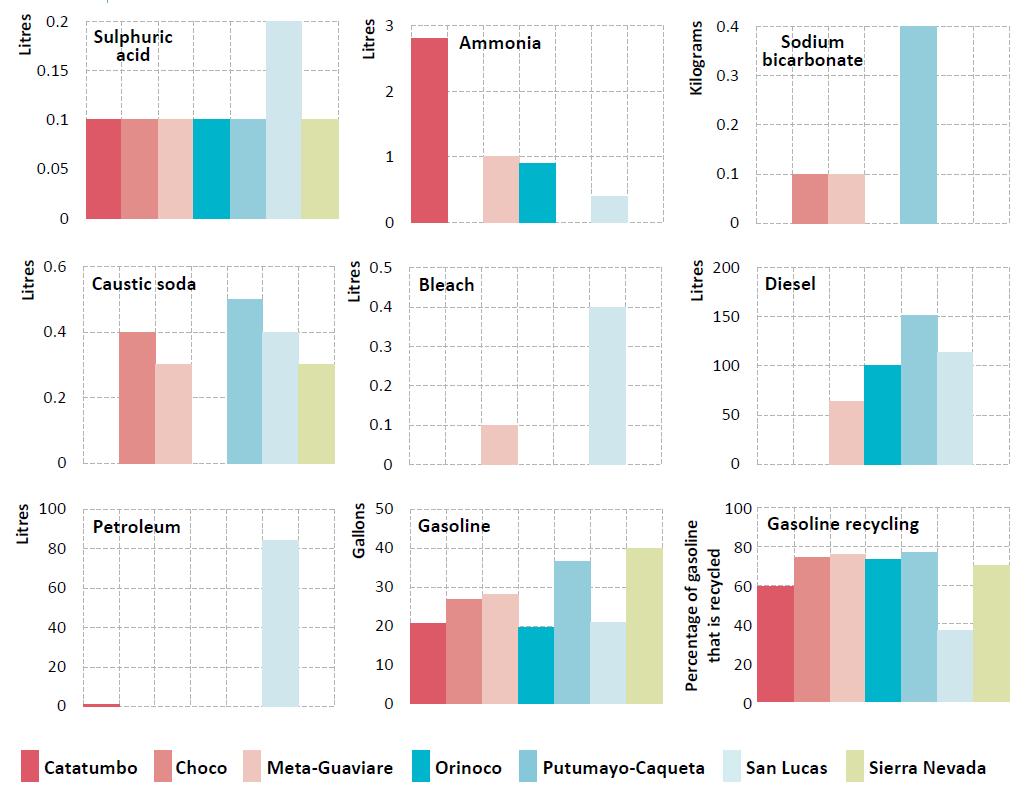
The disposal of chemicals used in the illicit manufacture of cocaine and opiates can also have negative consequences on the environment, contributing to pollution and health hazards in rural communities. In the case of synthetic drugs, the consequences in urban settings not only pose health risks but may also have an impact on the urban and industrial environment.
Peaceful, just and inclusive societies
Violence, rule of law, corruption, illicit financial flows
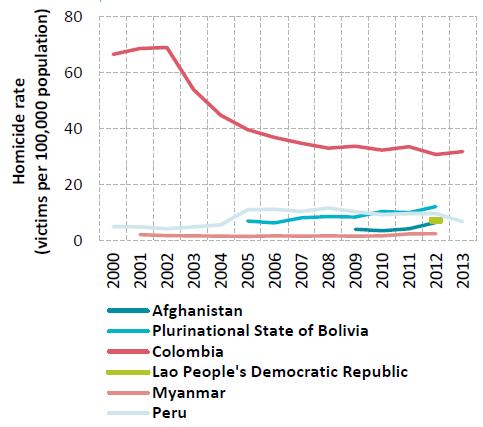
Globally, there is no clear-cut relationship between drug supply and violence
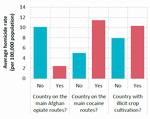
Click to enlargeSource: UNODC Homicide Statistics (2015). Available at www. unodc.org/unodc/en/data-and-analysis/homicide.html.
Sustainable Development Goal 16. Promote peaceful and inclusive societies for sustainable development, provide access to justice for all and build effective, accountable and inclusive institutions at all levels Among the targets associated with Sustainable Development Goal 16, those related to reducing violence, strengthening the rule of law and access to justice, and fighting organized crime, economic crime (corruption and bribery) and illicit financial flows, all have significant links with the world drug problem and the response to it.
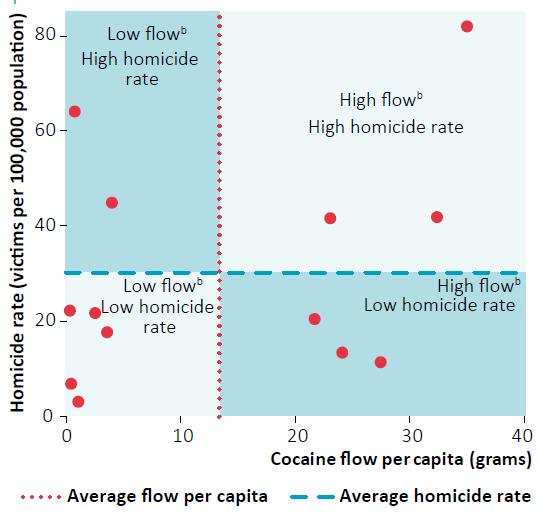
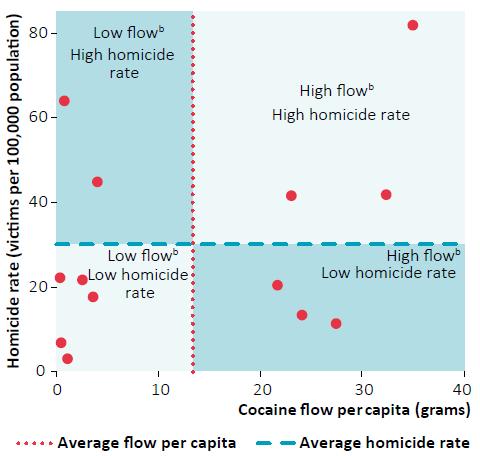
The connection between drug trafficking and violence in Latin American countriesa is not an automatic one
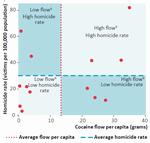
Click to enlargeSources: Estimates of the flow of cocaine based on United States, Office of National Drug Control Policy, "Cocaine Smuggling in 2010", January 2012; homicide data from UNODC Homicide Statistics (2016). Available at www.unodc.org/unodc/en/data-and-analysis/homicide.html.
a Data were available for 13 countries.
b All flows are expressed per capita.Different stages of the drug problem result in different manifestations of violence. Drug use may lead to violence related to the psychoactive effects of drugs, as well as to crime committed in order to obtain funds for purchasing drugs. The intensity of drug-related violence is greatest, however, when associated with drug trafficking (systemic violence), as the example of Latin America shows. The traumatic effects of violence can also increase vulnerability to drug use.
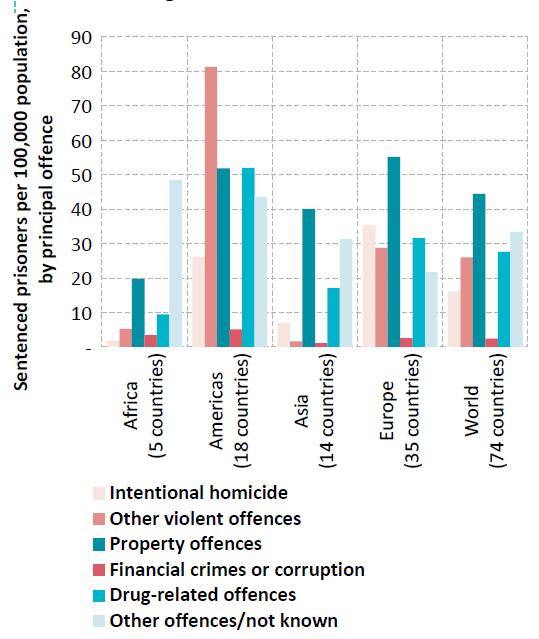
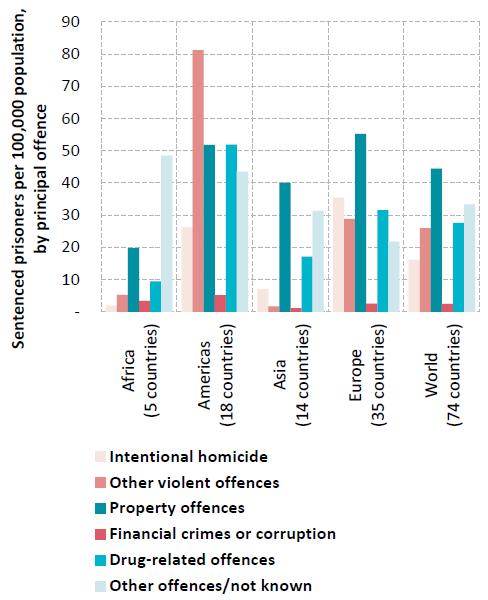
Almost one in five sentenced prisoners is serving time for a drug offence
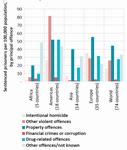
Click to enlargeSource: Note by the Secretariat on world crime trends and emerging issues and responses in the field of crime prevention and criminal justice (E/CN.15/2016/10).
Yet drug trafficking and production do not necessarily produce violence, as illustrated by the low levels of homicide in transit countries affected by the opiate trafficking routes in Asia. Characteristics of the market and drug trafficking organizations may explain variations: market competition can generate violence in illicit markets, while differences in the internal structure of trafficking networks, which may be characterized by varying degrees of cohe-siveness and hierarchy, can also play a role.
The profits associated with the drug trade are a key motivation for non-State armed groups, including terrorist organizations, to engage in or facilitate drug trafficking. In a number of countries, resources generated in illicit markets such as drug markets have played a role in complicating and extending armed conflicts, often increasing their overall lethality. In general, the drug trade flourishes where State presence is weak, where the rule of law is unevenly applied and where opportunities for corruption exist. At the same time, the wealth and power of drug trafficking organizations provide them with resources to buy protection from law enforcement agents, from politicians and the business sector, thereby reinforcing corruption.
Profit is generated across the entire chain of drug production and distribution, but it is at the final stage that it tends to be highest. A recent UNODC study estimated that almost half of the profit made along the major heroin trafficking route from Afghanistan to Europe was generated in the four largest European consumer markets: France, Germany, Italy and the United Kingdom. Nevertheless, the size of the illicit economy associated with drugs, relative to the licit economy, tends to be higher in drug-producing countries, partly because of their relatively smaller economies. This is particularly pronounced in the case of Afghanistan, where, according to UNODC estimates, the total value of the illicit opiate economy was $2.8 billion in 2014 — equivalent to 13 per cent of the country's gross domestic product (GDP). The laundering of such illegal proceeds occurs through many different channels, from small, decentralized techniques such as the use of money orders or remittances, to sophisticated uses of front businesses. These forms of illicit financial flows are essential for the survival of criminal groups and constitute a major threat to sustainable development.
Partnership
Sustainable Development Goal 17. Strengthen the means of implementation and revitalize the global partnership for sustainable development Sustainable Development Goal 17 has a strong link with the principles of international cooperation and shared responsibility, embedded in the drug control conventions.
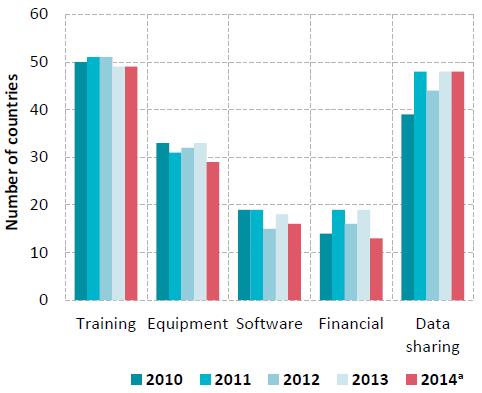
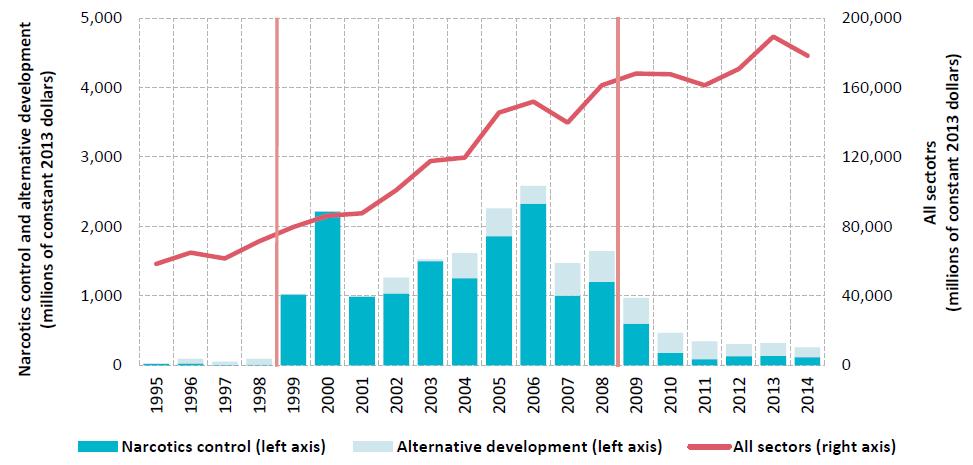
But when analysed together, donor development assistance and donor assistance in drug-related sectors show opposing trends: official development assistance has increased overall, whereas assistance in drug-related sectors has actually decreased significantly since 2008.
How do drug interventions impact sustainable development?
Drug supply and demand reduction efforts
Efforts to eliminate illicit crop cultivation can impact the income source and employment opportunities of farmers and farm labourers. Research has also shown that such efforts have positive development outcomes in the affected communities only if they include development measures to ensure alternative livelihoods and restore security and rule of law. Examples in Colombia and Peru have shown that effective alternative development programmes can weaken the population's ties with armed groups and drug trafficking.
Law enforcement interventions aim to restore the rule of law, the cornerstone of governance and sustainable development, and can also influence the availability of drugs in illicit markets, not only by reducing supply through interdiction but also by increasing the risk for traffickers, which raises the price of drugs in consumer markets. However, enforcement activities by authorities can also generate violence, particularly when they affect the internal and external structure of illegal markets. Research suggests that targeting enforcement and policing on both the protagonists and the elements in the drug trafficking chain that generate the greatest profit and the most violence can be particularly effective in reducing violence. On the other hand, strategies that focus on rapidly disrupting drug trafficking organizations and reducing violence in the short term can sometimes lead to more violence.
Prevention, early intervention treatment, care, recovery, rehabilitation and social integration measures, and the entire continuum of care for people who use drugs, when based on scientific evidence, reduce drug use and thus its impact on public health, which is one of the most important components of the well-being of society. Some of the above measures have also been shown to decrease a range of other risky behaviours such as aggressiveness and truancy. The benefits affect both people who use drugs themselves and society in general, and such efforts have proved effective in preventing, for example, HIV and viral hepatitis.
Drug demand reduction interventions are effective when they rely on evidence-based measures, including those aimed at minimizing the adverse public health and social consequences of drug use, such as appropriate needle and syringe programmes, opiate substitution therapy, antiret-roviral therapy and other relevant interventions that prevent the transmission of HIV, viral hepatitis and other blood-borne diseases associated with drug use. Compulsory confinement in drug treatment centres, on the other hand, often worsens the already problematic lives of people who use drugs and people with drug dependence, particularly the youngest and most vulnerable.
Criminal justice systems and the costs of drug policies
As in the case of law enforcement operations in general, when operations are implemented by impartial, transparent and efficient institutions in compliance with human rights standards, they promote the rule of law and equal justice. But when law enforcement operations go against those principles, incentives may be created for indiscriminate repression and for the violation of citizen rights.
On the basis of limited available data, globally more than three quarters of all those held in prison for drug-related offences have been convicted for drug trafficking and less than a quarter for offences related to personal consumption. There are differences across jurisdictions in terms of definitions, prosecutorial discretion or types and severity of sanctions for drug offences. In some regions, countries exercise more punitive approaches, which may result in incarceration, when dealing with people apprehended for minor drug offences, such as possession of small quantities of drugs for personal consumption. On the other hand, several countries have chosen to limit punishment by adopting alternative measures to incarceration or punishment in minor personal consumption cases without aggravating circumstances (for example, fines, warnings, probation or counselling). The excessive use of imprisonment for drug-related offences of a minor nature is ineffective in reducing recidivism and overburdens criminal justice systems, preventing them from efficiently coping with more serious crime. The provision of evidence-based treatment and care services to drug-using offenders, as an alternative to incarceration, has been shown to substantially increase recovery and reduce recidivism.
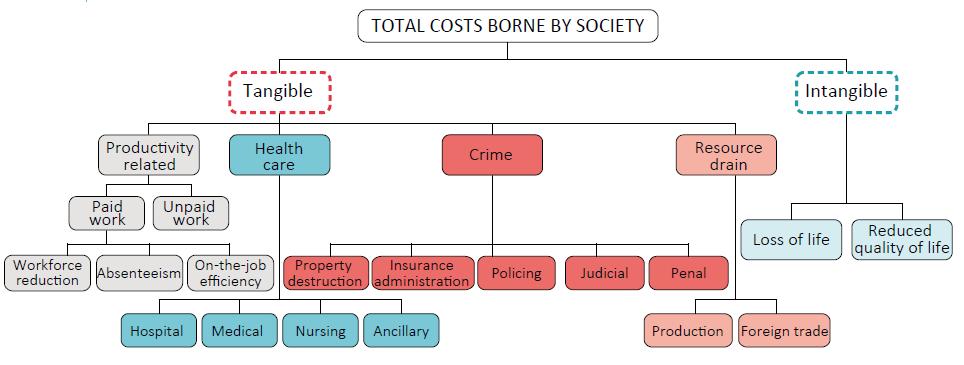
Cost of drug policies
Many of the costs arising both directly and indirectly from the drug problem can be quantified in monetary terms. Several economic studies have done so, and their results show that the cost ranged between 0.07 and 1.7 per cent of GDP of the countries studied. Moreover, the majority of countries studied registered a high percentage of overall costs attributable to drug demand and supply reduction interventions (such as prevention, treatment and law enforcement), as opposed to productivity losses and any other indirect costs. It is important to bear in mind that, although those economic studies generally take into account a wide variety of costs, which arise directly and indirectly out of the drug problem, this is usually limited to costs that can be quantified in monetary terms. The non-tangible costs, such as loss of life and impaired quality of life, are frequently not quantified, and when quantified it is usually with reference to a non-monetary metric, such as years of life lost or years lived with a disability. While such studies can be very useful in assessing the economic toll taken on society because of drugs, other considerations also need to come into play when assessing the impact of the world drug problem and in devising policy responses.
Impact of development on the world drug problem
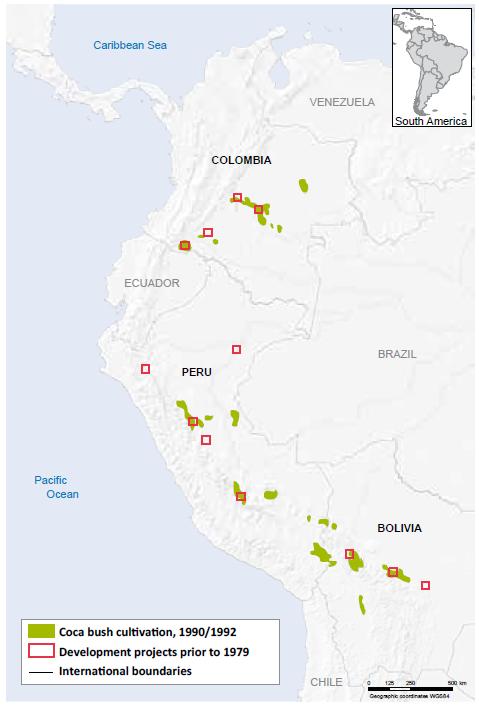
Development can reduce the vulnerability of farmers to engaging in illicit cultivation and production and can bring sustainable reduction in drug cultivation. However, if development interventions are not sensitive to the vulnerabilities of communities to specific drug issues, they may inadvertently trigger dynamics that increase illicit cultivation, as shown by the example of large development programmes in the early 1960s and 1970s in the Andean region.
Initiatives that facilitate trade and ease trade barriers are employed to promote economic development, but globalization may also have ramifications for drug trafficking. By fostering the expansion of trade and global transportation networks, trade openness can also facilitate the cooperation and the formation of alliances among criminal organizations across different countries and, in some cases, reduce the opportunity for law enforcement agencies to monitor international trade.
The geographical spread of the use of certain drugs, such as cocaine and synthetic drugs, is less concentrated today than it was in the past, while Europe, North America and Oceania are increasingly affected by the consumption of NPS. At the same time, rapid economic growth is taking place in large parts of the world where certain drugs are still virtually unknown. It is therefore crucial to bear in mind the potential ramifications of development on drug use, and the experience of developed countries can be enlightening in this regard.
CONCLUSIONS AND POLICY IMPLICATIONS
Development and countering the world drug problem need to work in symbiosis
Many drug policy interventions directly or indirectly result in an improvement in the level of development of their target populations, while operations designed to improve sustainable development often address the vulnerability of people or communities affected by the drug problem and can ultimately help address it. However, as drug and development policies can have an inadvertently counter-productive effect on each other, the two streams of intervention — development and countering the world drug problem — need to work in symbiosis.
In order to be sustainable development-sensitive, efforts to address the world drug problem need:
— To be in line with the requirements of the international human rights instruments.
— To be gender-sensitive, so as to consider the special needs of women and their greater level of stigmatization when designing prevention programmes, treatment interventions for drug dependence, as well as the criminal justice response to drug-related offences.
— To be environmentally friendly, so as to ensure that the curtailment of the illicit supply chain for drugs does not cause deforestation or other environmental damage.
— To ensure that "no one is left behind", by, for example, considering the special needs of men who have sex with men when targeting the spread of infectious diseases among PWID, and the special needs of migrants, including international as well as internal migrants, who can be particularly vulnerable to drug use.
— To overcome the stigmatization of drug users, as this can lead to further marginalization.
— To be based on scientific evidence, so that drug policies can address the core aspects of social development and public health.
At the same time, development interventions should take into account the complex interconnectedness of development and the world drug problem, as well as the potential risks associated with social and economic change. In particular, while continuing to address lack of development in general, policymakers should factor in the specific needs and vulnerabilities of communities affected, so that development efforts do not inadvertently open up space to drug markets.
Success depends on a dual track of development intitiatives.
As the targeting of specific communities affected by the drug problem with a broad sweep of general development strategies may be ineffective, a dual track is needed: maintaining specialized drug interventions in synergy with general developmental investments. This approach has already been embraced in the concept of alternative development and can be expanded to other aspects of the drug problem. Specific drug-related development initiatives need to be mainstreamed into general development initiatives. This can include prevention programmes built into the educational, social welfare and health systems; the strengthening of treatment for drug use and of the provision of care and rehabilitation and reintegration services in the health-care and social welfare systems; training and capacity-building in law enforcement agencies; and raising awareness of the complexity of the drug problem, including the promotion of non-stigmatizing approaches, across all relevant State institutions.
Promotion of an effective human rights-based criminal justice response to the drug problem
Governance and the rule of law represent a crucial area in which the links between the drug problem and development have not been sufficiently recognized. Guaranteeing the rule of law needs to be viewed as a concept wider than mere coercion; it also encompasses inclusive access to justice delivered fairly, in full respect of human rights, through a robust system that places authority in the hands of relevant institutions, with appropriate safeguards.
The first option for people with drug use disorders who are brought into contact with the criminal justice system for minor offences should be an alternative to incarceration. Approaches to tackling minor offences related to drug use disorders through treatment and care as an alternative to imprisonment require effective coordination between the health and justice systems. A set of basic principles to promote the use of non-custodial measures, as well as legal safeguards for persons subject to alternatives to imprisonment, are set forth in the United Nations Standard Minimum Rules for Non-custodial Measures (the Tokyo Rules) and in the United Nations Rules for the Treatment of Women Prisoners and Non-custodial Measures for Women Offenders (the Bangkok Rules).
The right to security also needs to be respected in the implementation of effective drug-control measures. This right requires that State authorities act in compliance with the rule of law and international norms and standards concerning, inter alia, the use of force, the protection of victims and the treatment of offenders. The right to security also implies safety from crime and violence and a corresponding duty of State authorities to prevent and suppress drug trafficking and other related organized-criminal activities that specifically threaten individual citizens.
The dynamics between violence and drug trafficking need to be understood better
The relationship between violence and the production or trafficking of drugs is complex. Violence is not a foregone conclusion of drug trafficking. Factors that determine vio-lence include the level of competition between drug trafficking organizations and how they operate, the sociopolitical conditions of a particular location, levels of corruption and the strength of the underlying rule of law. To avoid the escalation of violence, interventions to elimi-nate drug trafficking have to be sensitive to the circumstances.
Most health consequences of drug use are preventable
Drug use continues to produce negative health consequences, particularly in relation to injecting drug use and drug use disorders. Many of those consequences are preventable and can be avoided through the provision of services such as needle and syringe programmes, overdose prevention, opiate substitution therapy and other evidence-based drug dependence treatment that scientific evidence has proved to be effective. Drug overdose is preventable if substances such as naloxone (a drug that can immediately reverse the effects of opioid overdose) are widely available to people who use opioids.
Drug use and its health consequences should be prevented and treated in prisons
The human rights of people in prisons and other closed settings must continue to be ensured while they are in detention, including their right to health services, particularly for drug dependence treatment and for the prevention and treatment of HIV, hepatitis and tuberculosis. A higher risk of death for people with drug use disorders after release from prison points to the need for appropriate interventions such as prison-based opioid substitution therapy, pre-release education on overdose prevention, the availability of naloxone on release from prison, and post-release follow-up.
Heroin still requires the attention of the international community
Drug markets have seen great diversification in the past few years, with the emergence of new substances, new combinations of polydrug use and new injecting behaviours involving stimulants carrying higher risks of infectious diseases. Attention to recent trends should not, however, overshadow the importance of continuing to focus on trends related to a "traditional" drug such as heroin. The resurgence in heroin use, leading to fatal consequences, has been documented in a few countries where it was previously in decline, demonstrating that heroin is not a problem unique to the older generation and that it still needs to be prioritized by the international community. The recent sharp decline in opiate production in Afghanistan should not be overestimated as both the vulnerability, and opportunity, of farmers to cultivating opium poppy have not drastically changed.
Worrying developments in the amphetamine market in the Middle East require closer monitoring
The recent data emerging from the Near and Middle East on "Captagon" (increased seizures, local manufacture and the availability of precursors) show worrying signals for a subregion where drug manufacturing and trafficking have the potential to exacerbate a challenging situation of porous borders, violent conflict, insurgency and limited government control in certain areas. In the past, other regions affected by similar vulnerabilities experienced the development of a drug-violence nexus in which drug manufacture/trafficking and conflict become mutually reinforcing elements. More information, particularly on drug use, is needed in the Near and Middle East to help understand if and how the observed increase in seizures indicates greater drug consumption in the subregion and what the potential implications for drug policy may be.
Greater efforts needed to enhance forensic capacity and monitoring systems for new psychoactive substances
Information on the use of NPS and their health consequences remains limited. Understanding the NPS problem in order to address it more effectively requires efforts on different fronts: supporting countries to improve their forensic capacity relating to NPS detection and to develop or improve monitoring systems that can effectively collect information on the use of NPS and their health consequences. More research is needed to understand the effects on and the risks to users who consume such products, and how to communicate those risks. Also key is understanding the wide range of national legislative responses that have been put in place by Member States in different regions to address the dynamics of the NPS market.
Increased provision of science-based prevention and treatment programmes for cannabis use is needed
Cannabis has been gaining a higher level of visibility at a health-care policy level, in international research and as a result of recent changes in legalization in some parts of the world. An analysis of the numbers in treatment for can-nabis use in the United States and Europe shows an increase over the long term. In Europe, the consistent increase observed in the numbers of people entering treatment for cannabis use is a reflection, in part, of the expansion in the provision of treatment programmes to address the needs of cannabis users, including several programmes targeted at adolescents and young adults. It is important that science-based prevention programmes are available for adolescents and young people so as to prevent the early initiation of cannabis use, and that treatment interventions such as Screen and Brief Intervention (SBI) are available for people who already use cannabis, so as to prevent progression into drug use disorders.
Continual monitoring of new cannabis policies is recommended
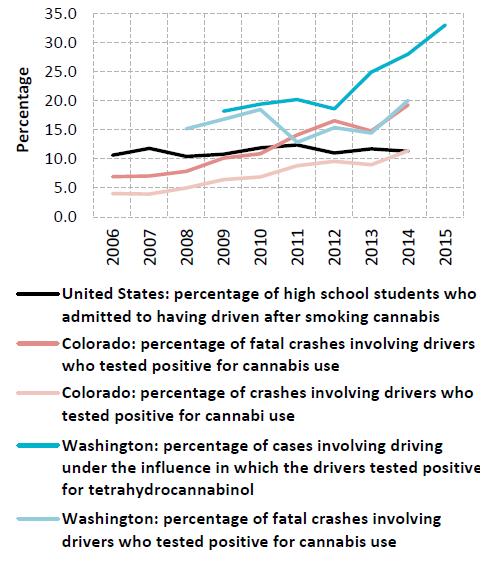
Although it is still too early to evaluate the impact of new cannabis policies, the evidence collected to date in the United States points to an increase in cannabis use in states where referendums have led to the legalization of recreational marijuana use. New challenges have emerged in some states of the United States (notably Colorado), including the marketing of unregulated cannabis products (edibles) with a high content of tetrahydrocannabinol (THC). Moreover, there is evidence of an increasing number of cannabis users driving under the influence, as well as an increase in cannabis-related emergency room visits and hospitalizations. However, cannabis-related arrests and court cases related to cannabis offences have decreased. All of these outcome measures would need to be rigorously monitored and evaluated over a period of time before a final assessment can be made.
Treatment and care: greater focus on polydrug use is a necessity
Polydrug use and the increased complexity of shifts between the use of different drug types pose challenges to people responding to emergencies related to drug use, as well as to those treating drug use disorders. In such instances polydrug use can compromise treatment efforts that are drug specific. Pharmacologically assisted treatment of disorders related to opioid use has proved effective, whereas for other drugs such as stimulants and cannabis, the treatment interventions available are mostly psychosocial and behavioural. This situation requires policymakers and practitioners to be more aware of emerging trends in drug use and to have mechanisms in place to detect and diagnose a wider range of substances used. Furthermore, there is a need to develop guidelines that are science-based for pharmacologically assisted treatment and behavioural therapies for treating people suffering from drug use disorders as a result of multiple drug use.
Legislation, technical assistance and capacity building are key for dealing with the growing importance of the "dark net"
Law enforcement and the criminal justice system in many countries are still not in a position to deal effectively with the anonymous online marketplace known as the "dark net". Apart from practical problems, there are a number of other difficult legal issues that need to be addressed, including: the identification of the responsible jurisdiction, combined with the routine international sharing of information, especially when the physical location of sellers and buyers is unknown; the use of undercover agents (both online and offline) to infiltrate such networks in order to gather evidence and undermine the criminal business model; and the development and implementation of legislation to require suspects to reveal passwords/decryption information when charged with an offence. The provision of technical assistance and capacity-building for Member States to collect and exploit digital evidence is key to addressing the threat posed by drug trafficking via the Internet.
CHAPTER 1
ILLICIT DRUG MARKETS: SITUATION AND TRENDS
Overall drug use remains stable globally
It is estimated that 1 in 20 adults, or a quarter of a billion people aged 15-64 years, used at least one drug in 2014. Although trends in drug use vary across regions, as does updated reporting on data, the extent of drug use among the world population has remained stable over the past four years. Almost 12 per cent of the total number of people who use drugs, or over 29 million people, are estimated to suffer from drug use disorders.
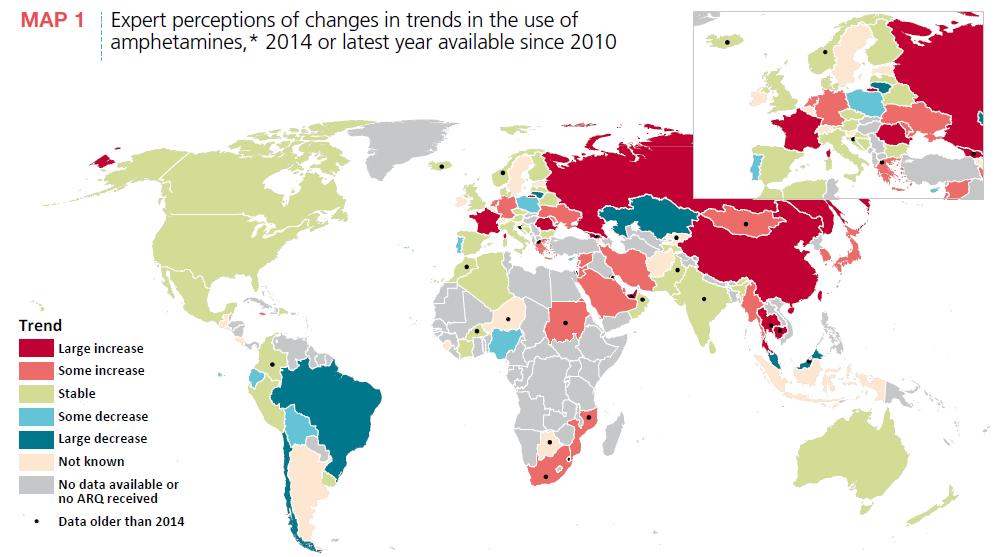
Cannabis remains the world's most widely used drug, with an estimated 183 million people having used the drug in 2014, and amphetamines remain the second most widely used drug. With an estimated 33 million users, the use of opiates and prescription opioids may not be as widespread as the use of cannabis, but opioids remain major drugs of potential harm and health consequences. Where updated data are available, as an overall trend, global use of cannabis has remained stable over the past three years, although in some subregions, particularly North America and Western and Central Europe, cannabis use has increased. In the absence of recent survey data on drug use in Africa, experts in the region also perceive an increase in cannabis use. Moreover, the global trend in cocaine use, which was stable after 2010, has shown a recent trend, mainly as a result of an increase in cocaine use in South America. The global trend in the use of amphetamines is stable, although this may underplay the situation in regions where recent information on the extent of drug use is unavailable. This is particularly the case in Asia, where expert perceptions of trends and treatment admission reports suggest an increase in the use of amphetamines in the region, specifically in East and South-East Asia (see map 1).
The global picture of drug use is compounded by the fact that many people who use drugs, both occasionally and regularly, tend to be polydrug users, |1| |2| meaning that they use more than one substance concurrently or sequentially, usually with the intention of enhancing, potentiating or counteracting the effects of another drug. |3| The non-medical use of prescription drugs, synthetic stimulants and new psychoactive substances (NPS) in lieu of, or in combination with, conventional drugs gives a picture that blurs the distinction between users of a particular drug, presenting an interlinked or cyclical epidemic of drug use and related health consequences in recent years. Additionally, such a pattern of drug use presents challenges to health professionals responding to emergencies related to drug use, as well as to those treating people with disorders related to the use of multiple drugs.
FIG. 1 Global trends in the estimated prevalence of drug use, 2006-2014
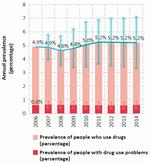
Click to enlargeSource: Responses to the annual report questionnaire.
Note: Estimated percentage of adults (ages 15-64) who used drugs in the past year.FIG. 2 Global trends in the estimated number of people who use drugs, 2006-2014
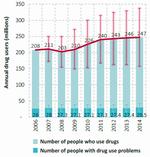
Click to enlargeSource: Responses to the annual report questionnaire.
Note: Estimates are for adults (ages 15-64), based on past-year use.
Estimates of the extent of drug use and problem drug use reflect the best information available in 2014 As in previous years, global estimates of the extent of drug use and problem drug use reflect the best available information in 2014, and changes compared with previous years largely reflect information updated by 20 countries, mostly in North America, South America and Western and Central Europe, for which new data on the extent of drug use or problem drug use were made available in 2014. The concept of problem drug use has been used in prior editions of the World Drug Report as a proxy for estimating the number of people with drug use disorders. In 2014, the estimated number of problem drug users increased by 2 million over the previous year, which reflects an increase in the estimated number of opiate users in North America and Western and Central Europe, as well as in the total number of users of cocaine, amphetamines and "ecstasy".
Recent trends in polydrug use and substitution between drugs
Polydrug use encompasses wide variations in patterns of drug use, ranging from occasional alcohol and cannabis use to the daily use of a combination of heroin, cocaine, alcohol and benzodiazepines. |4| |5|
Within polydrug use, the concomitant use of opiates and stimulants such as cocaine and amphetamines is fairly common and has been widely reported. |6| |7| In the past decade, the use of amphetamine and methamphetamine has become quite widespread in different regions, while the number of NPS that are stimulants seems to be constantly increasing. Data on polydrug use are seldom systematically collected, but amphetamines and NPS seem to be reported increasingly in polydrug use patterns in different regions.
Tolerance, cross-tolerance and substitution: managing the effects of drugs
The interplay of individual, biological, cultural, social and environmental factors increases or attenuates the vulnerability of a person to use or to continue using drugs. Continuing to use a drug is considered a conditioned response to the positive reinforcement that the person receives as a result of using the drug. |8| However, in later stages a person continues to use drugs merely to maintain drug dependence, which is characterized by, among other things, the desire and compulsion to use drugs despite evidence of harmful consequences, the development of tolerance — by increasing the quantity of the drug or drugs to achieve the same effects and a state of withdrawal — and the negative consequences experienced when the person stops using the drug or drugs. |9|
Drugs taken together can have a cumulative or synergistic effect, which increases the overall psychoactive experience; that is one way in which drug users may address the development of tolerance. |10| A related phenomenon is "cross-tolerance" — the pharmacological ability of one drug to have generally the same effect on the nervous system as another drug. The phenomenon of cross-tolerance explains in part the frequent substitution of drugs that have a similar effect. Examples of such patterns of drug use include the use of alcohol with benzodiazepines, cannabis or cocaine; concurrent use of heroin, benzodiazepines and antihistamines; the use of alcohol or other opioids (methadone, fentanyl etc.); and the use of cocaine and other stimulants. |11| |12| |13| |14|
In other situations, people who use drugs may offset the negative effects of the drugs by concurrently or sequentially using additional drugs with opposite effects. One such pattern is "speedballing" — when cocaine is injected with heroin or other opioids or when heroin is used with methamphetamine or amphetamine. |15|
Market dynamics: substitution and complementarity of drugs
Market dynamics, reflected by changes in availability, purity or price, can affect the choice of drugs. In such circumstances, people who use drugs can turn to substituting with different drugs; transitioning to alternative routes of drug administration; decreasing their consumption of the drug; or deciding to enter treatment. |16| |17| Common examples are heroin being substituted by oxycodone, desomorphine or other opioids and vice versa, as reported in various regions. |18|
MAP 1 Expert perceptions of changes in trends in the use of amphetamines,* 2014 or latest year available since 2010
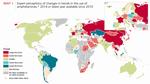
Click to enlargeSource: Responses to the annual report questionnaire.
Note: The information presented in the map is for 2014 or the latest year since 2010 for which the information is available. The boundaries and names shown and the designations used on this map do not imply official endorsement or acceptance by the United Nations. Dashed lines represent undetermined boundaries. The dotted line represents approximately the Line of Control in Jammu and Kashmir agreed upon by India and Pakistan. The final status of Jammu and Kashmir has not yet been agreed upon by the parties. The final boundary between the Sudan and South Sudan has not yet been determined. A dispute exists between the Governments of Argentina and the United Kingdom of Great Britain and Northern Ireland concerning sovereignty over the Falkland Islands (Malvinas).
* Includes both amphetamine and methamphetamine.Economic factors and cross-price elasticity may also affect polydrug use. |19| An increase in the price of one drug may result in the use of another (substitution) or it may decrease the use of another, even though its price remains the same (complementarity). For example, a study showed that an increase in the price of heroin resulted in an increase in benzodiazepine and cocaine purchases. |20| In another study, cross-price elasticity analysis showed that in the case of heroin there was significant substitution with prescription opioids and, to a lesser extent, benzodiazepines and methamphetamine. |21| The same study showed that there was limited substitution with other drugs as the price of meth-amphetamine increased.
Recent trends in the use of heroin and the non-medical use of prescription opioids in the United States
Fig. 3 Trends in the use of heroin and prescription opioids in the United States, 2002-2014
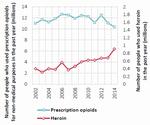
Click to enlargeSource: Wilson M. Compton, Christopher M. Jones and Grant T. Baldwin, "Relationship between nonmedical prescription-opioid use and heroin use", New England Journal of Medicine, vol. 374, No. 2 (2016), pp. 154-163.
Fig. 4 Age-adjusted rates of death related to prescription opioids and heroin in the United States, 2000-2014
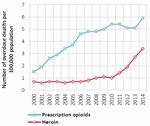
Click to enlargeSource: Wilson M. Compton, Christopher M. Jones and Grant T. B rs in, "Relationship between nonmedical prescription-opioid use end heroin use", New England Journal of Medicine, vol. 374, No. 2 (2016), pp. 154-163.
In the United States of America, over the past decade the non-medical use of prescription opioids and the use of heroin have continued to interplay in the market. Since the high prevalence and associated morbidity and mortality of the non-medical use of prescription opioids have become a major public health issue, |22| a recent increase in heroin use has triggered a sharp increase in heroin-related overdose deaths. |23| |24| Several aspects have driven this change: law enforcement and regulatory actions to address the irrational prescribing and reformulation of prescription opioids with abuse-deterrent technologies; implementation of programmes for monitoring prescription drugs and education of health-care professionals and the public about their appropriate use; |25| and increased accessibility, reduced prices and high purity of heroin in the United States. |26|
In 2014, an estimated 914,000 people aged 12 years or older had used heroin in the past year — a 145 per cent increase since 2007 — while mortality related to heroin use has increased fivefold since 2000. |27| |28| |29| |30|
FIG. 5 Trends in polydrug use among heroin users in the United States, 2002-2013
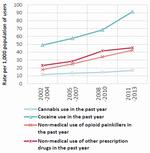
Click to enlargeSource: Christopher M. Jones and others, "Vital signs: demographic and substence use trends among heroin users - United States, 2002-2013, Morbidity and Mortality Weekly Report, vol. 64, No. 26 (2 015).
FIG. 6 Likelihood of past-year heroin use and other indicators depending on the frequency of non-medical use of prescription opioids in the past year
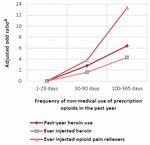
Click to enlargeSource: Christopher M. Jones and others, "Vital signs: demographic and substance use trends among heroin users - United States, 2002-2013", Morbidity and Mortality Weekly Report, vol. 64, No. 26 (2015).
a Odds ratio adjusted for the influence of (confounders) other variables.From the period 2002-2004 to the period 2011-2013, there was an increase in heroin use, particularly among people who also reported the use of other substances. The highest rate of past-year heroin use was among cocaine users (91.5 per 1,000 users), |31| followed by those who reported non-medical use of prescription opioids. Nine out of 10 people who used heroin self-reported co-use of heroin with at least one other drug, and most used heroin with at least three other drugs. |32| Moreover, the proportion of heroin users diagnosed with disorders related to non-medical use of prescription opioids more than doubled, from 20.7 per cent in the period 2002-2004 to 45.2 per cent in the period 2011-2013.
The increase in heroin use in the United States has been more pronounced among a subgroup of people aged 18-25 who report a higher frequency of non-medical use of prescription opioids. |33| Among this group, the likelihood of using heroin in the past year, ever injecting prescription opioids or becoming dependent on heroin increased with the frequency of non-medical use of prescription opioids in the previous year. Those reporting non-medical use of prescription opioids for over 100 days in the past year were nearly eight times more likely to report dependence on heroin than those who reported less frequent non-medical use of prescription opioids.
It appears that the increase in heroin use in the United States had already begun around 2006 and had preceded the changes introduced in policies and practices related to prescription opioids. Nevertheless, given the large number of non-medical users of prescription opioids, even a small proportion who switch to heroin use has translated into a much higher number of people using heroin.
Analysis suggests that the problem of opioid use is not substance-specific and requires holistic approaches to address the interconnected epidemic through prevention of initiation and treatment interventions for people with opioid use disorder. |34|
Shift between injecting heroin, amphetamines and new psychoactive substances in Europe
In some European countries (Austria, Belgium, Czech Republic, France, Germany, Ireland, Poland, Spain and the United Kingdom), small, localized groups of high-risk drug users who are in contact with low-threshold services, psychiatric facilities and treatment centres for drug users and who used to inject heroin and amphetamines have switched to injecting NPS such as synthetic cathinones. Reports to the European Monitoring Centre for Drugs and Drug Addiction (EMCDDA) suggest that drug users who inject synthetic cathinones are primarily those who have been injecting heroin and amphetamines and have now either started injecting synthetic cathinones or included it in their drug use repertoire. |35| People who inject synthetic cathinones include those who are on opioid substitution treatment, as well as young people beginning their drug-injecting use.
FIG. 7 Trends in injecting drugs among clients of needle and syringe programmes in Hungary, 2009-2012
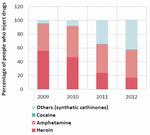
Click to enlargeSource: Anna Peterfi and others, "Changes in patterns of injecting drug use in Hungary: a shift to synthetic cathinones", Drug Test and Analysis, vol. 6, Nos. 7 and 8 (2014), pp. 825-831.
In Hungary, in the period 2009-2012 a shortage of heroin and an increase in local availability of synthetic cathinones contributed to high-risk drug users switching to injecting NPS, primarily synthetic cathinones. A corresponding change in the patterns of injecting was reported both among clients of needle and syringe programmes (NSP) and those entering treatment. In 2009, the majority of people who inject drugs (PWID) were injecting heroin or amphetamine, whereas by 2012 about 43 per cent of PWID were primarily injecting synthetic cathinones and another 40 per cent were injecting amphetamine. |36| This trend was self-reported, as well as confirmed through samples obtained from injecting equipment. Of the main synthetic cathinones injected by PWID, the predominant substance was pentedrone; the other substances reported were 3,4-methylenedioxypyrovalerone (MDPV), mephe-drone and 4-methylethcathinone (4-MEC), all of which are stimulants.
There is evidence of similar trends in treatment settings, where the proportion of heroin users dropped considerably and the proportion of clients entering treatment for injecting amphetamine and other stimulants increased substantially in 2012.
In Hungary, the reduced availability of heroin did not change injecting practices but made users switch to other injecting substances (such as NPS and amphetamine) that were more affordable and readily available and also gave intense effects. |37|
Drug market changes and patterns of injecting drug use in Australia
In Australia, the heroin market changed considerably after 2000; heroin went from being highly accessible (cheap, high in purity and available) and the most commonly injected drug in Australia to being less accessible as a result of a heroin shortage. |38| The change resulted in a decrease in the prevalence and frequency of injecting heroin, as well as a decline in adverse health consequences related to heroin use. |39|
FIG. 8 Trends in the initiation of injecting drug use, by substance, in Melbourne, Australia, 2001, 2001-2004 and since 2004
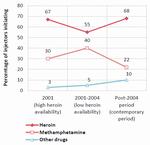
Click to enlargeSource: Danielle Horyniak and others, "How do drug market changes affect characteristics of injecting initiation and subsequent patterns of drug use? Findings from a cohort of regular heroin and methamphetamine injectors in Melbourne, Australia", International Journal of Drug Policy, vol. 26, No. 1 (2015), pp. 43-50.
The subsequent years (2001-2004) saw a sustained decrease in the availability and use of heroin in Australia. During the same period, methamphetamine emerged on the market at a relatively low price per gram of pure methamphetamine, which was readily available, and that led to an increase in methamphetamine use. |40| In the years from 2004 onwards, the illicit markets for both heroin and methamphetamine continued to be very dynamic, with the price and purity of both drugs fluctuating. In the same period, the increased practice of prescribing opioids and their non-medical use (among PWID) was also observed. |41|
A cohort study of PWID in Melbourne, who were recruited between November 2008 and March 2010, examined the impact that the changing market dynamics might have had on drug use patterns. |42| Among the participants in the study, initiation with injecting heroin remained the most common practice in all three of the periods examined, although it declined in the period when heroin availability was low. In that period, the proportion of PWID who initiated injecting methamphetamine increased. In the later period (from 2004 onwards), the proportion of PWID initiating injecting with methamphetamine decreased, counterbalancing an increase in initiating injecting with heroin and other drugs, primarily prescription opioids.
In 2013, most of the participants in the study were polydrug users (44 per cent) or users primarily injecting heroin (41 per cent). Among current PWID, the practice of primarily inject-ing methamphetamine was not common, but the participants who initiated injecting during the period when heroin availability was low were almost twice as likely to be current poly-drug injectors. Also, a combination of heroin and methamphetamine was more commonly used by current PWID, and drugs such as heroin were often used to counter the "comedown effects" of methamphetamine. |43|
The findings of the study suggest that the first drug injected reflects the characteristics of the drug market at the time, while later patterns of drug use, including polydrug use, appear to be the result of compensation or substitution mechanisms brought on by market dynamics. These patterns may reflect the cyclical nature of drug epidemics and may continue to change as drug markets evolve.
Methamphetamine smoking among heroin users and polydrug users in Greece
In recent years in Greece, both low-threshold services and treatment agencies have reported the smoking of crystalline methamphetamine on a regular basis among injecting opioid users. This practice has been reported particularly among marginalized migrant subpopulations of persons who inject opioids in Athens. |44|
Polydrug use in Greece is common among drug users in treatment. In 2013, almost 71 per cent of clients in treatment reported having used more than one substance, with polydrug use being more common among cocaine (80 per cent) and opioid users (77 per cent). Misuse of prescription drugs and use of cannabis and cocaine were most frequently reported among users of opioids, while primary cocaine users more frequently reported use of cannabis and opioids. |45|
Emerging methamphetamine use among opiate users in the Islamic Republic of Iran
In the Islamic Republic of Iran, where opiates remain the main drug consumed by problem drug users, methamphetamine use has emerged as another drug of concern in recent years. Methamphetamine use has also been described as a new form of polydrug use among opiate users. |46| Many local studies of opiate users in methadone treatment have reported the use of methamphetamine among the clients of treatment centres. For example, a study at an opioid substitution treatment clinic in Zahedan Province showed that methamphetamine use among opioid users in treatment increased from 6 per cent in 2009 to almost 20 per cent in 2011. |47| Another study of 378 people seeking treatment at a therapeutic community centre found that the urine samples of nearly 7 per cent of those people had tested positive for methamphetamine. |48| |49| Methamphetamine use has reportedly had a negative influence on opioid-dependent patients in treatment who wrongly believed that methamphetamine use could help control their opiate dependence and associated problems such as depression and poor sexual performance and increase their physical energy, attention and concentration and improve social relationships. |50| Methamphetamine use among heroin users has also been reported in other parts of Asia. |51|
Problem drug use as reflected in demand for treatment for drug use
Information about people in treatment for drug use disorders can be taken as a proxy for understanding the nature, as well as a latent indicator, of trends in drug use resulting in severe health consequences.
According to global estimates, nearly one in six people with drug use disorders access treatment services each year. Opioids stand out as a major drug of concern in North America, Europe (particularly Eastern and South-Eastern Europe) and Asia. In Eastern and South-Eastern Europe, nearly three out of every four people in treatment for drug use disorders are treated for opioid use. The number of people in treatment for cocaine use disorders remains quite high in Latin America and the Caribbean, where nearly half of people in treatment for drug use disorders are treated for cocaine use. Treatment related to cannabis use disorders is more prominent in Africa and Oceania than in other regions. This may be related to the limited treatment options for users of other drugs in Africa, where nearly half of all admissions to treatment for drug use disorders are for the use of non-specified substances, which masks the true extent of the use of drugs of concern other than cannabis. Amphetamines remain a problem primarily in East and South-East Asia and to some extent in North America; while the number of people in treatment for disorders related to the use of amphetamines has been increasing in Asia, half of the people in treatment for drug use in the region are treated for opioid use disorders.
The number and characteristics of people seeking treatment for the first time are indirect indicators of trends in health consequences caused by the use of different substances in a region. At the global level, the proportion of people seeking treatment for cannabis use disorders for the first time remains high — nearly 50 per cent. In Asia, among those being treated for disorders related to the use of amphetamines, nearly 60 per cent are reported to be in treatment for the first time; in Europe and Latin America, nearly 40 per cent of those being treated for cocaine use disorders are reported to be in treatment for the first time. People seeking treatment for disorders related to the use of cannabis and amphetamines are younger (on average, 24 and 25 years of age, respectively) than people seeking treatment for disorders related to the use of other drugs, including those seeking such treatment for the first time. This reflects increasing trends in the use of cannabis and amphetamines and the resulting increase in people seeking treatment for disorders related to the use of those drugs. Fewer people are in treatment for the first time for opioid or cocaine use disorders; however, they are typically in their thirties and, in many subregions, reflect an ageing cohort of users in treatment |52| and show an overall decrease in the proportion of treatment demand.
FIG. 9 Total number of people in treatment for drug use, including people in treatment for the first time, by drug type and region, 2014
Latin America and the Caribbean
(11 countries)North America
(3 countries)Western and Central Europe
(25 countries)Eastern and Soute-Eastern Europe
(6 countries)Asia
(22 countries)Africa
(6 countries)
Source: Responses to the annual report questionnaire.
Note: The figures are based on data for 2014 or the latest year since 2010 for which data are available. For each region, the number of people in treatment for the use of different drugs in the region is weighted by the total number of people treated in a country. Member States in Oceania (in particular, Australia and New Zealand) do not provide information on the proportion of people in treatment for the first time, and therefore information for Oceania is not reflected in the figures.Fig. 10 Primary drug used among people in drug treatment, by region, 2003, 2009 and 2014
Source: Responses to the annual report questionnaire.
Note: Data used for each point in time are based on reporting from countries in each region for the year cited or the latest year for which data are available.
Moreover, based on data reported by Member States, it is estimated that between 40 and 80 per cent of people in treatment for drug use are diagnosed with polydrug use, which reflects the complexity of drug use patterns and the challenges of treating people with drug use disorders effectively.
Trends in treatment demand over the past decade also corroborate the changing patterns of drug use observed in different regions and subregions. While demand for treatment for cannabis use disorders has increased in all regions since 2003, it has done so to a much greater extent in the Americas, Western and Central Europe and Oceania. At the same time, in the Americas, the proportion of people in treatment for cocaine use has decreased over the past decade. In Asia, there has been a substantial increase in treatment for the use of amphetamine-type stimulants (ATS) and a decrease in treatment for disorders related to opioid use. In Eastern and South-Eastern Europe, treatment for opioid use disorders has been a matter of concern over the past decade.
The increase in treatment demand related to cannabis use in some regions warrants special attention. |53| There is great variability in the definition and practice of what constitutes treatment of cannabis use disorders. Treatment at present consists of behavioural or psychosocial interventions that may vary from a one-time online contact, or a brief intervention in an outpatient setting, to a more comprehensive treatment plan including treatment of other co-morbidities in an outpatient or inpatient setting. |54|
What are the potential driving forces behind changes in the number of people in treatment for cannabis use?
The nature and extent of the potential health risks and harms associated with cannabis use are continually under debate. |55| Cannabis use can be perceived to be relatively harmless |56| |57| when compared with the use of other controlled psychoactive substances and also in relation to the use of tobacco or alcohol. However, lower risk does not mean no risk: there are harmful health effects associated with a higher frequency of cannabis use and initiation at a very young age, especially among adolescents during the time of their cognitive and emotional development. |58|
Adverse health effects of cannabis use associated with cognitive impairments or psychiatric symptoms are well documented in the scientific literature. |59| |60| |61| Hence, cannabis use disorders require clinically significant treatment interventions. The transition from drug use to drug dependence occurs for a much smaller proportion of cannabis users than for opioid, amphetamine or cocaine users. |62| However, because so many people use cannabis, this translates into a large number who experience cannabis use disorders; for example, in the United States, of the 22.2 million current cannabis users in 2014, 4.2 million people aged 12 or older had a cannabis use disorder diagnosed in the previous year. |63|
Cannabis use disorders are estimated to occur in approximately 1 out of every 11 persons (9 per cent) who have ever used cannabis, |64| and the proportion increases significantly to one out of every six persons (17 per cent) who started using cannabis in their teens |65| and to 25-50 per cent of daily cannabis users. |66| |67|
Factors that may influence the number of people in treatment when cannabis is the primary drug of concern |68| include: changes in the number of people who actually need treatment; changes in referrals to treatment; changes in awareness of potential problems associated with cannabis use; and changes in the availability of treatment for cannabis. Unfortunately, detailed information on trends in the number of people in treatment and on potential driving forces is sparse, and consequently the analysis pre-sented below is limited to the situation in the United States and in European countries.
Are changing patterns of treatment for cannabis use a result of more harmful consumption patterns?
The risk of adverse health effects increases with harmful patterns of cannabis use that include high-frequency (daily or near-daily) use, an earlier age of initiation and consumption of higher-potency cannabis.
FIG. 11 Number of daily (or near-daily) users of cannabis and number of people in treatment for cannabis use in the United States, 2002-2012
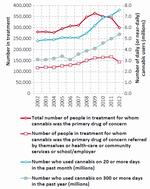
Click to enlargeSources: United States, Department of Health and Human Services, Substance Abuse and Mental Health Services Administration (SAMHSA), Results from the 2013 National Survey on Drug Use and Health: Summary of National Findings, NSDUH Series H-48, HHS Publication No. (SMA) 14-4863 (Rockville, Maryland, SAMHSA, 2014); United States, Department of Health and Human Services, SAMHSA, Center for Behavioral Health Statistics and Quality, Treatment Episode Data Set: Admissions (TEDS-A) -Concatenated, 1992 to 2012, ICPSR25221 (Ann Arbor, Michigan, Inter-university Consortium for Political and Social Research, 2015).
Note: The data presented in the figure are for people aged 12 years and older; persons in treatment are those for whom cannabis was the primary drug of concern.In the United States, the number of daily (or near-daily) cannabis users, measured by the number using cannabis on 20 or more days in the past month and the number using cannabis on 300 or more days in the past year, rose significantly after 2006, by 58 and 74 per cent, respectively. However, this increase in daily (or near-daily) cannabis use has not translated into an increased number of people seeking treatment, even when those in treatment referred by the criminal justice system are excluded.
FIG. 12 Number of people in treatment for cannabis use and the prevalence of past-month cannabis use in Germany, Spain and the United Kingdom, 2006-2013
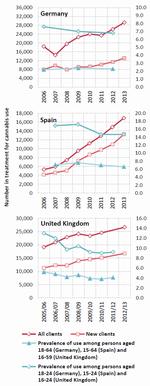
Click to enlargeSource: Responses to the annual report questionnaire; and EMCDDA, Statistical Bulletin, 2015.
Note: The data presented in the figures are for persons in treatment for whom cannabis was the primary drug of concern; for the United Kingdom, the treatment data refer to the second year in the range given and are for the whole country, but the prevalence rates refer to England and Wales only; for Spain, the prevalence rate given for 2007 refers to the years 2007/08.In Europe, where treatment for cannabis use disorders has been on the increase, approximately 1 per cent of the population aged 15-64 are daily (or near-daily) cannabis users; although data on daily use are sparse, there is little evidence that this rate has changed over the past decade. |69| In several countries in Europe with some of the highest numbers of people in treatment for cannabis use (Germany, Spain and the United Kingdom of Great Britain and Northern Ireland), the prevalence of past-month cannabis use has been stable or declining in the past decade, although the number of persons in treatment for cannabis use has risen continually.
One factor that could explain increased negative health effects of cannabis use could be decreasing age of initiation, but there is little evidence that cannabis users are now starting at an earlier age. The age of initiation of cannabis use reported by those in treatment has changed little over time in the United States and has followed no clear trend in Europe; therefore, it has probably not been an important factor influencing the trends observed in the number of persons in treatment. |70| |71|
Increases in the potency of cannabis products (the delta-9-tetrahydrocannabinol or tetrahydrocannabinol (THC) content), including in the ratio of THC to cannabidiol (a cannabinoid with anti-psychotic properties that may partially counterbalance the harm caused by THC), have received considerable attention in relation to possible increases in adverse health effects. There is evidence in some countries that there is now a large variety of cannabis products on the market and that high-potency preparations have become more widely available. |72| |73| Nevertheless, the interplay between high-potency cannabis products and dosage and how it translates into harm for users is not well understood. Users may adjust (titrate) the amounts of cannabis they consume to achieve the desired psychoactive effect, although this has been shown to be more difficult for inexperienced users |74| and users of high-potency cannabis. |75|
Are changing patterns of treatment for cannabis use a result of changes in referrals from the criminal justice system?
Several countries have adopted alternative measures to incarceration in minor cases involving possession of cannabis for personal consumption without aggravating circumstances (for example, fines, warnings, probation, counselling or even exemption from punishment). In the United States and the majority of countries in Europe, there is the option of referral or diversion away from criminal sanctions and into treatment. Thus, the criminal justice response to cases involving possession of cannabis for personal use can have an impact on the number of persons in treatment for cannabis use.
FIG. 13 Number of people in treatment for cannabis use and number of arrests for possession of cannabis in the United States, 1992-2012
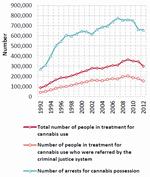
Click to enlargeSources: United States, Department of Health and Human Services, SAMHSA, Center- for Behavioral Health Statistics and Quality, Treatment Episode Data Set: Admissions (TEDS-A) - Concatenated, 1992 to 2012, ICPSR25221 (Ann Arbor, Michigan, Inter-university Consortium for Political and Social Research, 2015); United States, Executive Office of the President, National Drug Control Strategy: Data Supplement 2014 (Washington, D.C., 2014).
Note: The data on treament presented in the figure are for people aged 12 years and older for whom cannabis was the primary drug of concern.
In the United States, persons referred to treatment from the criminal justice system constitute a significant proportion (47-58 per cent in the period 1992-2012) of those in treatment for cannabis use. |76| However, over the same 20-year period, 40 per cent of those referred from the criminal justice system reported that they had not used cannabis in the month prior to entering treatment, and only 22 per cent reported daily use of cannabis. The number of arrests for cannabis possession follows a pattern that is for the most part similar to the number of people intreatment for cannabis, suggesting that changes in treatment for cannabis use in the United States are possibly a reflection of changes in arrests for cannabis possession.
In Europe, referrals from the criminal justice system (from the police, the courts and probation services) also make an important contribution to the number of persons in treatment as a result of their cannabis use. Typically, one in five persons who are in treatment and for whom cannabis was the primary drug of concern were referred from the criminal justice system, |77| with the proportion ranging from 3.9 per cent in the Netherlands to 80.6 per cent in Hungary. |78| Unfortunately, information is not available with regard to changes over time.
Have barriers and facilitators of access to treatment influenced the trend in treatment for cannabis use?
Given that persons who are dependent on cannabis are often reluctant to seek treatment, |79| an awareness and understanding, particularly among youth, of the potential harm associated with cannabis use may encourage users to seek help. In the United States there has been a continuous decline in the perception among youth that cannabis use is harmful. The proportion of secondary school students who see a "great risk" from regular cannabis use has declined since the early 1990s and there has been a particularly rapid decline since the mid-2000s. In 2014, less than 40 per cent of twelfth-grade students (ages 17-18) perceived a "great risk" from regular cannabis use, down from nearly 80 per cent in the early 1990s. |80| In Europe, the perception of harm from cannabis use is higher among youth than in the United States and has not shown a decline. According to European surveys conducted in 2003, 2007 and 2011, the percentage of students perceiving "great risk" of harm from regular cannabis use has been maintained at 70-72 per cent. |81| The greater perception of risk from cannabis use observed in Europe may have been a factor in the increasing numbers in treatment.
There could be considerable unmet demand for treatment for cannabis use in Europe. It is estimated that there are 3 million daily (or near-daily) cannabis users (persons who used cannabis 20 or more days in the previous month) in the region. |82| Based on a number of studies, cannabis dependence has been estimated to occur in 25-50 per cent of daily users. |83| |84| In Europe, a total number of approximately 206,000 persons received treatment in 2010 for which cannabis was either the primary or secondary reason for entering treatment, |85| suggesting that 10-30 per cent of all daily dependent cannabis users were receiving treatment.
At the health-care policy level and in international research, treatment for cannabis use has been receiving a relatively high level of visibility and public funding in Europe. |86| Since 2008, the number of persons in treatment for cannabis use has been increasing in Europe, which in part is a reflection of the expansion in the provision of treatment. |87| In many countries in Europe, important strides have been made in the provision of treatment with programmes that have been implemented, expanded or modified to address the needs of cannabis users, some having adolescents and young adults as their target groups. |88| |89|
Gender and drug use
Men are considered to be three times more likely than women to use cannabis, cocaine or amphetamines, whereas women are more likely than men to engage in the non-medical use of prescription opioids and tranquillizers. Gender disparities in drug use are more attributable to opportunities to use drugs in a social environment than to either gender being more or less susceptible or vulner-able to the use of drugs. |90| Men are considered to have more opportunities than women to use drugs, but both genders are equally likely to use drugs once an opportunity to do so occurs. |91| |92|
FIG. 14 Ratio of males to females among young people (ages 12-17) who use cocaine, prescription opioids and cannabis in the United States, 2002-2013
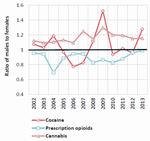
Click to enlargeSource: United States, SAMHSA, Center for Behavioral Health Statistics and Quality, Results from the 2013 National Survey on Drug Use and Health: Mental Health Detailed Tables (Rockville, Maryland, 2014).
Gender divide in drug use is narrowing among the younger generation
In most surveys, the prevalence of drug use is reportedly higher among young people than among adults and the gender divide in drug use is narrower among young people than among adults. |93| In Europe, for every two girls who use cannabis there are three boys, whereas the prevalence of cannabis use among adults is nearly twice as high among men than among women. |94| In the United States, the use of cannabis, cocaine and prescription opioids among young people (ages 12-17) was fluctuating over the past decade but overall the gender gap has remained similar.
Gender divide in drug use is changing
In recent years, in countries with established drug use, the gender divide in drug use has also been changing in the adult population, partly reflecting increasing opportunities to use a particular substance. In the United States, among the population aged 12 and older, heroin use remains higher among men than among women. However, over the past decade more women than men have started using heroin: the prevalence of past-year heroin use among women was 0.8 per cent in the period 2002-2004 and twice that figure (1.6 per cent) in the period 2011-2013, whereas the prevalence of past-year heroin use among men increased by half in the same period. The increase in heroin use was significantly higher among men and women who were younger (18-25 years old) and more frequent users of prescription opioids. |95|
In the United Kingdom, overall drug use in the adult population declined between 1996 and the period 2013-2014. However, this decline was more marked among women (-30 per cent) than men (-13 per cent). While the prevalence of amphetamine use declined by 75 per cent for both men and women, the decline in cannabis use was greater among women (-40 per cent) than among men (-20 per cent). |96|
Almost 12 million people inject drugs worldwide
FIG. 15 Estimated number and prevalence of people who inject drugs among the general population, by region, 2014
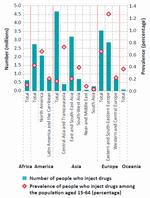
Click to enlargeSources: Responses to the annual report questionnaire; progress reports of the Joint United Nations Programme on HIV/AIDS (UNAIDS) on the global AIDS response (various years); the former Reference Group to the United Nations on HIV and Injecting Drug Use; and government reports.
Note: The 2014 estimate of the total number of PWID worldwide (11.7 million) is slightly lower than the estimate published in the World Drug Report 2015 (12.2 million), although the prevalence of injecting drug use among the population aged 15-64 remains stable. In particular, estimates are now included for five countries in Africa (including for highly populated countries such as Nigeria) for which no data were previously available. This has led to an increase in the coverage of PWID estimates among the population aged 15-64 for Africa, from 29 to 50 per cent, and an improved overall estimate for PWID in Africa, with a corresponding reduction in the level of uncertainty of the regional estimate.The joint UNODC/WHO/UNAIDS/World Bank estimate for the number of people who inject drugs (PWID) for 2014 is 11.7 million (range: from 8.4 to 19.0 million), or 0.25 per cent (range: 0.18-0.40 per cent) of the population aged 15-64. PWID experience some of the most severe health-related harms associated with unsafe drug use, overall poor health outcomes, including a high risk for non-fatal and fatal overdoses, and a greater chance of premature death. |97| This is exacerbated by poor access to evidence-informed services for the prevention and treatment of infections, particularly HIV, hepatitis C and tuberculosis. |98|
Eastern and South-Eastern Europe is the subregion with by far the highest prevalence of injecting drug use: 1.27 per cent of the population aged 15-64. The subregion accounts for almost one in four (24 per cent) of the total number of PWID worldwide; almost all PWID in the subregion reside in the Russian Federation and Ukraine. In Central Asia and Transcaucasia and in North America, the prevalence of injecting drug use is also high: 0.72 per cent of the population aged 15-64 in Central Asia and Transcaucasia; and 0.65 per cent in North America. Those three subregions combined account for 46 per cent of the total number of PWID worldwide. Although the preva-lence of injecting drug use in East and South-East Asia is at a level below the global average, a large number of PWID (27 per cent of the total number of PWID in the world) reside in the subregion, given that it is the most populated subregion. Three countries (China, Russian Federation and United States) together account for nearly half of the total number of PWID worldwide.
Drug use is a major risk factor for the transmission of infectious diseases
Among people who inject drugs, one in seven is living with HIV and one in two is living with hepatitis C
FIG. 16 Estimated number of people who inject drugs living with HIV and prevalence of HIV among people who inject drugs, by region, 2014
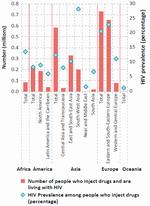
Click to enlargeSources: Responses to the annual report questionnaire; progress reports of UNAIDS on the global AIDS response (various years); the former Reference Group to the United Nations on HIV and Injecting Drug Use; and government reports.
Note: The prevalence of HIV among PWID in Western and Central Europe has been updated from 7.6 per cent (World Drug Report 2015) to 11.2 per cent. This is the result of updated information supplied by Italy, where nationally representative information became available to replace previously reported subnational data.PWID represent a key at-risk population for HIV and hepatitis infections, with almost a third of new HIV infections outside sub-Saharan Africa occurring among PWID. |99| Compared with non-injecting drug users, PWID are approximately three times more likely to acquire HIV, |100| as the sharing of contaminated needles and syringes is a major risk for the transmission of HIV and viral hepatitis. According to joint UNODC/WHO/UNAIDS/World Bank estimates for 2014, 14.0 per cent (or 1.6 million) of PWID are living with HIV, 52 per cent (or 6.0 million) of PWID are infected with hepatitis C and 9.0 per cent (or 1.1 million) are infected with hepatitis B.
HIV prevalence is particularly high among PWID in South-West Asia and in Eastern and South-Eastern Europe, where 28.2 and 22.9 per cent of PWID, respectively, are living with HIV. The two subregions combined account for 53 per cent of the total number of PWID living with HIV worldwide. Although both the prevalence of injecting drug use and the prevalence of HIV among PWID in East and South-East Asia are below the global averages, a large number of PWID living with HIV (330,000, or 21 per cent of the world total) reside in the subregion. Four countries combined (China, Pakistan, Russian Federation and United States) account for 64 per cent of the total number of PWID living with HIV.
Risk behaviour and HIV among users of stimulants remain high
FIG. 17 HIV prevalence among people who inject stimulants and among people who use stimulants but do not inject them
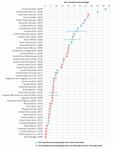
Click to enlargeNote: Based on a comprehensive review of studies commissioned by UNODC. (For details on the studies, see the relevant table in the online Statistical Annex to the World Drug Report.) Where available, the upper and lower bounds of 95 per cent confidence intervals are shown.
Studies have found that people who inject stimulants engage in higher-risk sexual behaviours and have higher HIV prevalence than people who inject opiates. People who inject stimulants (cocaine and amphetamines) have been found to have more sexual partners and more frequent intercourse with casual partners and regular partners than PWID who inject other drugs. Moreover, a systematic review found that the risk of acquiring HIV was 3.6 times greater among people who injected cocaine than among non-injecting users of cocaine, and 3.0 times greater among people who injected ATS than among non-injecting users of ATS. |101|
The use of stimulants (particularly methamphetamine and amphetamine) to enhance and prolong sexual activity is well documented, particularly among men who have sex with men (MSM). |102| There is strong evidence of higher-risk sexual behaviours and higher HIV prevalence among MSM who use methamphetamine or amphetamine than among those who use other drugs. |103| These high-risk sexual behaviours include unprotected sex (or inconsistent condom use) and the selling of sex (in exchange for money or drugs), as well as a higher frequency of sexual activity and an increased number of sexual partners. |104| |105| |106|
As many stimulants (particularly NPS that are stimulants) have a shorter duration of action, compared with users of opiates, users of stimulants report a high frequency of injecting, with compulsive re-injecting and a greater likelihood to report the sharing and reuse of needles and syringes that might be contaminated. |107| |108|
Sustainable Development Goals related to the prevention and treatment of drug use and HIV The General Assembly at its seventieth session adopted the outcome document of the United Nations summit for the adoption of the post-2015 development agenda, containing the 2030 Agenda for Sustainable Development and the Sustainable Development Goals.� The 17 Goals address the different dimensions of sustainable development. Many of the Sustainable Development Goals and their targets are related to the intersection between drugs, peace and justice, but only those related to health and well-being are mentioned here. For a broader discussion on the Sustainable Development Goals and the world drug problem see chapter II of the present report.
Under Goal 3 ("Ensure healthy lives and promote well-being for all at all ages"), global leaders have, for the first time, addressed issues related to the prevention and treatment of substance use. Target 3.5 is to strengthen the prevention and treatment of substance abuse, including narcotic drug abuse and harmful use of alcohol. Achieving that target requires, inter alia, expanding the coverage and quality of a range of evidence-based and gender-responsive interventions for the prevention of drug use, as well as for the care, treatment and rehabilitation of drug use disorders. In this context, UNODC has developed the International Standards on Drug Use Prevention and the International Standards on the Treatment of Drug Use Disorders that have already been recognised by Member States as useful guides to improving their services in numerous Resolutions, as well as in the Outcome document of the special session of the General Assembly. Measuring access to treatment for substance use requires, at the national level, reliable estimates of the number of people in need of treatment for, or those suffering from, drug use disorders and a reliable estimate of the number of people provided with treatment interventions for the use of different drugs.
The second main target under Goal 3, namely target 3.3, is to end, by 2030, the epidemics of AIDS, tuberculosis, malaria and neglected tropical diseases and combat hepatitis, water-borne diseases and other communicable diseases. Other Goals related to addressing HIV and AIDS include those on achieving gender equality (Goal 5); reducing inequality (Goal 10); promoting inclusive societies and providing access to justice (Goal 16); and revitalizing the Global Partnership for Sustainable Development (Goal 17). The UNAIDS Strategy 2016-2021 mirrors these Sustainable Development Goals, setting the following targets for HIV and AIDS treatment and prevention:b
1. The 90-90-90 treatment targets (and by 2030, the 95-95-95 treatment targets): by 2020:
(i) 90 per cent of people (children, adolescents and adults) living with HIV know their status;
(ii) 90 per cent of people living with HIV who know their status are receiving treatment;
(iii) 90 per cent of people in treatment have suppressed viral loads;
2. The prevention target is to reduce the number of new HIV infections to fewer than 500,000 per year by 2020 (and to fewer than 200,000 per year by 2030);
3. Zero discrimination (overcoming human rights, gender-related and legal barriers to HIV services).
� General Assembly resolution 70/1.
b UNAIDS, UNAIDS 2016-2021 Strategy: On the Fast-Track to End AIDS (2015).
It is difficult to quantify the contribution of stimulant use in increasing HIV infection rates but, compared with use of other drugs, the preponderance of evidence points towards a positive association between stimulant use, higher-risk sexual and injecting behaviours and HIV infections. |109| |110|
Outbreaks of HIV among people who use drugs, especially PWID, are a particular concern because HIV can spread very rapidly among PWID when appropriate harm reduction services are not available, discontinued or scaled down. |111| In 2011, such outbreaks occurred among PWID in Greece (Athens) and Romania, where a significant increase in the number of new HIV cases among PWID was reported to be attributable, in part, to the increased use of stimulants (NPS in Romania and mostly cocaine in Greece, as a replacement for opioids in both cases), which was associated with a higher frequency of injecting and an increase in the sharing of needles and syringes among new and young PWID. |112| |113|
Drug-related deaths remain unacceptably high
FIG. 18 Drug-related mortality rate and number of drug-related deaths, by region, 2014
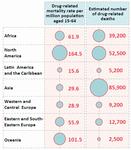
Click to enlargeSources: responses to the annual report questionnaire; Inter-American Drug Abuse Control Commission; and Louisa Degenhardt and others, "Illicit drug use", in Comparative Quantification of Health Risks: Global and Regional Burden of Disease Attributable to Selected Major Risk Factors, vol. 1, Majid Ezzati and others, eds. (Geneva, World Health Organization (WHO), 2004), p. 1,109.
Number of drug-related deaths worldwide remains stable
In 2014, there were an estimated 207,400 (range: 113,700-250,100) drug-related deaths |114| worldwide, corresponding to 43.5 (range: 23.8-52.5) deaths per million people aged 15-64. Overdose deaths account for between approximately one third and one half of all drug-related deaths worldwide, and in most cases those overdose deaths involved opioids. |115| |116|
The highest drug-related mortality rate continues to be in North America, which accounts for approximately one in four (25 per cent of) drug-related deaths worldwide. The high mortality rate in North America is attributable in part to better monitoring and reporting of drug-related deaths and to the comparatively higher rates of opioid use in that subregion. In the United States, nearly half a million people are estimated to have died from drug overdoses since 2004; the country experienced a record number of fatal drug overdoses in 2014, 61 per cent of which were associated with prescription opioids and heroin. |117|
Fentanyl-related overdose deaths reported in many countries
Fentanyl, |118| a synthetic opioid, has recently been implicated in a significant and increasing number of deaths in a number of countries. Recent concerns have been raised in a number of European countries, especially in Estonia, which has one of the highest drug-related mortality rates in Europe (127 drug-related deaths per million people aged 15-64 in 2013), and where overdoses are mostly associated with the use of fentanyl. |119| |120| In Canada, during the six-year period 2009-2014 there were at least 655 deaths in which fentanyl was determined to be the cause or a contributing cause of death, the number of deaths increasing markedly in the four largest provinces. |121| In the United States, there were more than 700 deaths related to fentanyl use between late 2013 and late 2014. One matter of concern is that heroin is often laced with fentanyl before being sold, and so heroin users have no knowledge of having consumed fentanyl. That situation could be exacerbated by the recent increase in heroin use in the United States. |122|
Are we underestimating the number of drug-related deaths? Accurate estimates of the extent and patterns of drug-related deaths are vital for monitoring the most extreme form of harm that can result from drug use and for evaluating the effectiveness of interventions put in place to reduce drug-related mortality.
The definition of drug-related deaths varies from country to country, but could include all, or at least some, of the following: fatal drug overdoses; deaths due to AIDS acquired through injecting drug use; intentional self-poisoning by exposure to psychotropic substances (suicide); and unintentional deaths and trauma (motor vehicle accidents and other forms of accidental death) due to drug use. However, many countries only report overdose deaths. This definition is framed from a health perspective, considering drug-related deaths in the context of the burden of disease. However, a broader perspective could also include deaths resulting from the functioning of illicit drug markets and could include, for example, deaths as a result of violence associated with the illicit supply of and trafficking in drugs.
Ascertaining the cause of death can be complicated in cases where drug use is suspected of playing a part or in the absence of information surrounding the circumstances of the death or the environment in which the death occurred. The process for determining the cause of death may vary from country to country and even within the same country. Depending on the discretion of the certifying physician and the available information about the deceased person's prior medical history and/ or circumstances of death, more comprehensive, investigative procedures, including post-mortem toxicological investigations, may or may not be initiated. Although procedures may be well established for identifying overdose deaths resulting from the use of drugs such as heroin, the process may become complex if multiple drugs are involved, as in many fatal overdose cases. Also, the role of NPS in fatal overdose cases may be more difficult to determine, given the unknown toxicology of many NPS, particularly when they are used in combination with other drugs (including alcohol), in which case the risk of overdose can be higher. Mortality registers often contain a significant number of deaths classified as unknown or ill-defined or cases in which the true underlying cause of death may be miscoded, depending on the coding practices and information available to the responsible physician. Thus, drug-related deaths are likely to be underreported.
Very few studies have attempted to estimate the level of underreporting of drug-related deaths. In France, for example, significant differences were apparent in official numbers from three different institutions with a very low rate of overlapping cases; there was underreporting of approximately a third of the total drug-related deaths.� In a study conducted in Italy, using an approach that examined multiple causes of death (the analysis of all conditions reported on the death certificate), it was estimated that there were 60 per cent more drug-related deaths than determined from traditional reporting on a single underlying cause of death.b
� Eric Janssen, "Drug-related deaths in France in 2007: estimates and implications", Substance Use and Misuse, vol. 46, No. 12 (2011), pp. 1495-1501.
b Francesco Grippo and others, "Drug induced mortality: a multiple cause approach on Italian causes of death Register", Epidemiology Biostatistics and Public Health, vol. 12, No. 1 (2015).
Prisons are a high-risk environment for infectious diseases
Among vulnerable people who use drugs, particularly PWID, imprisonment is a common outcome. According to studies conducted in a large number of countries, between 56 and 90 per cent of PWID have been imprisoned at some stage. |123| Initiation and use of drugs are also reported by many prisons and other closed settings. |124| According to the limited data made available to UNODC, recent use of drugs (drug use in the previous 12 months) is reported to be around 23 per cent among the prison population, with cannabis use at around 19 per cent and heroin or amphetamine use among approximately 5 per cent. Similarly, a large number of studies in countries throughout the world have found high levels of injecting drug use among both male and female prisoners. |125|
TABLE 1 Ratio of drug-related mortality rates among ex-prisoners to all-cause mortality rates among the general population
Country or area Time since release from prison 1 week 2 weeks 45 days 1 year 3 years 4-5 years 7-8 years 15 years United Kingdoma 37.1 12.4 United States 129 Denmark 61.9 Switzerland 50 Taiwan Province of China 29.3 United Statesb 10.3 United States United Kingdoma Males 28.9 15.8 Females 68.9 56.3 Australiac Males 14.5 Females 50.3 France Males aged 15-34 124.1 Males aged 35-54 274.2 Source: WHO, Preventing Overdose Deaths in the Criminal Justice System (Copenhagen, 2014).
Note: The numbers presented are standardized mortality ratios. They express the ratio of deaths from drug-related causes observed among ex-prisoners compared to the number of deaths from all causes that would be expected among people of comparable age and gender in the general population.
� First and second weeks calculated separately. b Not time-limited (median = 4.4 years). c Not time-limited (median = 7.7 years).The risk of HIV, hepatitis and tuberculosis infection in prisons continues to be a matter of significant concern. In some settings, the burden of HIV among prisoners may be up to 50 times higher than among the general population, |126| the incidence of tuberculosis is, on average, 23 times higher than among the general population |127| and an estimated two out of every three prisoners with a history of injecting drug use are living with hepatitis C. |128|
Despite the high-risk environment and the scientific evidence of the effectiveness of interventions for the treatment of drug use disorders, and the prevention and treatment of HIV, hepatitis C and tuberculosis, |129| there are significant gaps in the provision of these services in most prisons throughout the world. Prisons and other closed settings often lack adequate health services, confidentiality and privacy; furthermore, mandatory (non-voluntary) HIV testing remains a common practice. |130|
Available evidence indicates that drug dependence treatment and harm reduction interventions can be effectively implemented within prisons without compromising security or increasing drug use. |131| In a number of countries, however, there are political, legal and regulatory barriers to introducing or expanding those services in prisons. In 2014, opioid substitution therapy was available in prisons in only 43 countries, whereas 80 countries reported the availability of such therapy in the community. The availability of needle and syringe programmes in prisons was reported in only 8 countries, whereas 90 countries reported the availability of such programmes in the community. Most of the above-mentioned 8 countries are in Europe and Central Asia, and such interventions are not available in all prison settings. |132|
Substantially higher risk of drug-related death soon after release from prison
The period shortly after release from prison is associated with a substantially increased risk of drug-related death (primarily fatal overdose), with a mortality rate much higher than from all causes of death among the general population. |133| The first two weeks after release from prison is a period of particular vulnerability, with a risk of drug-related death 3-8 times higher than in the subsequent 10 weeks. |134| Moreover, the drug-related mortality rate after release from prison has been found to be 50-100 times higher than the mortality rate of the general population. According to the very limited data available, female ex-prisoners appear to experience poorer outcomes than male ex-prisoners, and older ex-prisoners experience poorer outcomes than younger ex-prisoners. This may reflect different histories and patterns of drug use depending on the gender and age of ex-prisoners.
The increased risk of drug-related death after release from prison is principally attributable to two causes: first, decreased tolerance to drugs, especially heroin, after a period of relative abstinence that occurs in prison, where drug use may be more infrequent and the purity of drugs lower than outside of prison; and second, the use of multiple drugs after release from prison, particularly the combination of depressants (such as benzodiazepines and alcohol) with heroin, which can considerably increase the risk of fatal overdose. |135|
Over the period 2009-2014, the cultivation of cannabis plants was reported to UNODC by 129 countries, far more than the 49 countries (mostly in Asia and the Americas) that reported opium poppy cultivation and the 7 countries (in the Americas) that reported coca bush cultivation. |136| According to the latest UNODC estimates, in terms of area, cannabis is also the most extensively grown drug crop, |137| particularly if wild growth is included. |138| The extent of, and trends in, cannabis cultivation and production are, however, difficult to assess, given that systematic measurements do not exist.
Despite diverging trends in opium poppy and coca bush cultivation, the production of opium and cocaine has returned to the levels of the late 1990s
FIG. 19 Estimated total area under opium poppy and coca bush cultivation, 1998-2015

Click to enlargeSources: UNODC coca and opium surveys in various countries; responses to the annual report questionnaire; and United States, Department of State, International Narcotics Control Strategy Report, various years.
FIG. 20 Global production of opium and cocaine, 1998-2015
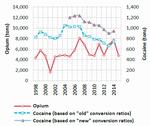
Click to enlargeSources: UNODC coca and opium surveys in various countries; responses to the annual report questionnaire; and United States, Department of State, International Narcotics Control Strategy Report, various years.
Information relating to the area under illicit cultivation is more reliable in the case of coca bush and opium poppy cultivation than in the case of cannabis plant cultivation, as it is largely based on scientifically validated surveys. Although fluctuating, the total area under opium poppy cultivation in 2015 was higher than in 1998 (18 per cent), the year in which the General Assembly held its previous special session dedicated to the world drug problem; and the total area under opium poppy cultivation has increased sharply (by 51 per cent) since 2009 (the year of adoption of the Political Declaration and Plan of Action on International Cooperation towards an Integrated and Balanced Strategy to Counter the World Drug Problem) largely as a result of increased cultivation in Afghanistan. In contrast, the total area under coca bush cultivation has followed a downward trend, falling by 31 per cent since 1998 and by 19 per cent since 2009.
"Old" versus "new" conversion ratios for estimating cocaine production The last step in calculating cocaine production requires each producing country to estimate factors for converting coca leaf to cocaine hydrochloride. In the present report, two conversion factors are used for global estimates: (i) an "old" conversion ratio, as estimated by the United States Drug Enforcement Administration (DEA), for the Plurinational State of Bolivia and Peru in the 1990s, and a study by the Government of Colombia and UNODC, for Colombia; (ii) a "new" conversion ratio, based on studies undertaken by DEA in Peru in 2005, and in the Plurinational State of Bolivia in 2007-2008. However, these ratios have not been reconfirmed in national studies. The "new" ratio also considers the conversion factor for Colombia established in 2004. (For more details, see World Drug Report 2010 (United Nations publication, Sales No. E.10. XI.13, pp. 251 and 252) and the online methodology section of the present report).
Global estimates show that illicit opium production declined sharply in 2015 (by 38 per cent) to 4,770 tons, the level of the late 1990s. Of that amount, the part estimated to have been transformed into heroin would result in an output of 327 tons of heroin of export purity, largely from heroin manufacture in Afghanistan. Cocaine production, estimated at 746 tons (based on the "old" conversion ratio) or 943 tons (based on the "new" conversion ratio) of pure cocaine hydrochloride in 2014, also declined in the period 2007-2014, returning to its 1998 level. Thus, despite a significant decline in coca bush cultivation, cocaine production has not fallen in relation to its 1998 level, mainly because of increases in the efficiency of cocaine-processing laboratories in the Andean subregion.
Strong increase in trafficking in synthetic drugs at the global level
Although there were 234 substances under international control in 2014 (244 in January 2016), seizure data indicate that the bulk of the trafficking involved a far smaller number of substances. Cannabis in its various forms continued to be the most widely trafficked drug in 2014 (as cannabis was seized in 95 per cent of the reporting countries in 2014 and cannabis seizure cases accounted for over half of the 2.2 million drug seizure cases reported to UNODC that year); it was followed by ATS (16 per cent), opioids and coca-related substances (accounting for 12 per cent each).
Global quantities of cannabis, cocaine, heroin and morphine seized almost doubled over the period 1998-2008 but have remained largely stable since then. In contrast, ATS seizures have risen more than seven-fold since 1998, suggesting that growth in drug trafficking has been more in synthetic stimulants than in the usual plant-based drugs. Growth has been particularly strong in the case of methamphetamine seizures and, to a lesser extent, amphetamine seizures. Improvements in precursor control brought the quantities of intercepted "ecstasy" down from the 2008 level to a low in 2011, but recent innovations in the manufacture of "ecstasy" (in particular, the use of pre-precursor chemicals not under international control) can already be seen on the market, as suggested by a doubling of the amounts seized between 2011 and 2014.
Interpreting drug seizures A direct indicator of drug law enforcement activity, drug seizures are the result of those successful operations that end in drug interceptions and are thus influenced by law enforcement capacity and priorities. At the same time, drug seizures are one of the key elements in understanding illicit drug market dynamics, drug availability and drug trafficking patterns and trends, particularly if broad geographical entities are considered and long periods are analysed.
Fig. 21 Breakdown of drug seizure cases reported worldwide, by type of drug, 2014
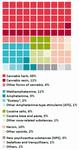
Click to enlargeSource: Responses to the annual report questionnaire
Note: Information presented in the figure is based on 2.2 million seizure cases reported to UNODC by 63 countries.FIG. 22 Quantities of drugs seized worldwide, by type of drug, 2014
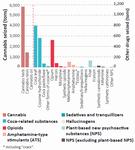
Click to enlargeSource: Responses to the annual report questionnaire
Note: Based on information from 120 countries.FIG. 23 Trends in the quantities of drugs seized worldwide, 1998-2014
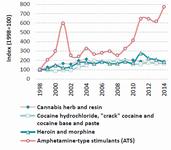
Click to enlargeSource: Responses to the annual report questionnaire
Increases in trafficking have been even greater in the group of NPS in recent years. Accounting for 3 per cent of all drug seizure cases in 2014, seizures of NPS are still comparatively small (up from 1 per cent in 2009 and 0.1 per cent in 1998). In terms of the quantity seized, seizures of NPS (excluding plant-based NPS such as khat (Catha edulis) and kratom (Mitragyna speciosa)) rose 15-fold between 1998 and 2014. Ketamine and synthetic cannabinoids have been seized the most; the total quantity of ketamine seized worldwide increased from an annual average of 3 tons in the period 1998-2008 to 10 tons in the period 2009-2014.
Drug offences, cultivation and gender
Men are more involved than women in drug-related crime
FIG. 24 Proportion of women brought into formal contact with the criminal justice system for drug trafficking, by type of drug, 2010-2014
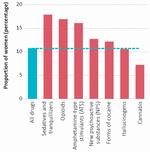
Click to enlargeSource: Responses to the annual report questionnaire
In all countries, more men than women are brought into formal contact with the criminal justice system for possession of drugs for personal use and for trafficking in drugs. In the period 1998-2014, the number of women reported to have been arrested for drug-related offences increased in absolute terms (as did the number of countries providing to UNODC a breakdown of arrests by gender), whereas the proportion of women in drug-related cases, while fluctuating, followed a downward trend, particularly for offences related to drug trafficking.
According to information from 100 countries, during the period 2010-2014, women accounted for around 10 per cent of all cases in which people were brought into formal contact with the criminal justice system for drug-related offences. The proportion was slightly lower for the possession of drugs for personal use (9 per cent) and slightly higher for drug trafficking (11 per cent); however, those proportions are substantially lower than the proportion of women who use drugs (about a third of the total number of people who use drugs).
The proportion of women brought into formal contact with the criminal justice system in drug trafficking cases is clearly above the global average (12 per cent) in Oceania (19 per cent) and in the Americas (15 per cent) and below average in Africa (2 per cent). Data for Asia show a proportion above the global average in East and South-East Asia (13 per cent), while in other Asian subregions the proportion is below the global average (less than 1 per cent in the Near and Middle East and in South Asia). Data for Europe show a below-average proportion of women brought into formal contact with the criminal justice system (10 per cent), with the proportion being above average in Eastern Europe (12 per cent) and below average in Western and Central Europe (9 per cent) and in South-Eastern Europe (6 per cent).
Women in opium poppy cultivation: attitudes, perceptions and practices
While women play only a limited role in drug trafficking in countries in the Near and Middle East (less than 1 per cent), they are involved in the illicit cultivation of drug crops, particularly opium poppy in Afghanistan. As part of the annual opium survey conducted by UNODC and the Government of Afghanistan, in 2015 focus group discussions were held for the first time with women in four northern provinces in order to learn more about their attitudes and participation in opium poppy cultivation and production.
The discussions revealed that women in Afghanistan took part in many of the labour-intensive processes in opium poppy production, such as weeding and clearing fields, as well as lancing and later (indoors) breaking opium poppy capsules, removing and cleaning seeds, preparing opium gum for sale and processing by-products such as oil and soap. Men were mainly involved in ploughing fields, cultivating and, at times, lancing capsules.
In most rural communities in Afghanistan, women were less empowered than men and had only a limited role in decision-making. Decisions about opium poppy cultivation were thus primarily taken by men, although it appeared that women were increasingly being consulted, including about the decision to cultivate opium poppy.
In the absence of access to adequate health-care facilities in rural areas, opium had been used for generations by women in northern Afghanistan as a remedy for the most common ailments among children, such as coughs, colic, aches and pains, restlessness and diarrhoea. Self-medication with opium continued to be a common practice for the treatment of ailments among adults, such as aches and pains, sleeplessness and chest pains, which were probably due to respiratory illnesses. Older women may have been more regular or dependent users of opium, but younger women were becoming increasingly aware that regular opium use could cause dependence and thus tended to rely more on "modern medicines", when available, for the treatment of common illnesses.
The discussions also revealed that women in Afghanistan were generally aware that opium could produce dependence and that its use for non-medicinal purposes was forbidden by their religion. They were also concerned that the next generation could become dependent on opium, although resolving their economic problems continued to be their main concern. In the absence of economic opportunities or alternatives, women considered that income generated from opium poppy production could be used to pay household expenses, enabling them to buy essentials such as food, as well as furniture, clothes and jewellery, and it enabled families to repay their debts and to pay for their children's education and marriages. The production of opium poppy not only brought cash income to house holds, but it was also a mainstay in rural areas, as poppy seeds were used to extract oil for cooking and poppy straw was used for fuel in the kitchen, as well as for preparing soap and making poppy tea.
Drug purchases via the "dark net" are gaining in importance
FIG. 25 Proportion of survey respondents who had purchased drugs on the "dark net", by country and region, 2014
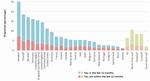
Click to enlargeSource: Global Drug Survey 2015 (www.globaldrugsurvey.com).
Note: The figure shows the proportion of people participating in the Global Drug Survey who bought drugs via the "dark net" between November and December 2014.
� Based on the replies of fewer than 600 respondents.
b Regional results show the national (and subnational) results weighted by population.FIG.26 Drugs purchased on the "dark net", by type of drug, 2014

Click to enlargeSource: Global Drug Survey 2015 (www.globaldrugsurvey.com).
Note: Proportion of survey respondents who bought each drug on the "dark net" among participants in the Global Drug Survey between November and December 2014.The purchasing of drugs via the Internet, particularly the "dark net", may have increased in recent years. This trend raises concerns in terms of the potential of the "dark net" to attract new populations of users by facilitating access to drugs in a setting that, although illegal, allows users to avoid direct contact with criminals and law enforcement authorities. As the "dark net" cannot be accessed through traditional web searches, buyers and sellers access it through the "Onion Router" (TOR) to ensure that their identities remain concealed. Products are typically paid for in bitcoins or in other crypto-currencies and are most often delivered via postal services.
A number of successful law enforcement operations world-wide have taken place in recent years to shut down trading platforms on the "dark net", such as "Silk Road" in October 2013 or "Silk Road 2.0" in November 2014, as part of Operation Onymous, coordinated by the European Police Office (Europol), which also led to the closure of other sites on the "dark net", including 33 high-profile marketplaces. Law enforcement pressure also prompted some "voluntary" temporary shutdowns, such as "Agora" in August 2015. However, as one marketplace closes, the next most credible marketplace tends to absorb the bulk of the displaced business. |139|
A global survey |140| of more than 100,000 Internet users (three quarters of whom had taken illegal drugs) in 50 countries in late 2014 suggested that the proportion of drug users purchasing drugs via the Internet had increased from 1.2 per cent in 2000 to 4.9 per cent in 2009, 16.4 per cent in 2013 and 25.3 per cent in 2014. The proportion of Internet users making use of the "dark net" for drug purchases had also increased, reaching 6.4 per cent (lifetime) in 2014, including 4.5 per cent (70 per cent of 6.4 per cent) who had purchased drugs over the "dark net" in the previous 12 months (ranging from less than 1 per cent to 18 per cent).
Among "recent" drug users, the proportion rose by more than 25 per cent from 2013 to 2014 (from 4.6 to 5.8 per cent). In the period 2012-2014, the proportion doubled in Australia (from 4.3 to 10.4 per cent) and in the United Kingdom (from 8.0 to 15.1 per cent), and in the period 2013-2014, the proportion also increased among "recent" users in the United States (from 7.7 per cent in 2013 to 9.6 per cent in 2014).
Survey respondents reported a number of advantages to purchasing drugs on the "dark net". Some of those advantages were related to the drug products themselves, which were reported to be generally of better quality and more readily available. Other advantages included the fact that the purchaser's interactions were virtual, thus decreasing the risk to personal safety during transactions, including through the absence of exposure to physical violence; in addition, there was a perceived decrease in the risk of being apprehended by law enforcement authorities. |141| This may help explain why, in general, drug users seem ready to pay a premium for drugs purchased via the "dark net" |142| and why people who have never previously used drugs may be tempted to purchase them online: the survey showed that around 4 per cent of "dark net" drug users had not used any drugs prior to accessing them through the "dark net". |143| At the same time, 30 per cent of people who purchased drugs via the "dark net" reported having consumed a wider range of drugs than they did before they began purchasing drugs via the "dark net".
D. MARKET ANALYSIS BY DRUG TYPE
Key figures

Click to enlargeNote: Opioids include the non-medical use of prescription opioids and opiates (opiates include opium and heroin).
Opiate market developments
Special conditions led to a 38 per cent decline in global production of opium in 2015
FIG. 27 Opium poppy cultivation and opium production, 1998-2015
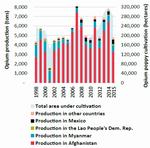
Click to enlargeSource: Calculations based on UNODC illicit crop monitoring surveys and responses to the annual report questionnaire.
Note: Data for 2015 are preliminary, as production data for a few coun-tries in South America are still missing.
The main areas of opiate production are in three subregions. Countries in South-West Asia (mostly Afghanistan) supply markets in neighbouring countries and in countries in Europe, the Near and Middle East, Africa and South Asia, with small proportions going to East and South-East Asia, North America and Oceania. Countries in South-East Asia (mostly Myanmar and, to a lesser extent, the Lao People's Democratic Republic) supply markets in East and South-East Asia and in Oceania, with smaller proportions going to South Asia. Countries in Latin America (mostly Mexico, Colombia and Guatemala), supply markets in countries in North America (except Canada, which is predominantly supplied by opiates originating in Afghanistan) and the more limited markets in South America. In addition, in a number of countries, important quantities of opium poppy are cultivated for the domestic market (for example, in India). Thus, opium is illicitly produced in nearly 50 countries worldwide.
In 2015, the total area under opium poppy cultivation worldwide decreased by 11 per cent from the level of the previous year, to around 281,000 hectares (ha); that decline is primarily a reflection of a drop in cultivation reported by Afghanistan (-19 per cent), although, at 183,000 ha, Afghanistan still accounted for almost two thirds of the total area under illicit opium cultivation. Myanmar accounted for 20 per cent (55,500 ha) of the total, Mexico accounted for 9 per cent and the Lao People's Democratic Republic for 2 per cent.
Global opium production in 2015 fell by 38 per cent from the previous year, to some 4,770 tons |144| (i.e. to the level of the late 1990s). The decrease was primarily the result of a decline in opium production in Afghanistan (-48 per cent compared with the previous year), mainly attributable to poor yields in the country's southern provinces.
First results of the opium poppy cultivation survey in Mexico, 2014-2015 In the period 2014-2015, the Government of Mexico, with support from UNODC, conducted the first joint opium poppy survey in Mexico. The areas under opium poppy cultivation, estimated to have amounted to up to 28,100 ha, are mostly located in the mountainous areas of the western part of the country. It should be noted, however, that the new figures for Mexico, for methodological reasons, are not comparable with those published previously.
The project so far has not been able to produce estimates of opium production. For the purpose of the present report, yield estimates established from data provided by the United States for the years 2001, 2002 and 2003 were used to produce estimates of opium production.� The figure for opium production will be adjusted once new yield data become available from the crop monitoring project and an appropriate methodology for opium production estimates has been developed.
� The Government of Mexico does not validate the estimates provided by the United States up to 2014, as they are not part of its official figures and it does not have information on the methodology used to calculate them.
Nonetheless, Afghanistan remains the world's largest opium producer, accounting for some 70 per cent (3,300 tons) of global opium production; it is followed by Myanmar, accounting for 14 per cent (650 tons) of global production. Opium production in Latin America more than doubled over the period 1998-2014, reaching some 500 tons and accounting for almost 11 per cent of the estimated global opium production in 2015.
After deducting the estimated quantities of opium consumed from the 4,770 tons of opium produced in 2015, potential heroin manufacture from the 2015 global opium poppy harvest can be estimated at 327 tons of heroin (of export purity). As demand does not generally change rapidly and the data on heroin seizures suggest a somewhat steady supply (see the discussion in this section), it is likely that the supply of heroin to the market remained significantly higher than the latter. Following the 1998 special session of the General Assembly, data also indicate a significant increase in the global interception rate for opiates, which more than doubled between the periods 1990-1997 and 2009-2014.
Global opiate market appears to be stable despite important regional changes
FIG. 28 Trends in the global interception rate for opiates, 1980-2014
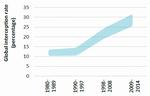
Click to enlargeSource: Calculations based on responses to the annual report questionnaire and UNODC opium poppy cultivation surveys.
Note: For details of the calculation methods see the online methodology section of the present report.
UNODC estimates suggest that the global number of users of opiates (i.e. opium, morphine and heroin) has changed little in recent years and that opiate use continued to affect some 0.4 per cent of the global population aged 15-64, or the equivalent of some 17 million people, in 2014. Although there continue to be large data gaps that may mask changes, the prevalence of the use of opiates has not changed in more than a decade, and it continues to be relatively high in West Asia (0.9 per cent), Central Asia (0.8 per cent), Europe (0.56 per cent) and North America (0.5 per cent).
FIG. 29 Prevalence of past-year heroin use according to household surveys in Europe, selected countries, 1999-2014
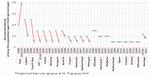
Click to enlargeSource: Responses to the annual report questionnaire
There are indications of a recent increase in heroin use in some markets in Western and Central Europe, suggesting that the long-term downward trend in heroin use may have come to an end. In fact, heroin use has been stable or declining in Western and Central Europe since the late 1990s. This can be seen, inter alia, in household survey data, even though they only cover a certain proportion of all heroin users. Recently, however, some increases in large-scale seizure cases and rising heroin purity indicate that supply may have increased. |145| In at least one major European heroin market (the United Kingdom), |146| |147| heroin-related deaths also increased markedly between 2012 and 2014. In addition, estimates of problem opiate users in France showed a marked increase in recent years. Moreover, heroin prevalence rates in Italy, based on household surveys, showed a significant increase between 2008 and 2014.
Increasing heroin use among 15-year-old boys in Italy There are signs that heroin use may be on the increase among young people in Italy. According to the latest youth survey on drug use (2015), the use of heroin among 15-year-old boys doubled to 2 per cent in 2015, although there was a slight decrease (from 1.3 per cent in 2014 to 1 per cent in 201 5) in the rate among 15-19 year olds of both sexes. The Italian health authorities have also reported an increase in treatment admissions related to heroin use.
The use of cannabis and stimulants increased slightly, while the use of cocaine and hallucinogens decreased in 2015. Around 1.4 per cent of males and 0.6 per cent of females had injected drugs in the past year.
Source: Istituto de Fisiologia Clinica del Cnr, Italian Report for the European School Survey Project on Alcohol and Other Drugs (ESPAD), Pisa, quoted in Corriere Della Sera, "II Raporto ESPAD - Droga a Scuola Crese il consumo de eroina tra i 1 5enni", 8 April 2016.
FIG. 30 Prevalence of past-year heroin use and number of heroin-related deaths per 100,000 population in the United States, 1999-2014
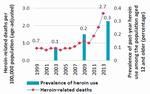
Click to enlargeSource: United States, Center for Behavioral Health Statistics and Quality, Behavioral Health Trends in the United States: Results from the 2014 National Survey on Drug Use and Health, HHS Publication No. SMA 1 5-4927, NSDUH Series H-50 (Rockville, Maryland, 2015); and Office of National Drug Control Policy, National Drug Control Strategy: Data Supplement 2015.
In North America, heroin use has been on the increase for some time; a development reflected in national household surveys and in the number of heroin-related deaths. Based on perceived trends reported to UNODC, the use of opioids has also increased in Africa.
FIG. 31 Prevalence of past-year opioid use in Australia, 1998-2013
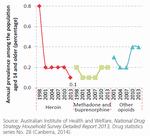
Click to enlargeSource: Australian Institute of Health and Welfare, National Drug Strategy Household Survey Detailed Report 2013, Drug statistics series No. 28 (Canberra, 2014).
Opiate use in Asia, however, is reported to have remained largely unchanged over the period 1998-2014, whereas opiate use in Oceania declined. The decline in opiate use in Oceania largely reflects changes in Australia, the largest opiate market in the region, where prevalence of past-year heroin use declined from a peak of 0.8 per cent in 1998 to 0.2 per cent in 2001 (following a "heroin drought" induced by intensified law enforcement activity) before falling further to 0.1 per cent by 2013, more than offsetting increases in the non-medical use of synthetic opioids.
West Asia and, to a lesser extent, Europe continue to dominate opiate seizures
FIG. 32 Quantities of heroin and morphine seized worldwide, by trafficking route, 1998-2014
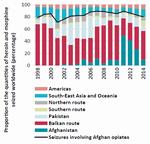
Click to enlargeSource: Responses to the annual report questionnaire.
In 2014, the largest quantities of opiates were seized in South-West Asia, followed by Europe. At the country level, the Islamic Republic of Iran reported the largest opiate seizures worldwide in 2014, accounting for 75 per cent of global opium seizures, 61 per cent of global morphine seizures and 17 per cent of global heroin seizures. The next largest heroin seizures were reported by Turkey (accounting for 16 per cent of global heroin seizures), China (12 per cent), Pakistan (9 per cent), Kenya (7 per cent), the United States (7 per cent), Afghanistan (5 per cent) and the Russian Federation (3 per cent).
Seizure data, though they reflect the priorities and resources of law enforcement, also suggest an increase in the smuggling of opiates from the "Golden Triangle", in South-East Asia, to illicit markets in that subregion, as well as an increase in the smuggling of heroin from illicit opium poppy cultivation areas in Latin America to the United States since 2007. Seizures involving Afghan opiates account for some 80 per cent of global seizures of opiates. Partly as a consequence of decreasing opiate seizures in Afghanistan, increases in opiate seizures have been reported in recent years in the countries of the so-called "Balkan route" (through Iran (Islamic Republic of) and Turkey via South-Eastern Europe to Western and Central Europe), the so-called "northern route" (through Central Asia to the Russian Federation) and the so-called "southern route" (southwards to the Gulf region, South Asia and Africa). Nonetheless, seizure data suggest that the Balkan route, which accounts for almost half of all heroin and morphine seizures worldwide, continues to be the world's most important opiate trafficking route.
The Balkan route is the most important conduit for heroin trafficking
FIG. 33 Opium production in Afghanistan and heroin and morphine seizures in key countries along the Balkan route, 1998-2015
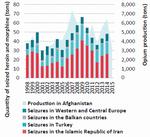
Click to enlargeSource: UNODC Afghanistan opium survey, 2015 and previous years; and responses to the annual report questionnaire.
A recent UNODC study on opiate trafficking on the Balkan route suggests that the majority of the opiates leaving Afghanistan over the period 2009-2012 were smuggled on the Balkan route (i.e. through Iran (Islamic Republic of) and Turkey via South-Eastern Europe to Western and Central Europe). |148| Seizures of heroin and morphine on the Balkan route amounted to some 48 tons in 2014, up from 36 tons in 2012, but down from a peak of 66 tons in 2009. While the Balkan route is the main heroin trafficking route leading to Western and Central Europe, not all of the heroin smuggled to that subregion arrives via that trafficking route. The authorities of the United Kingdom, for example, reported that, although most of the heroin entering that country continues to be smuggled on the Balkan route towards the Netherlands and France before being shipped into the United Kingdom, significant amounts of heroin also enter the United Kingdom each year on direct flights from Pakistan. Similarly, Belgium and Italy reported that important quantities of heroin had been trafficked via the southern route in recent years.
The southern route has grown in importance
Changes in seizures, supported by intelligence reports, suggest that the smuggling of Afghan opiates via the southern route (i.e. leaving Pakistan or the Islamic Republic of Iran by sea for shipment to the Gulf region, Africa (particularly Eastern Africa), South Asia and, to a lesser extent, South-East Asia, Oceania and North America) have increased in recent years. |149|
The main southern route countries are in Asia, the Gulf area and neighbouring countries in the Near and Middle East and in Africa. Average annual heroin and morphine seizures reported by southern route countries rose by more than 80 per cent, to 3.6 tons per year, between the periods 1998-2008 and 2009-2014. The increase was primarily due to a sixfold increase in seizures reported in Africa (mostly in East Africa). The amount of opiates seized on the southern route was smaller than that reported on the Balkan route but, at 9 tons of heroin and morphine, exceeded the amount seized on the northern route in 2014. Given the limited capacity of law enforcement in many of the countries on the southern route, the actual importance of trafficking on this route may be greater than suggested by the amount seized.
FIG. 34 Opium production in northern and north-eastern Afghanistan and quantities of heroin and morphine seized in key countries and subregions along the northern route, 1998-2015
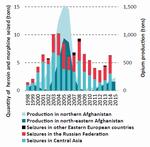
Click to enlargeSource: Responses to the annual report questionnaire.
Trafficking on the northern route has started to recover from the decline in the period 2004-2012
The northern route leaves Afghanistan for neighbouring countries in Central Asia, the Russian Federation and other members of the Commonwealth of Independent States. Traditionally, the northern route was mainly supplied by opium produced in the north-eastern and northern provinces of Afghanistan, although over the past decade the route has also been supplied by opium produced in southern Afghanistan. Following strong increases in trafficking over the period 1998-2004, in line with major increases in opium production in northern parts of Afghanistan, seizures declined between 2004 and 2012, in parallel with declines in opium production, before starting to recover in the subsequent years, reaching 6.3 tons in 2014, having returned to the level reported in 2009.
Trafficking in opiates from the Golden Triangle is on the increase
FIG. 35 Opium production in South-East Asia and quantities of heroin and morphine seized in key countries and regions affected by that production, 1998-2014
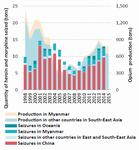
Click to enlargeSource: UNODC opium surveys in South-East Asia; and responses to the annual report questionnaire.
Partly as a result of changes in opium production in Myanmar, seizures of opiates (mainly heroin) leaving the area known as the Golden Triangle have picked up since 2008, following decreases between 2001 and 2008. The quantity of seized heroin and morphine increased from a low of 5.7 tons in 2008 to 13 tons in 2014.
Not all of the opiates seized in South-East Asia and Oceania originated in Myanmar. In the responses to the annual report questionnaire submitted by countries in South-East Asia and Oceania, Afghanistan and Pakistan accounted for 27 per cent of all the countries mentioned as countries of origin or departure of seized opiates in the period 2009-2014, although that proportion fell to 11 per cent in 2014.
Data provided by China suggest that by 2010, the proportion of heroin smuggled into the country from South-East Asia may have fallen to around 70 per cent while the proportion of heroin from Afghanistan increased to nearly 30 per cent. |150| By 2013, the proportion of heroin from Afghanistan had fallen to 10 per cent, and by 2014, Afghanistan was no longer mentioned among the key source countries of shipments of opiates to China; the "new" main source countries for heroin shipments were Myanmar, followed by the Lao People's Democratic Republic and Viet Nam.
Based on the forensic analysis of seizures, a similar trend was reported by Australia. Traditionally, almost all of the heroin found in Australia originated in South-East Asia. Heroin originating in South-East Asia accounted for 79 per cent of the total in 2005, but that proportion fell to just 26 per cent in 2008 before recovering in subsequent years to 72 per cent of the total over the period January-June 2014. |151|
FIG. 36 Quantities of heroin and morphine seized in the Americas and opium production in Latin America, 1998-2014

Click to enlargeSource: Responses to the annual report questionnaire; government reports.
Heroin trafficking in the Americas continues to increase
Heroin and morphine seizures in the Americas rose from an average of 4 tons per year over the period 1998-2008 to 7 tons per year over the period 2009-2014 (8 tons in 2014). In parallel, opium production reported in Latin America doubled, from an average of 151 tons per year over the period 1998-2008 to 309 tons per year over the period 2009-2014.
More than 70 per cent of all heroin and morphine seizures in the Americas over the period 2009-2014 were made in the United States, where such seizures more than doubled from an average of around 2 tons per year over the period 1998-2008 to 5 tons per year over the period 2009-2014 (6 tons in 2014). Heroin trafficking and use emerged in 2015 as the main national drug-related threat for law enforcement agencies in the United States (increasing in perception as the main threat from 8 per cent of all drug threats in 2007 to 33 per cent in 2015). |152|
Given the volatile nature of opium production, what is happening in the heroin market?
FIG. 37 Opium production, opiate seizures, opiates available for consumption and number of opiate users, 1998-2015
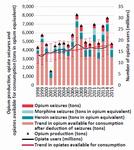
Click to enlargeSource: Calculations based on UNODC opium surveys and responses to the annual report questionnaire.
Note: A conversion ratio of 10 kg of opium for 1 kg of morphine or heroin was used. Estimates for 2015 are preliminary; seizure data from 2014 were used as a proxy for seizures in 2015, and consumption esti-mates for 2014 were used as a proxy for consumption in 2015.
While the amount of opiates available for consumption, expressed in opium equivalent (calculated on the basis of opium production from which seizures of opiates were deducted), showed strong annual fluctuations (declining by more than 75 per cent in one year and increasing four-fold in the next year), changes in the number of opiate users were far less marked over the period 1998-2014. The number of opiate users seems to follow the long-term linear trend of opiates available for consumption rather than the annual increases and decreases in the amount of opium available. How can that be explained?
One hypothesis is that the number of drug users changes in line with the year-on-year availability of opium, but those changes are not reflected in estimates of the number of opiate users because of limitations in the data. Another hypothesis is that the likely number of opiate users may be correct but per capita use changes in line with availability. The third hypothesis is that stockpiling of inventories smoothes year-on-year variations in production. While the first two hypotheses basically assume that the consumption of opiates reacts to year-on-year changes in supply, the third hypothesis suggests that the short-term adjustments are in the form of changes in inventories held along the supply chain.
Hypothesis 1. The number of opiate users changes regularly in line with the availability of opium
There are important margins of error around the estimates of opiate users, which do not exclude the possibility that some adjustments to short-term supply changes may take place but remain unnoticed in estimates of opiate users. UNODC estimates are based on a limited number of reporting countries, most of them in Europe, the Americas and Oceania, with very poor reporting in Africa and only limited reporting in Asia. This is a problem, as only indirect indicators (such as registered drug users or law enforcement data) are available, while there are no regularly monitored prevalence data for some of the potentially large opiate markets in countries in Asia (notably China and India). Prevalence rates for most emerging opiate markets in Africa do not exist, and estimates are based on extrapolations from only a few countries.
FIG. 38 Global trends in the number of past-year opiate users and the heroin and opium use perception indices, 1998-2014
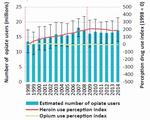
Click to enlargeSource: World Drug Report, 2000-2016; UNODC, Global Illicit Drug Trends, 2001-2003; and responses to the annual report questionnaire.
Note: The uncertainty intervals for the estimated number of opiate users were calculated by UNODC for the period 2007-2014; for data prior to 2007, the average value of the uncertainty intervals found over the period 2007-2014 was used as a proxy. For more details of perception indices, see the online methodology section of the present report.
However, a distinction should be made between data limitations concerning the ability to peg the level correctly (which is an issue) and limitations concerning the ability to detect short-term trends in consumption. Increases in supply could prompt traffickers to expand the opiate market, selling opiates to new groups of users in new markets, although such a development would probably be reflected in opiate seizures. It is even more difficult to imagine, given the highly addictive nature of opiates, that millions of users would give up consuming opiates within a year if the supply were to be reduced — and that none of this would be noticed.
UNODC also received data on perceived trends from a far larger number of countries over the period 1998-2014. Transforming the answers into a simple index |153| reveals a largely stable level of opium use over the period 1998-2014 and suggests that after some initial increases over the period 1998-2008, heroin use may have stabilized over the period 2009-2014. Moreover, these data do not indicate any sharp upward or downward year-on-year move-ment and are broadly in line with estimates of opiate use (and trends in heroin seizures).
Hypothesis 2. Opiate users react to changes in supply by increasing or decreasing per capita consumption levels
Opiate users may adjust their consumption patterns to the amounts available. Opiates available for consumption rose by an annual increase of more than 30 per cent six times over the period 1998-2015, and by more than 50 per cent four times. Increases of such magnitude in supply would most likely have resulted in strong increases in opiate purity levels and, as a consequence, in increasing drug-related deaths in specific years, but there is no evidence of this. Even taking into consideration that the capacity of the human body to adjust may be rather strong, dramatic increases in opiate consumption would still lead to an increase in drug-related deaths.
Similarly, massive declines in per capita opiate consumption would have been noticed. On four occasions, the amount of opiates available for consumption fell by more than 30 per cent compared with the previous year. It could be argued that in many developed countries substitution treatment therapy could result in a shift from using illegal heroin to using legally available opioids. However, such short-term shifts into substitution treatment would probably have been recorded. Moreover, once they are in substitution treatment, the majority of clients do not quickly shift back to using heroin once heroin becomes available again. In addition, there have not been reports from key consumer countries of any drastic year-on-year changes in heroin prices or purity levels in recent years that could have prompted such reaction patterns. Similarly, heroin seizures, which should reflect such changes, followed a rather smooth trend over the period 1998-2014.
Hypothesis 3. Inventory levels buffer fluctuating supply from one-year shifts in opium production
FIG. 39 Illicit opium production compared with the quantity of heroin seized in the following year, 1998-2015
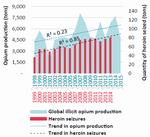
Click to enlargeSource: UNODC opium surveys in key opium-producing countries; and responses to the annual report questionnaire.
Note: Standard deviation of changes on a year earlier over the period 1998-2014: Opium production: 0.53: Heroin seizures: 0.14.
Finally, there is the possibility that not all of the opium produced in a given year is actually consumed and that inventories change accordingly. Such inventories are common in all types of trade, with stored wholesale material used to top up irregular supply to help satisfy stable demand. In addition, opium is known to store well for several years and opium stocks may be accumulated as a financial reserve and for speculation purposes. |154|
Several UNODC and World Bank studies have indicated the existence of opium inventories in Afghanistan, and a number of opium price changes in Afghanistan since 1998 can only be explained once such inventories have been considered. |155| Their existence became most obvious in 2001, when an opium ban was enforced in Taliban-controlled territory, resulting in a massive decline in opium production in Afghanistan and a decline of 65 per cent in global opium production. Global consumption, however, did not decline by such a large percentage and the total quantity of heroin seized worldwide did not decrease. Even a year later, in 2002, heroin seizures declined by only 11 per cent before recovering again in 2003. All of this can only be explained by the previous build-up of large opium stocks in Afghanistan that were subsequently used to guarantee the supply of heroin to the consumer markets. Thus, heroin seizures do not change much from year to year, even though global opium production is highly volatile.
There is a rather strong correlation between the quantity of heroin seized and the number of opiate users (r = 0.82 over the period 1998-2014), suggesting a common underlying factor (supply). There is also a positive correlation between the production of opium and the quantity of opium seized (r = 0.63). The correlation between opium production and heroin seizures, however, is weak (r = 0.45), although it improves once opium production is correlated with heroin seizures made the following year (r = 0.59), which tallies with reports that it often takes a year (or more) until opium, transformed into heroin, reaches the main consumer markets. There is, however, a strong correlation between a four-year average of opium production and the quantity of heroin seized a year later (r = 0.81).
All of this suggests that there may be a constant supply of heroin reaching the market, irrespective of the opium harvest in a given year. Given the durability of opium, which lasts several years, it is possible that most inventories are in the form of opium, rather than morphine or heroin. Large individual seizures of opium, rather than of heroin or morphine, also point in that direction.
FIG. 40 Model of opiates available for consumption, opiate consumption and changes in inventories, 1998-2015
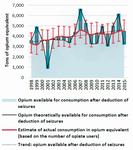
Click to enlargeSource: Calculations based on UNODC opium surveys and responses to the annual report questionnaire.
Note: A conversion ratio of 10 kg of opium for 1 kg of morphine or heroin was used. Estimates for 2015 are preliminary; seizure data from 2014 were used as a proxy for seizures in 2015, and consumption esti-mates for 2014 were used as a proxy for consumption in 2015. For details of the calculation methods, see the online methodology section of the present report.
Differences in opium available for consumption, in the model represented in figure 40, suggest either a build-up or a depletion of inventories in specific years.
Holding such quantities in inventory would seem to be feasible because opium is so compact. Its volume and weight are relatively small compared with those of conventional goods. Global opium production amounted to, on average, some 5,800 tons per year over the period 2009-2015 (range: 4,730-7,720 tons). This is equivalent to an average of 233 containers (range: 189-309 containers), given that a 20-foot dry general-purpose container has a capacity of around 25 tons. As the largest modern container ships can hold more than 19,000 containers, storing all the opium produced in the world in a single year would require only 1.2 per cent of the capacity of one such ship (1.0-1.6 per cent in the period 2009-2015).
Inventories need not be held by one individual or organization; they can be dispersed among a large number of players, including opium poppy growers, laboratory owners, small-, medium- and large-scale opium traffickers (both in and outside the opium-producing countries) or local warlords. There is no recent information about possible inventories about opium in Afghanistan. However, a UNODC and World Bank study in 2005 suggested that, when they had inventories, opium poppy growers (of whom there are several hundred thousand in Afghanistan) typically held in stock 2-10 kg of opium as a financial reserve, accumulated over several years. The study also suggested that some 40 per cent of opium purchases were kept as inventory for sale until the next harvest and that large-scale traffickers, purchasing 2 tons of opium per year, may have built up a total long-term stock of opium of at least 1 ton over the previous 4-5 years. |156|
Strong decline in opium production in 2015 is unlikely to lead to major shortages in the global heroin market
It is likely that none of the three hypotheses of reaction patterns to changes in opium supply can be completely refuted. Indeed, these hypothesis are in no way mutually exclusive. All three hypotheses may help to explain how the market reacts to changes in supply. There can be adaptions to changes in supply by changes in the number of opiate users, by increases or decreases in per capita consumption and by building up or depleting inventories.
The massive decline in opium production of almost 40 per cent in 2015 is unlikely, however, to result in a decline of the same magnitude within a year in either the global number of opiate users or the average per capita consumption of opiates. It seems more likely that inventories of opiates, built up in previous years, will be used to guarantee the manufacture of heroin (some 450 tons of heroin per year would be needed to cater for annual consumption) and that only a period of sustained decline in opium production could have any real effect on the global heroin market.
Key figures
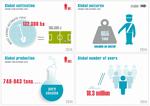
Click to enlargeNote: Cocaine seizures are mostly of cocaine hydrochloride (of varying purity), but also include other cocaine products (paste, base and "crack").
Cocaine market developments
Strong decline in coca bush cultivation since 1998
Although global coca bush cultivation in 2014 increased by 10 per cent compared with the previous year, the total area under coca bush cultivation worldwide, 132,300 ha, was the second smallest since the late 1980s. Global coca bush cultivation in 2014 was 19 per cent lower than in 2009, 40 per cent lower than the peak level in 2000 and 31 per cent lower than in 1998. |157|
FIG. 41 Global coca bush cultivation and cocaine production, 1998-2014
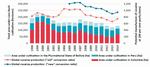
Click to enlargeSource: UNODC coca bush cultivation surveys in Bolivia (Plurinational State of), Colombia and Peru conducted in 2014 and in previous years.
Note: See box on cocaine conversion ratios in the section entitled "Extent of drug supply" (p. 21).
Of the three main countries cultivating coca bush, Colombia has shown the strongest decrease in the total area under coca bush cultivation (-58 per cent) since the peak of 2000; that decline was initially related to widespread aerial spraying, followed by manual eradication and, after 2007, by increased alternative development efforts. However, 2014 saw a strong increase (of 44 per cent) in the total area under coca bush cultivation in Colombia, price increase and expectations among farmers that they might benefit more from alternative development if they were growing coca bush during the peace negotiations. |158| There are also indications that the new upward trend in coca bush cultivation in Colombia continued into 2015. In 2014, the total area under coca bush cultivation in Colombia amounted to 69,000 ha, accounting for 52 per cent of global coca bush cultivation.
Linked to the interruption of the so-called "air bridge", which transported coca paste or base from growing areas in Peru to cocaine-processing laboratories in Colombia, and thus falling coca prices, coca bush cultivation in Peru declined in the 1990s. Coca bush cultivation in Peru, however, rose by 44 per cent between 2000 and 2011, as the use of the "air bridge" strategy was brought to an end and coca prices subsequently increased. Over the period 2011-2014, the total area under coca bush cultivation in Peru decreased once more (by 31 per cent). It is now, at 42,900 ha (accounting for 32 per cent of global coca bush cultivation), back to its 2000 level. The latest decrease can be linked to achievements in alternative development, as well as intensified eradication efforts.
FIG. 42 Global cocaine interception rates, 1980-2014

Click to enlargeSource: UNODC coca bush cultivation surveys, responses to the annual report questionnaire and government reports.
Note: For details of the calculation methods see the online methodology section of the present report.
In the Plurinational State of Bolivia, the total area under coca bush cultivation decreased in the late 1990s as a result of increased government interventions, including in the form of alternative development (Plan Dignidad), which was able to count on strong external assistance. However, the total area under cultivation doubled between 2000 and 2010 before falling again (by 34 per cent) in the period 2010-2014. The latest decline was linked to alternative development efforts (done with very limited external assistance) |159| as well as strong social pressure placed on coca bush growers by the authorities and unions to limit coca bush cultivation to 1 cato (0.16 ha) per family. The total area under coca bush cultivation in the country in 2014 (20,400 ha, or 15 per cent of the world total) was less than half the total area under such cultivation in the period 1990-1997, but still 40 per cent larger than in 2000.
Global production of cocaine (expressed at a purity of 100 per cent) can be estimated for 2014 at 746 tons (using the "old" conversion ratio) and 943 tons (using the "new" conversion ratio); those values are slightly higher than in the previous year but still 24-27 per cent lower than the peak in 2007, and thus back to the levels reported in the late 1990s. There are, however, indications that the overall upward trend observed in 2014 continued into 2015.
Data suggest that the global cocaine interception rate, based on cocaine production estimates and quantities of cocaine seized, reached a level of between 43 and 68 per cent in 2014.
Most of the increases in the global cocaine interception rate occurred after 1998, when the General Assembly held its twentieth special session, dedicated to countering the world drug problem together. The global cocaine interception rate almost doubled between the periods 1990-1997 and 2009-2014.
FIG. 43 Quantities of cocaine seized, by region, 1998-2014

Click to enlargeSource: Responses to the annual report questionnaire.
Note: The seized forms of cocaine included cocaine hydrochloride, coca paste and base and "crack" cocaine, and the quantities seized were not adjusted for purity.
Cocaine continues to be trafficked primarily from South America to North America and Western and Central Europe
A total of 153 countries reported cocaine seizures over the period 2009-2014. Most of the cocaine trafficking, however, continues to be from the Andean subregion to North America and Europe. The bulk of the cocaine seizures in 2014 occurred in the Americas, which accounted for 90 per cent of global cocaine seizures (in particular, in South America (60 per cent)). Cocaine seizures in Western and Central Europe accounted for 9 per cent of global cocaine seizures.
Stabilization of cocaine trafficking in South America
The total quantity of cocaine seized more than doubled in South America over the period 1998-2014 (reaching 392 tons in 2014), although recent data suggest a levelling off. In the period 2009-2014, Colombia accounted for 56 per cent of all the cocaine seizures in South America (and more than a third of global cocaine seizures); it was followed by Ecuador (accounting for 10 per cent of total cocaine seizures in South America), Brazil (about 7 per cent), the Plurinational State of Bolivia (about 7 per cent), Peru (about 7 per cent) and the Bolivarian Republic of Venezuela (6 per cent). The increase in cocaine seizures between the periods 1998-2008 and 2009-2014 was particularly pronounced in Ecuador, where the increase was linked to intensified law enforcement activity. In Brazil, the increase in the quantity of cocaine seized was attributable to a combination of improved law enforcement efforts, the growing domestic market for cocaine and increasing cocaine shipments to overseas markets.
FIG. 44 Quantities of cocaine seized in North America and prevalence of past-year cocaine use in Canada and the United States, 2002-2014

Click to enlargeSource: Responses to the annual report questionnaire, the United States National Household Survey on Drug Use and Health and the Canadian Alcohol and Drug Use Monitoring Survey.
Note: Data for 2002 have been used as baseline data, as the United States National Household Survey changed its methodology several times between 1998 and 2002.
North American cocaine largely stable after a decline in recent years
North America has been the world's largest cocaine market for years. Given the falling cocaine production in Colombia and the increased violence linked to the drug cartels in Mexico, |160| the supply of cocaine to Canada and the United States has declined. That has raised the purity-adjusted price of cocaine and prompted a decline in consumption. In the United States, the prevalence of past-year cocaine use among the general population fell by 32 per cent between 2006 and 2014, while cocaine-related deaths decreased by 34 per cent between 2006 and 2013 (the latest year for which data are available), treatment admissions related to cocaine use fell by 54 per cent between 2006 and 2012 (the latest year for which data are available) |161| and a decrease was also reported in cocaine-positive urine tests among the general workforce, by 66 per cent over the period 2006-2014. Cocaine seizures in North America fell by some 50 per cent, to 100 tons, in the same period.
The largest cocaine seizures in North America over the period 2009-2014 were reported by the United States (accounting for 90 per cent of the seizures in North America), Mexico (8 per cent) and Canada (2 per cent). The United States accounted for 15 per cent of global cocaine seizures over the period 2009-2014 and was second only to Colombia.
According to the Cocaine Signature Program of DEA, |162| more than 90 per cent of the cocaine trafficked to North America originates in Colombia. Cocaine is often smuggled by boat or semi-submersible directly to Mexico or via Central America to Mexico and then by land to the United States and Canada. Organized criminal groups based in Mexico continue to dominate the transportation of cocaine across the border into the United States, as well as the large-scale transportation of cocaine in the United States, supplying local organized criminal groups. Although the volume of cocaine has been declining, United States estimates for 2014 suggest that 87 per cent of the cocaine continues to be transported through the Central American-Mexican corridor, while around 13 per cent of the cocaine reaching the United States passes through the Caribbean subregion, primarily via the Dominican Republic and Puerto Rico. |163|
European cocaine market is now stagnating
FIG. 45 Quantities of cocaine seized in Europe and prevalence of past-year cocaine use in European Union member States, 1998-2014
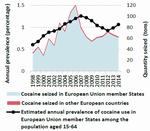
Click to enlargeSource: Responses to the annual report questionaire and data from EMCDDA.
In line with reports of massive increases in the European cocaine market, cocaine seizures in Europe quadrupled between 1998 and 2006, reaching some 120 tons, before falling to 62 tons in 2014. Member States of the European Union accounted for 98 per cent of the total amount of cocaine intercepted in Europe over the period 2009-2014.
The prevalence of cocaine use in the European Union member States appears to have declined from a peak in 2007 and is now rather stable, at a level of about 1 per cent of the population aged 15-64. However, this masks trends and patterns at the subregional and national levels; in particular, prevalence of cocaine use tends to be above average in several Western European countries and lower in the rest of Europe, and several countries with high prevalence of cocaine use showed a decrease while some smaller countries with low prevalence showed an increase.
FIG. 46 Benzoylecgonine (a cocaine metabolite) found in wastewater in 67 European cities: averages and ranges, 2011-2014
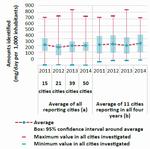
Click to enlargeSource: Sewage Analysis CORe group Europe (SCORE).
Note: (a) The cities were in the following countries: Belgium, Bosnia and Herzegovina, Croatia, Cyprus, Czech Republic, Denmark, Finland, France, Germany, Greece, Italy, Netherlands, Norway, Portugal, Serbia, Slovakia, Spain, Sweden, Switzerland and the United Kingdom. The analysis in each city was based on the amounts of benzoylecgonine identified in the wastewater over a 7-day period and was weighted by the population of the wastewater catchment area. (b) The population-weighted average of 11 cities reporting each year in the wastewater catchment area were located in Belgium, Croatia, France, Italy, Netherlands, Norway and Spain were located.
Analysis of benzoylecgonine, a cocaine metabolite, in waste-water, based on information from 67 cities located in 20 countries in Western, Central and South-Eastern Europe, indicates marked differences across cities in terms of cocaine consumption and trends, but also indicates overall stable cocaine consumption levels over the period 2011-2014. |164|
Of the main coca-producing countries, the main country of origin or departure for cocaine shipments to Europe continues to be Colombia (mentioned in 42 per cent of responses by European countries in the annual report questionnaire over the period 2009-2014), followed Peru (31 per cent) and the Plurinational State of Bolivia. The importance of Colombian cocaine in Europe, however, has been declining compared with the situation during the period 1998-2008.
The most frequently mentioned non-European countries of departure for cocaine shipments over the period 2009-2014 were Brazil, followed by Colombia, Ecuador, the Dominican Republic, Argentina and Costa Rica. Countries in Africa (mostly in West Africa) were mentioned as non-European transit countries in 10 per cent of responses to the annual report questionnaire over the period 2009-2014. The main points of entry in Europe were the countries of the Iberian peninsula, notably Spain, followed by the Netherlands and Belgium.
Cocaine trafficking via Africa may be regaining importance
Cocaine seizures in Africa increased from 0.8 ton in 1998 to 5.5 tons in 2007, reflecting the rapidly growing importance of West Africa as a transit area. In 2014, cocaine seizures in Africa fell to 1.9 tons. Given the limited law enforcement capacity, the decline in seizures in 2014 does not necessarily reflect a decline in cocaine trafficking in Africa, though the decline went in parallel with fewer reports from Europe indicating that Africa had been used as a transit area. In the meantime, the situation may have changed again: over the period December 2014-March 2016, at least 22 tons of cocaine were seized en route from South America via West Africa to Europe, although most of those seizures took place outside Africa. |165|
Over the period 2009-2014, the proportion of the total cocaine seizures in Africa accounted for by West Africa rose to 78 per cent; North Africa accounted for 11 per cent of the cocaine seizures made in Africa. The largest quantity of cocaine seized was reported by Cabo Verde, followed by the Gambia, Nigeria and Ghana.
Africa is often supplied with cocaine departing from Brazil (accounting for 51 per cent of all mentions of South American countries in responses to the annual report questionnaire by African countries over the period 2009-2014), Colombia (18 per cent), Peru (13 per cent) and Chile (9 per cent). The African country most frequently mentioned (by other African countries) as countries of departure or transit countries for shipments of cocaine within Africa was Nigeria, followed by Ghana, Mali and Guinea.
FIG. 47 Global cocaine production and seizures, 1998-2014
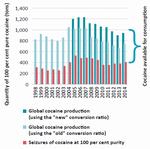
Click to enlargeSource: UNODC coca bush cultivation surveys conducted in Bolivia (Plurinational State of), Colombia and Peru in 2014 and in previous years.
Note: As production is shown in pure cocaine equivalent, reported seizures have been purity-adjusted. Individual seizures reported to UNODC indicate that more than 99 per cent of the seized cocaine (measured in terms of quantity) was intercepted at the wholesale level. The seizures were therefore adjusted to the purity level at wholesale and expressed in quantities of pure cocaine.
The main countries of final destination for cocaine trafficked to Africa are in Europe (accounting for 58 per cent of all mentions; notably Italy, Spain, France, the United Kingdom and the Netherlands), Africa (26 per cent), North America (notably the United States (12 per cent)) and Asia (3 per cent, notably China and Malaysia). Most of the cocaine shipments transiting Africa left the region by air. In recent years, of the cocaine shipments leaving Nigeria for other countries, 50-70 per cent left the country by air, 20 per cent left the country on roads leading to neighbouring countries and 5 per cent left the country by boat; this is in contrast to reports that, of the cocaine shipments leaving Ghana, 61 per cent left the country by boat and 39 per cent by air.
Signs of increased smuggling of cocaine to Asia
Cocaine seizures in Asia tripled from an average of 0.4 ton over the period 1998-2008 to 1.5 tons per year over the period 2009-2014, in line with indications that cocaine consumption among the upper classes in several of the more developed Asian countries has started to rise.
Most of the cocaine seizures in Asia over the period 2009-2014 were made in East and South-East Asia (59 per cent) and in the Middle East (39 per cent). In 2014, however, the share of cocaine seizures in the Middle East rose to 49 per cent.
The most frequently mentioned Latin American countries of origin, departure and transit for cocaine shipments to Asia in the period 2009-2014 were Brazil, followed by Colombia, Peru, the Plurinational State of Bolivia, Argentina and Mexico. The African countries used as trans-shipment areas were mainly Nigeria and South Africa, and the countries of departure and transit countries in Asia were mostly in the Middle East (United Arab Emirates, followed by Jordan and Lebanon) and in South Asia and South-East Asia (Thailand, followed by Malaysia, Philippines and India). The most frequently mentioned final destination in Asia was Israel, followed by China.
Rapid growth in the cocaine market in Oceania over the past decade
Cocaine seizures in Oceania more than doubled, from an annual average of 0.5 ton over the period 1998-2008 to 1.2 tons over the period 2009-2014, with Australia accounting for 99 per cent of total cocaine seizures in the region from 1998 to 2014. The increase is in line with reports of rapidly growing prevalence of cocaine use: the prevalence of past-year cocaine use among the general population (aged 14 and older) in Australia doubled from 1 per cent in 2004 to 2.1 per cent in 2010 and remained stable at this level in 2013.
Is the global cocaine market shrinking?
FIG. 48 Cocaine available for consumption, 1998-2014
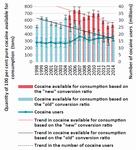
Click to enlargeSource: UNODC coca bush cultivation surveys conducted in 2014 and in previous years, responses to the annual report questionnaire and government reports.
Estimated global coca bush cultivation fell by more than 30 per cent over the period 1998-2014 — by 40 per cent after 2000, when it reached its peak. The decline was far less pronounced in the case of estimated cocaine production, reflecting improvements in yields and in laboratory efficiency in the Andean subregion. Cocaine production decreased by 10 per cent between 1998 and 2014, according to calculations based on the "old" conversion ratio (available for both years), but comparison of the estimates based on the "new" conversion ratio for 2014 with the 1998 estimate (based on the assumption that the "old" conversion ratio may have still been correct in 1998) indicates a small increase in cocaine production (some 14 per cent between 1998 and 2014).
The deduction of purity-adjusted seizures from cocaine production shows a reduction in cocaine available for consumption over time, irrespective of whether estimates are based on the "old" or the "new" cocaine conversion ratio.
At the same time, global prevalence of past-year cocaine use among the population aged 15-64 remained largely stable over the period 1998-2014, fluctuating between 0.3 and 0.4 per cent, while the number of cocaine users increased (by 30 per cent) from some 14 million in 1998 to 18.3 million in 2014. The increase in the number of cocaine users is attributable to population growth.
The fact that the quantities of cocaine available for consumption declined over the period 1998-2014 while there was an increase in the number of cocaine users (30 per cent) over the same period (the number of users was largely stable over the period 2007-2014) seems somewhat contradictory. Three different hypotheses may help to explain this development.
FIG. 49 Global trends in the number of past-year cocaine users and the cocaine use perception index, 1998-2014
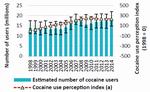
Click to enlargeSource: World Drug Report, 2000-2016; UNODC, Global Illicit Drug Trends, 2001-2003; and responses to the annual report questionnaire.
Note: For more details of perception indices, see the online methodology section of the present report.
Hypothesis 1. No increase in the number of cocaine users
One hypothesis could be that the number of cocaine users did not actually increase over the period 1998-2014 and that the number may have even declined between 2007 and 2014. The margins of error around the prevalence estimates are large, mainly reflecting the lack of reliable information for Africa and Asia; thus, the possibility that there was no increase in the number of cocaine users over the period 1998-2014 cannot be totally excluded. However, this hypothesis is not supported by data on perceived drug use reported by Member States, which indicate a clear upward trend in cocaine use (including in Africa and Asia), particularly between 1998 and 2008, followed by a period of stabilization or slight decline since 2009.
TABLE 2 Per capita consumption of pure cocaine among people who use cocaine, 1998, 2007 and 2014
Year Amount of cocaine available for consumption (tons) Number of (annual) cocaine users (millions) Average number of pure grams of cocaine consumed per user per year 1998 512 14.0 36.6 2007 747 18.2 41.0 2014 537 18.8 28.6 Source: UNODC calculations based on information provided by Member States.
Hypothesis 2. Decline in per capita consumption among cocaine users (shifting from mature to new markets)
Another hypothesis is that the cocaine users' per capita consumption may have decreased, with a number of indicators seeming to be consistent with this hypothesis.
There seems to have been a shift in the composition of the cocaine user population, towards an increase in the number of occasional users relative to the number of high-frequency or dependent users as a consequence of a geographical shift.
Based on the amount of cocaine available for consumption and the number of cocaine users, table 2 suggests that the mean amount consumed per cocaine user may have increased over the period 1998-2007, from 37 to 41 grams per user, before decreasing to 29 grams per user by 2014. |166|
Such changes in per capita consumption may have occurred, as cocaine use has declined in established markets, where per capita consumption was high, and increased in new markets, where per capita consumption is still low, as the cocaine epidemic in the new markets is still at an early stage.
FIG. 50 Number of past-year cocaine users, by region, 1998-2014
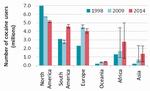
Click to enlargeSource: World Drug Report, various years.
The number of cocaine users showed a marked decline in North America and less significant decreases in Europe over the period 2007-2014. Increases in cocaine use, by contrast, could be found in emerging markets in South America, notably between 2009 and 2014, as well as in Oceania and, most probably, in Africa and Asia (although the quantitative evidence is weak for these two regions).
A UNODC analysis on the retail and wholesale value of the illicit drug market, based on data for the period 2002-2003, |167| suggested that per capita consumption of cocaine in North America (44 grams per user) was above the global average (37 grams per user). In the other regions, where per capita consumption was below the global average, cocaine use had been increasing. This suggests that heavy cocaine consumption was concentrated in North America, which was indirectly confirmed by a comparatively high proportion of people using cocaine in the United States being treated for cocaine use and a higher proportion of people using cocaine dying from cocaine use. This is of importance as — in parallel — indicators for North America showed that not only recreational use of cocaine but also heavy use had fallen strongly over the past decade. Estimates for the United States suggested that the number of "chronic cocaine users", defined as users who consumed cocaine four or more days in the past month, had fallen by 22 per cent over the period 2006-2010 |168| (i.e. almost as much as the overall number of past-year cocaine users during that period) and there were no indications of any reversal of that development in subsequent years. |169|
FIG. 51 Distribution of cocaine consumption in the United States, 2010
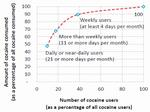
Click to enlargeSource: UNODC calculations based on ONDCP, What America's Users Spend on Illegal Drugs: 2000-2010, February 2014.
Heavy cocaine users, although they account for only a small proportion of the total number of users, are responsible for the bulk of cocaine consumed. Earlier analysis of the United States cocaine market suggested that cocaine use typically followed a Pareto distribution, with one quarter of cocaine users being responsible for two thirds of cocaine consumption. |170| A recent update |171| indicated that more than weekly consumers of cocaine (18 per cent of all cocaine users in 2010) accounted for two thirds of total cocaine consumption in the United States in 2010.
Reducing the number of heavy cocaine users can thus effectively reduce the cocaine market. A recent study in the United States showed that cocaine consumption and spending on cocaine fell by 50 per cent between 2000 and 2010 (mostly between 2006 and 2010). The reduction in spending among a small group of high-frequency cocaine users ("more than weekly" users) accounted for around 75 per cent of the aggregate reduction in spending and thus in cocaine consumption over the period 2000-2010. |172| The change in the United States is likely to have affected the size of the global cocaine market, and thus the global per capita consumption level.
Hypothesis 3. Supply-side estimates are incorrect
The possibility that cocaine production estimates may have been incorrect cannot be excluded. There are, indeed, knowledge gaps when it comes to cocaine production estimates and this has long been recognized by UNODC. While there can be discussions about the "correct" estimates of total amounts of cocaine produced, it seems unlikely that there was any strong increase in cocaine production over the period 1998-2014. First, it is unlikely that any new coca-producing countries, apart from those in the Andean subregion, have emerged in the past two decades; and if they had, such a development would not have remained completely unnoticed. Secondly, the total area under coca bush cultivation in the Andean subregion has decreased in size (by over 30 per cent), as shown by scientifically validated remote-sensing surveys. Even though there have been changes in yields and increases in laboratory efficiency, it is unlikely that total cocaine production increased by over 30 per cent (corresponding to the increase in the number of cocaine users).
A shrinking global cocaine market should not lead to complacency
Having analysed all three hypotheses, the most likely is that the global cocaine market has indeed been shrinking, prompted by a decline both in cocaine available for consumption, mainly linked to a decrease in cocaine production in the Andean subregion, and in cocaine consumption in North America and, to some extent, in Europe. Assuming that, as suggested by estimates of the prevalence of cocaine use, the number of cocaine users has not declined, less cocaine is consumed on an average per capita basis today than in previous years.
The net result of this, in the short term, should be positive in terms of reducing drug-related crime and the negative health impact, as heavy cocaine users account for most of the harm arising from cocaine use. However, with a larger number of people worldwide experimenting with cocaine, particularly in developing countries, a certain proportion of them may eventually develop into heavy cocaine users, as can already be seen by the patterns emerging in some countries. As many of the countries in which cocaine consumption is now emerging do not have the health and social infrastructure to deal with such problems, a shrinking global cocaine market should definitely not lead to complacency. Moreover, the overall downward trend in global cocaine production may have come to an end, exacerbating the vulnerability of numerous developing countries.
Key figures

Click to enlargeCannabis market developments
Cannabis continues to be the most widely cultivated, produced, trafficked and consumed drug worldwide
Cannabis plant cultivation — either through direct indicators (cultivation or eradication of cannabis plants) or indirect indicators (seizures of cannabis plants, domestic cannabis production being indicated as the source of seizures, etc.) — was reported on the territory of 129 countries over the period 2009-2014. Given the absence of systematic measurements, however, the extent and trends in cannabis cultivation and production are difficult to assess. Most indirect indicators come from law enforcement authorities and, to a certain extent, reflect their priorities and activities |173| and not simply the existence of cannabis cultivation and production. Since 1998, the total area of eradicated cannabis plants (in hectares), though it has fluctuated, has actually decreased, as have seizures of cannabis plants. These trends contrast with seizures of cannabis herb and cannabis resin, which, after a twofold increase over the period 1998-2004, have remained largely stable.
Reports from Member States on source countries for cannabis resin during the period 2009-2014 suggest that the world's largest producer of cannabis resin continues to be Morocco, followed by Afghanistan and, to a lesser extent, Lebanon, India and Pakistan. Using as a basis cannabis seizures (which reflect law enforcement activity, as well as cannabis production), the size of local cannabis markets (derived from the number of users) and information on the sources of the cannabis consumed, it can be assumed that most of the world's production of cannabis herb takes place in North America. In North America, cannabis herb is mainly produced in Mexico and the United States, for consumption in the subregion, while hydroponic cultivation of cannabis plants seems to be concentrated in Canada and the United States. Reports by Member States over the period 2009-2014 indicate that Albania, Colombia, Jamaica, the Netherlands and Paraguay are important source countries of the cannabis herb sold in international markets.
FIG. 52 Quantities of cannabis herb seized, by region, 1998-2014
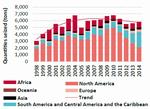
Click to enlargeSource: Responses to the annual report questionnaire and government reports.
The Americas, followed by Africa, remain the main markets for cannabis herb
In 2014, the Americas accounted for about three quarters of all the cannabis herb seized worldwide, Africa accounted for 14 per cent and Europe accounted for 6 per cent. At the subregional level, the largest amount of cannabis herb was seized in North America (accounting for 37 per cent of global seizures of cannabis herb in 2014), South America (24 per cent) and the Caribbean (13 per cent). Despite an increase in cannabis use, the quantity of cannabis herb intercepted in North America, after reaching a peak in 2010, has been declining, reflecting the fact that a decrease in cannabis production has been reported in Mexico and that cannabis interdiction may have become less of a priority in the United States since the decriminalization and legalization of recreational use of cannabis in some of the states in that country. Nonetheless, the quantity of cannabis herb seized in other parts of the world, particularly in South America, the Caribbean and Africa, is actually on the increase.
Europe, North Africa and the Near and Middle East remain the main markets for cannabis resin
FIG. 53 Quantities of cannabis resin seized, by region,1998-2014
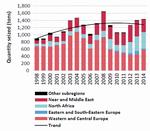
Click to enlargeSource: Responses to the annual report questionnaire and on government reports.
The subregion in which the largest amount of cannabis resin was seized in 2014 was again Western and Central Europe, accounting for 40 per cent of the global seizures of cannabis resin (Spain alone accounted for 26 per cent of the world total); 32 per cent of the world total was accounted for by countries in North Africa (mainly Morocco and Algeria) and 25 per cent was accounted for by countries in the Near and Middle East (mainly Pakistan, followed by the Islamic Republic of Iran and Afghanistan). The proportion of global quantities of seized cannabis resin accounted for by Europe declined from 77 per cent of the world total in 1998 to 48 per cent in 2009 and 43 per cent in 2014, which reflects the decrease in the share of cannabis resin in the European cannabis market, where cannabis herb from domestic production has gained in popularity.
As in previous years, cannabis resin from Morocco was mainly smuggled to Europe and other countries in North Africa, while cannabis resin produced in Afghanistan continued to be smuggled to neighbouring countries, particularly Pakistan and the Islamic Republic of Iran. In the Near East, cannabis resin produced in Lebanon is used to supply other markets in the subregion.
FIG. 54 Global trends in the number of past-year users of cannabis and the cannabis use perception index, 1998-2014
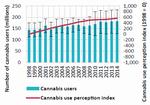
Click to enlargeSource: World Drug Report, 2000-2016; UNODC, Global Illicit Drug Trends, 2001-2003; and responses to the annual report questionnaire.
Note: The uncertainty intervals were calculated by UNODC for the period 2007-2014; for data prior to 2007, the three-year average of the uncertainty intervals found over the period 2007-2009 was used as a proxy. For more details of perception indices, see the online methodology section of the present report..
FIG. 55 Prevalence of past-year cannabis use in Australia, the United States and the European Union, 1970-2014
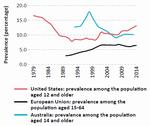
Click to enlargeSource: Responses to the annual report questionnaire and data from EMCDDA.
Despite major changes in some regions, global cannabis consumption has remained rather stable in recent years
About 3.8 per cent of the global population used cannabis in 2014. A proportion that has been somewhat stable since 1998, this means that cannabis was used by an estimated 183 million people (range: from 128 million to 234 million people) in 2014. A figure about 27 per cent higher than in 1998, this reflects the growth in the global population over the period 1998-2014. Given the large margin of error, caution needs to be applied when considering this figure; however, analysis of the perception of changes in use, as reported by Member States, shows a similar pattern, indicating that the use of cannabis increased until 2009, only to grow less rapidly thereafter.
Oceania is the only region in which a marked decline in cannabis use, from comparatively high levels, has been noted since 1998, which is mainly a reflection of a reduction in cannabis consumption in Australia. In Europe, following a twofold increase from the early 1990s onwards, a temporary decline in cannabis use was seen after 2009, until cannabis use increased again in 2013 and 2014, returning to the level reported in 2009. |174|
Since 2009, cannabis consumption has been rising in the Americas. Although the United States continues to be the largest market for cannabis in the Americas, cannabis use is still significantly less prevalent in that country now than in the late 1970s. Increased cannabis use has also been reported in Africa, but those reports are based on limited information and caution should thus be applied when considering them.
Developments in the countries where cannabis legalization has occurred
In the past four years, four jurisdictions in the United States and Uruguay have passed laws to allow the production, distribution and sale of cannabis for non-medical purposes (i.e. for recreational use), which is contrary to the spirit of the international drug control conventions.
United States
In the United States, cannabis is federally prohibited as a substance in schedule I of the Controlled Substances Act. |175| The states of Colorado and Washington, after passing ballot initiatives in November 2012, became the first jurisdictions in the country to legalize large-scale commercial production of cannabis for recreational use by adults (persons aged 21 and older); Colorado also permitted home cultivation of cannabis. In November 2014, similar initiatives were approved by voters in the states of Alaska and Oregon. Washington, D.C., took a narrower approach by legalizing only the possession and home cultivation of cannabis.
While each of the jurisdictions legalizing cannabis had previously approved medical cannabis laws, only Colorado, Oregon and Washington, D.C., regulated commercial medical cannabis businesses. |176| Colorado restricted initial applications for recreational cannabis licences to businesses already licensed to sell medical cannabis, and the first recreational stores opened on 1 January 2014. Oregon temporarily allowed the sale of recreational cannabis through existing medical dispensaries beginning in October 2015, though licensed recreational stores are not expected to open until late 2016. The state of Washington had an extensive medical cannabis industry, including many brick-and-mortar dispensaries that operated openly, but without regulation. Alaska will not have recreational cannabis sales until licensed stores open, which is expected by late 2016. In order to develop and enforce regulations for the legal cannabis industry, each state has appointed a regulatory agency. The resulting regulatory details vary depending on the jurisdiction, including limits on the quantities that can be possessed or purchased, and market structure (for the regulatory details in each jurisdiction, see table on page xxv in the annex of the present report). |177| |178|
Uruguay
Uruguay announced in mid-2012 that it would permit the production and distribution of cannabis for recreational use by adult residents (persons aged 18 and older). Law 19.172 was enacted in December 2013, and regulations for the new industry were issued in May 2014. |179| The law and its supporting regulations permit the sale through pharmacies and non-medical use of up to 40 grams of cannabis per month for individuals registered with the Institute for the Regulation and Control of Cannabis (IRCCA).
The circumstances of legalization in Uruguay were quite different from the developments in the United States in that the legislature itself initiated the law, although with limited popular support (only a third of Uruguayans). |180| |181| There was no prior regulation for the use of cannabis for medical purposes (although the possession of cannabis was not a criminal offence), nor was there significant illicit cannabis production in Uruguay. |182|
Uruguay has created three legal channels for obtaining cannabis: home cultivation; access to social clubs; and retail pharmacies. Individuals are allowed to access only one mode of supply, which they must declare upon registering with the cannabis registry.
Nearly two years after the enactment of the law, critical parts of the distribution system have yet to be put in place. In October 2015, only two private firms were issued licences to cultivate cannabis, and to date no cannabis has been sold in pharmacies. Officials estimate that cannabis from the first harvest will not be ready for sale until mid-2016. By February 2016, about 4,300 people had registered to grow cannabis at home, and 21 cannabis clubs had been licensed. Recent surveys reveal that 40 per cent of the cannabis users in the country are hesitant to register with the system to obtain cannabis, |183| while the rest have indicated that they intend to register and obtain the drug through pharmacies. |184|
Outcomes
Although three and a half years have elapsed since the first regulations on legal cannabis went into effect in Colorado and Washington, the outcomes of the legalization of cannabis in those jurisdictions are still not fully understood and may not be for some time. Some may play out in the longer term, especially as the regulations evolve and the markets mature. In the United States, it will be particularly difficult to assess the impact of cannabis legalization, as many states have made incremental changes to their cannabis laws over the past few years that may have affected outcome trends prior to the legalization of recreational cannabis. Currently, the best data on the outcomes of cannabis legalization come from Colorado and Washington, the states that adopted cannabis legislation early. That cannot be said of the other jurisdictions in the United States (Alaska, Oregon and Washington, D.C.) or of Uruguay, which have yet to fully establish their retail systems.
FIG. 56 Prevalence of past-month cannabis use among the general population in the United States, including selected areas, and Uruguay, 2000-2014
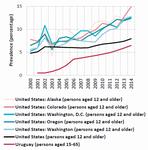
Click to enlargeSource: United States, Department of Health and Human Services, SAMHSA, National Survey on Drug Use and Health; and Uruguay, Junta Nacional de Drogas, Observatorio Uruguayo de Drogas, Encuesta Nacional sobre Consumo de Drogas en Hogares.
FIG. 57 Prevalence of past-month cannabis use among young adults in the United States, including selected areas, 2000-2014
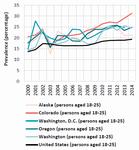
Click to enlargeSource: United States, Department of Health and Human Services, SAMHSA, National Survey on Drug Use and Health.
FIG. 58 Medical cannabis market in the State of Colorado, United States, 2014-2015
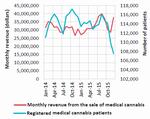
Click to enlargeSource: Colorado Department of Public Health and Environment and Colorado Department of Revenue.
Cannabis use
In the United States, the National Survey on Drug Use and Health indicated that the prevalence of past-month cannabis use among those aged 12 and older increased from around 6 per cent in the mid-2000s to 8 per cent in the period 2013-2014. However, in the jurisdictions that legalized recreational cannabis, where the prevalence of past-month cannabis use has historically been higher, past-month prevalence increased more rapidly than past-month prevalence at the national level during this period. Available data suggest that the increase in the prevalence of past-month cannabis use is driven by increased use among young adults (persons aged 18-25), which is more pronounced in Colorado, where the prevalence of past-month cannabis use increased from around 27 per cent in 2011 to 31 per cent in 2014. In Uruguay, the prevalence of cannabis use is much lower, but household surveys suggest that there was an increasing trend even before the legalization of cannabis use. Trends in cannabis use may change as the demand curve evolves in response to changes in price, availability and social norms.
Medical cannabis markets after legalization in the United States
It is unclear whether the legalization of cannabis for recreational use will have any discernible effect on the size of the medical cannabis market. The original purpose of medical cannabis laws was to provide access to cannabis for those with a qualifying medical need. Since the legalization of recreational cannabis use, individuals can now obtain cannabis without having a medical recommendation and without submitting their personal data to be entered into a state-run database. However, the recreational cannabis markets in most jurisdictions are currently higher priced (after taxes) and often have fewer retail outlets than the existing medical cannabis market. For registered or qualifying patients, the introduction of regulated recreational cannabis markets may not present an additional incentive to forego the benefits of their medical status. |185|
After the legalization of the non-medical use of cannabis, the number of patients in Colorado's mandatory medical cannabis patient registry remained fairly stable, although the number decreased in the last quarter of 2015. Furthermore, monthly medical cannabis sales have not exhibited a downward trend in the two years since legalization. Given the evolving markets and one-year duration of medical cannabis identification cards, the impact of legalization on the medical cannabis market may take much longer to become apparent in jurisdictions with both medical and recreational cannabis markets.
In Colorado, and currently in Oregon, cannabis stores have been allowed to operate simultaneously as recreational and medical cannabis stores, but in the long run it is unclear whether those systems will be separate or intertwined or whether one system will fold into the other, as in the State of Washington.
Products and potency
Cannabis potency in the United States has been increasing over the past three decades, particularly in jurisdictions that have allowed medical dispensaries. |186| Compared with the national average of 11 per cent (based on data from the period 2002-2008), |187| the average THC content of recreational cannabis herb sold in the states of Washington and Colorado is nearly 17 per cent, with some samples reaching up to 30 per cent. Data on cannabis potency are scarce in Uruguay, as authorities in that country only recently began to analyse seized cannabis, |188| but the Government has discussed limiting to 15 per cent the THC content of cannabis products sold in pharmacies. According to the authorities, this limit has been set with a view to reducing health risks caused by cannabis use.
Innovation in the commercial markets has led to the increased availability of a wide range of cannabis products, especially concentrated cannabis extract and cannabis-infused edibles, which pose additional public health concerns. In 2014, such products accounted for an estimated 35 per cent of retail sales of recreational cannabis in Colorado. |189| The high potency of extract-based concentrates such as oil, "wax" or "shatter" can have a THC content of up to 80-90 per cent; "dabbing" or vaporizing these products involves a rapid intake of large amounts of THC, making it difficult for even experienced users to determine an appropriate dosage, potentially leading to over-intoxication. With edible products, the slower onset and longer duration of intoxication could increase the risk of over-intoxication, especially for new or inexperienced users. |190|
A common approach to regulating such products has been to implement stringent packaging and labelling requirements. The four states in the United States require cannabis-infused edibles to be packaged into demarcated individual servings according to the quantity of THC: Washington and Colorado set the serving size at 10 mg of THC; and in Alaska and Oregon, draft regulations proposed a maximum of 5 mg. |191| In addition, Washington requires all cannabis-infused products to undergo, prior to approval, a process to determine if they are appealing to children, |192| and Oregon is considering a similar rule. |193|
Health consequences
FIG. 59 Cannabis exposure calls to the Washington Poison Center in the State of Washington, United States, 1998-2014
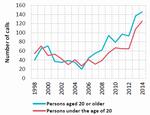
Click to enlargeSource: Washington Poison Center.
The proliferation of concentrated cannabis extract and cannabis-infused edibles in licit markets has generated concerns of accidental ingestion or over-intoxication, especially among children and inexperienced users, as those products may often resemble familiar sweets. |194| Since the legalization of recreational cannabis in the states of Colorado and Washington, incidents of accidental cannabis ingestion among young children have been increasing. In Colorado, the number of cases involving exposure to THC-infused edibles in young children increased nearly fivefold, from 19 cases in 2013 to 95 cases in 2014, and the number of cannabis exposure calls to the Washington Poison Center involving persons under 20 years old has doubled since the period 2010-2011. |195| It is unclear to what degree the legalization of recreational cannabis has had an effect on such cases, as cannabis-infused edibles and concentrated cannabis extract existed to some extent in loosely regulated medical cannabis markets for years prior to the legalization of recreational cannabis.
Legalization of the use of recreational cannabis may have also increased the number of accidents or injuries associated with cannabis use or intoxication. In 2014, within one year of the legalization of recreational cannabis use, there was a 29 per cent increase in the number of cannabis-related emergency room visits in Colorado and a 38 per cent increase in the number of cannabis-related hospitalizations. |196|
Data on treatment of cannabis use disorders are mixed: in Colorado the number of admissions for such treatment remained stable from 2011 to 2014, while in Washington and in the country as a whole, that number has been decreasing since 2009. The decline in the number of admissions for treatment of cannabis use in the United States, however, may be linked to changes in the referral process used by the criminal justice system (see the discussion in this chapter on the treatment of cannabis use in the section entitled "Extent of drug use"). There are currently no data available on admissions for treatment of cannabis use disorders in Uruguay.
FIG. 60 Cannabis-related traffic accidents and fatalities out of all traffic accidents and fatalities in the United States, including selected states, 2006-2015
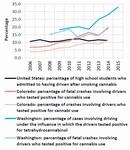
Click to enlargeSource: Monitoring the Future; National Highway Traffic Safety Administration's Fatality Analysis Reporting System; Colorado Department of Transportation; and Washington State Toxicology Laboratory.
Public safety
The increased availability of cannabis for recreational use is likely to increase the number of users driving while under the influence of cannabis. Studies suggest that cannabis is less hazardous than alcohol in terms of driving impairment, but much more dangerous when used in combination. |197| |198| |199| Data from the states of Colorado and Washington show a substantial increase in the number of cases in which drivers involved in traffic accidents or arrested for driving-under-the-influence violations have tested positive for cannabis. However, this may have resulted from increased law enforcement scrutiny.
Cannabis markets
Despite the legalization of recreational cannabis use, the illicit cannabis market has not been entirely displaced in the states of Colorado and Washington. In Washington, the medical, recreational and illicit cannabis markets each accounts for approximately one third of the state's cannabis sales, |200| while in Colorado the illicit cannabis market still supplied an estimated 40 per cent of the state's total demand for cannabis in 2014.
FIG. 61 Recreational cannabis market prices after tax in the State of Washington, United States, December 2014-December 2015
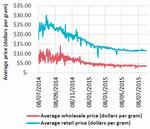
Click to enlargeSource: Washington State Liquor and Cannabis Board.
In the short term, cannabis prices are likely to remain higher on the recreational cannabis market than on the medical and illicit cannabis markets, due in part to limited supply, higher taxation and regulatory burden. Even though commercialization had already occurred to some degree in the medical cannabis markets, the maturation of licit cannabis markets has already driven down retail prices substantially as competition increases and businesses achieve economies of scale. |201| Prices have fallen in Washington since 2014, |202| and in Colorado the average price of an eighth of an ounce of cannabis (3.5 grams, the most commonly purchased quantity) fell dramatically from nearly $60 in mid-2014 to $25-40 in November 2015. |203| Uruguayan policy has not yet set a price but it is projected to be set at between $ 1.20 and $1.30 per gram of cannabis. |204|
FIG. 62 Retail cannabis: monthly revenue from sales tax, excise tax and fees for licences and applications in the State of Colorado, United States, 2014-2015
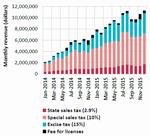
Click to enlargeSource: Colorado Department of Revenue.
FIG. 63 Monthly revenue from the sale of recreational cannabis in the State of Washington, United States, July 2014-October 2015
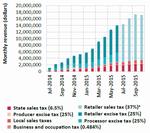
Click to enlargeSource: Washington State Liquor and Cannabis Board; and Washington State Department of Revenue
� The excise tax was changed to 37 per cent on 1 July 2015.
Each jurisdiction that has legalized cannabis use has developed a unique tax scheme for legal cannabis (see table on page xxv in the annex of the present report). The recreational cannabis markets in Colorado and Washington have grown considerably since such schemes were put in place. In Colorado, recreational cannabis market profits reached nearly $600 million in 2015, compared with $313 million in 2014. The state collected $56 million in recreational cannabis tax revenues in 2014 and over $114 million in 2015. While these figures are large, they represent only a very small portion of the state's total revenues, which totalled nearly $11 billion in the fiscal year 2014. |205| In Colorado, the first $40 million of excise tax revenues are earmarked for public schools, as required by law. Additional revenues are distributed primarily to the Marijuana Enforcement Division and to public health programmes such as substance abuse intervention and prevention programmes and educational campaigns. |206|
In Washington, in the fiscal year 2015 (July 2014-June 2015), sales of legal cannabis totalled $256 million. Just eight months into the fiscal year 2016, sales have already more than doubled, reaching nearly $580 million. Washington collected $65 million in tax receipts in the fiscal year 2015 (accounting for 0.3 per cent of the state's total revenues) and over $100 million during the first eight months of the fiscal year 2016. |207| |208| All revenues collected from the production and sale of recreational cannabis go into Washington's general fund, with the exception of allocations for certain programmes: $5 million to the Washington State Liquor and Cannabis Board to regulate the industry; $500,000 to the Washington State Healthy Youth Survey; $200,000 to fund cost-benefit analyses of the effects of cannabis legalization on the economy, public health and public safety; and $20,000 to the University of Washington Alcohol and Drug Abuse Initiative to publish medically and scientifically accurate information on cannabis.
In Oregon, data on initial sales or tax revenues are not yet available, although the Oregon Liquor Control Commission has indicated that recreational cannabis sales tax revenue after regulatory costs will be distributed as follows: 40 per cent to the common school fund; 20 per cent to mental health, alcoholism and drug use treatment services; 15 per cent to state police departments; and 5 per cent to the Oregon Health Authority for alcohol and drug use prevention.
In Uruguay, taxation on cannabis sale has been deferred, although IRCAA may impose a tax in future. While Colorado and Washington illustrate that tax revenues from cannabis legalization can be substantial, it is still not clear how the total costs of designing, implementing and regulating a legal cannabis market will measure against the current costs of cannabis prohibition. One important consideration for legalization is whether the costs of enforcing prohibition exceed the budgetary costs of regulation. In a recent study, it was estimated that for 2014 the State of Vermont spent approximately $1 million enforcing criminal laws against cannabis compared with an estimate of "low to middle single-digit millions" of dollars to establish and maintain a regulatory system. |209| However, those costs need to be weighed against revenues, which cover the ongoing costs of regulations and additional externalities, such as increased treatment and prevention costs, which are often not included in the budgets of regulatory agencies.
Criminal justice
FIG. 64 Cannabis-related arrests, charges and offences in the United States, including selected areas, 2009-2015

Click to enlargeSource: Colorado Judicial Branch; Washington State, Administrative Office of the Courts; Metropolitan Police Department of the District of Columbia; and Oregon Annual Uniform Crime Reports.
The number of arrests and court cases associated with cannabis-related offences have declined substantially in the states that have legalized cannabis. It should be pointed out, however, that this trend reflects the number of offences recorded in the criminal justice system, and that prior to legalization cannabis-related offences may not necessarily have led to prosecution or sentencing. Data on other cannabis-related police interactions, such as citations or verbal warnings for public consumption, are not readily available. Uruguay does not disaggregate its criminal justice figures by drug-related offences, although overall annual drug-related detentions have remained more or less stable in the past decade. |210| It is yet to be seen whether or how legalization affects other types of crime or arrests.
Licitly and illicitly produced cannabis in jurisdictions that have legalized recreational cannabis use can be used to supply the illicit cannabis markets of neighbouring jurisdictions, although the extent to which smuggling has increased as a result of cannabis legalization is difficult to evaluate. However, in December 2014, the states of Nebraska and Oklahoma requested that the United States Supreme Court reverse Colorado's decision to legalize cannabis, complaining that the new law in Colorado had generated an increase in cannabis trafficking in neighbouring jurisdictions. |211| Likewise, officials in Argentina and Brazil voiced concern following the legalization of cannabis use in Uruguay. |212| Interdiction of cannabis originating in Colorado increased from 2011 to 2014, |213| although this may have been a result of increased law enforcement searches. Early statements from police officials in Uruguay indicate that cannabis trafficking has remained unchanged and that organized criminal groups may have benefited in the initial period before establishment of the retail pharmacy system. |214|
SYNTHETIC DRUGS: AMPHETAMINE-TYPE STIMULANTS AND NEW PSYCHOACTIVE SUBSTANCES
Key figures

Click to enlargeNote: Amphetamines include both amphetamine and methamphetamine. Seizures of synthetic NPS refer to synthetic NPS only and do not include seizures of plant-based substances and ketamine.
Amphetamine-type stimulants: market developments
Amphetamine-type stimulants (ATS) are synthetic drugs that, in principle, can be manufactured anywhere. Unlike heroin and cocaine, they do not depend on the extraction of active constituents from plants that have to be cultivated and require certain conditions to grow. Small-scale ATS manufacture using simple "recipes" in so-called "kitchen labs", to be sold and consumed locally, exists, but large-scale ATS manufacture in clandestine laboratories with sophisticated manufacturing equipment that makes use of a range of precursor chemicals and synthesis routes also plays an important role. Any analysis of the ATS market is complicated by the fact that information on ATS manufacture is limited and this does not allow for estimates of the volume of global ATS manufacture. Data on ATS use in some of the main markets, such as East and South-East Asia, are also very limited, and the situation is further complicated by the appearance of NPS, which are some-times sold under the names of traditional ATS.
FIG. 65 Quantities of amphetamine-type stimulants seized worldwide, 2009-2014
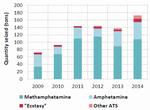
Click to enlargeSource: Responses to the annual report questionnaire.
Note: The data presented in the figure do not include seizures of prescription stimulants and substances placed under international control after 2014.
FIG. 66 Quantities of methamphetamine seized worldwide, 2009-2014

Click to enlargeSource: Responses to the annual report questionnaire.
Global seizures of amphetamine-type stimulants reach a new peak
Global ATS seizures almost doubled from 72 tons in 2009 to 144 tons in 2011. After three years of relative stability, ATS seizures reached a new peak of 173 tons in 2014. For the past few years, methamphetamine seizures have accounted for the largest share of global ATS seizures. Since 2009, global amphetamine seizures have fluctuated annually between about 20 and 46 tons. "Ecstasy" seizures more than doubled in 2014, reaching 9 tons, compared with 4-5 tons per year in the period 2009-2013.
Methamphetamine continues to dominate the markets for amphetamine-type stimulants in North America, East and South-East Asia and Oceania
Although methamphetamine is a feature of ATS markets worldwide, methamphetamine is particularly dominant in East and South-East Asia and North America. Since 2009, North America and East and South-East Asia together have accounted for most of the methamphetamine seized worldwide. North America has consistently reported the largest amount of methamphetamine seized each year. Between 2009 and 2014, quantities of methamphetamine seized in East and South-East Asia almost quadrupled.
In ATS markets in East and South-East Asia, methamphetamine is available in the form of both crystalline methamphetamine and methamphetamine tablets. Methamphetamine tablets, commonly known in the subregion as "yaba", are small tablets, typically of low purity and available in various shapes and colours. Methamphetamine tablets are mainly manufactured in the Mekong area in East and South-East Asia, and seizure reports indicate that such tablets are mostly intended for markets in that sub-region. Crystalline methamphetamine continues to be manufactured on a large scale in East and South-East Asia and is also trafficked from other subregions. |215|
In East and South-East Asia, there is a large and growing market for both methamphetamine tablets and crystalline methamphetamine. In 2014, crystalline methamphetamine was the primary drug of concern in Brunei Darussalam, Cambodia, Indonesia, Japan, the Philippines and the Republic of Korea, while methamphetamine tablets were the main drug of concern in the Lao People's Democratic Republic and Thailand. Moreover, in that same year, experts perceived an increase in the use of crystalline methamphetamine in Cambodia, China, Japan, Malaysia, the Philippines and Viet Nam and increased use of methamphetamine tablets in Cambodia, China, Malaysia, Myanmar and Viet Nam. Data on treatment for drug use in East and South-East Asia show that methamphetamine use has become a growing concern. In 2014, people receiving treatment for methamphetamine use accounted for the largest share of people treated for drug use in Brunei Darussalam, Cambodia, the Lao People's Democratic Republic, the Philippines, Singapore and Thailand. |216| Although these data indicate the importance of both forms of methamphetamine, treatment data are not representative of the overall prevalence of methamphetamine use and demand for treatment for methamphetamine use in East and South-East Asia.
In Oceania, both Australia and New Zealand have recorded sharp increases in methamphetamine seizures since 2012. In Australia, methamphetamine is illicitly manufactured. In addition, Australia saw the arrival of large-scale shipments of crystalline methamphetamine in sea cargo. A government report has highlighted the growing number of methamphetamine users in Australia, increased frequency of use of the drug among certain user groups, an increase in methamphetamine purity and a decline in purity-adjusted prices, all of which could aggravate the negative impact of methamphetamine use on the health of individuals and on society. |217|
MAP 2 Interregional trafficking flows of methamphetamine, 2011-2014
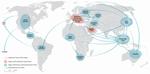
Click to enlargeSource: UNODC elaboration based on responses to annual report questionnaire, 2011-2013
Note: The arrows do not imply the involvement of any specific country in the regions mentioned nor do they represent the level of importance of any methamphetamine trafficking flow. The boundaries shown on this map do not imply official endorsement or acceptance by the United Nations. Dashed lines represent undetermined boundaries. The dotted line represents approximately the Line of Control in Jammu and Kashmir agreed upon by India and Pakistan. The final status of Jammu and Kashmir has not yet been agreed upon by the parties. The final boundary between the Sudan and South Sudan has not yet been determined.
While demand for ATS has for many years been mostly met by manufacture in the same subregion, there have been recent reports of new trafficking flows connecting previously independent subregions, particularly with regard to methamphetamine. |218| Between 2011 and 2014, methamphetamine was mostly reported to have been smuggled from West Africa, North America, West Asia and East and South-East Asia. Whereas South-East Asia and Oceania are predominantly recipients of the methamphetamine trafficked worldwide, the Middle East and large parts of Europe primarily function as transit areas for methamphetamine trafficking. All regions with illicit methamphetamine markets also have illicit methamphetamine manufacture.
Amphetamine: an intraregional mechanism of supply
Seizure reports worldwide indicate that amphetamine, unlike methamphetamine, is largely trafficked and supplied on an intraregional basis and that there are only rare linkages between regional amphetamine markets. This is especially evidenced in Europe and the Middle East, where countries continue to report large amounts of seized amphetamine.
Amphetamine seizures reported in the Middle East in recent years point to trafficking dynamics that are mainly contained within the region. In 2013 and 2014, most of the amphetamine seized in the Middle East was considered to have originated in Lebanon and the Syrian Arab Republic. Over the same period, authorities of some countries in the Middle East reporting the seizure of amphetamine consignments found that the consignments had been destined for other countries within the region, such as Jordan and Saudi Arabia. Moreover, Israel, Jordan, Lebanon and the Syrian Arab Republic were perceived to be the main transit countries for amphetamine consignments seized in the Middle East in 2013 and 2014.
MAP 3 Major Captagon seizure cases in the Middle East reported in the media, March 2014-November 2015
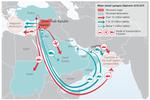
Click to enlargeSource: Based on seizures reported in media reports available in December 2015
Note: Arrows may not represent actual routes. Destination countries reported may not be the intended final destination of the shipment. The boundaries shown on this map do not imply official endorsement or acceptance by the United Nations. Dashed lines represent undetermined boundaries. The dotted line represents approximately the Line of Control in Jammu and Kashmir agreed upon by India and Pakistan. The final status of Jammu and Kashmir has not yet been agreed upon by the parties. The final boundary between the Sudan and South Sudan has not yet been determined. Destination country may not be final destination of seized shipment. Arrows represent individual case, not routes or flows.
In particular, large amounts of amphetamine tablets labelled with the brand name "Captagon" |219| were reported to have been seized in the Middle East between March 2014 and November 2015. While mostly intraregional trafficking in "Captagon" tablets has been reported in the Middle East, large amounts have also been reportedly trafficked from Lebanon and the Syrian Arab Republic to countries outside the region, such as the Sudan and Turkey.
Although Lebanon was the only country in the Middle East that reported the discovery of clandestine amphetamine laboratories between 2009 and 2014, the availability of precursor chemicals and the existence of certain areas of limited government control in some countries in the subregion are risk factors for potential amphetamine manufacture.
Variations in "ecstasy" purity and composition
In recent years, there have been indications of an increasingly diversified "ecstasy" market featuring three different product types: "ecstasy" tablets containing little or no 3,4-methylenedioxymethamphetamine (MDMA); "ecstasy" tablets with an unusually high dose of MDMA; and "ecstasy" sold in powder form containing MDMA of high purity. These compositions of "ecstasy" tablets have been observed in the illicit markets for synthetic drugs in Europe, in particular, and in East and South-East Asia and Oceania, where there is generally a large presence of "ecstasy".
The presence of different "ecstasy" products in the market is the result of different circumstances. When controls over the main precursor chemical used in the manufacture of MDMA were heightened, other substances were often used as substitutes for MDMA. In 2013, seizures of "ecstasy" tablets containing little or no MDMA and con-sisting mainly of a blend of non-controlled substances that, in some cases, included NPS were reported in East and South-East Asia (in Brunei Darussalam; Hong Kong, China (including NPS); Indonesia (including NPS); Macao, China; Malaysia; Republic of Korea; Singapore (including NPS); and Thailand) and in Oceania (in New Zealand (including NPS)). In Europe, several countries issued health risk alert warnings in 2014 when reports of fatalities were linked to the use of tablets sold as "ecstasy" that contained para-methoxymethamphetamine (PMMA), sometimes in combination with MDMA. |220|
In recent years, the availability of "ecstasy" tablets containing a high dose of MDMA appears to have increased, particularly in Europe. While fatalities caused by "ecstasy" are generally low, consumption of high doses can lead to death as a result of direct toxicity or following hyperthermia and dehydration. |221| According to EMCDDA, there are indications that illicit MDMA manufacture is concentrated in Belgium and the Netherlands, where clandestine laboratories used for the large-scale manufacture of MDMA have been dismantled. |222| "Ecstasy" tablets with a high MDMA content are being sold across Europe; they have distinctive shapes and logos to differentiate them from other "ecstasy" tablets. |223|
In addition to the growing availability of "ecstasy" tablets with a high MDMA content, a market niche appears to have emerged for powder or crystalline MDMA. In Australia, the Ecstasy and Related Drugs Reporting System |224| found that in 2014 around half of the "ecstasy" users in the country had used "ecstasy" in the form of capsules containing powder or crystalline MDMA (53 per cent of users) or in the form of MDMA "crystal/rock" (49 per cent, an increase of 10 per cent over the 2013 level), while tablets remained the form used by the vast majority of "ecstasy" users (92 per cent). It was found that among "ecstasy" users in Australia the main route used for administering MDMA "crystal/rock" was swallowing (87 per cent), followed by snorting (13 per cent). Overall "ecstasy" use in Australia decreased from 3 per cent (annual prevalence) in 2013 to 2.5 per cent in 2014.
FIG. 67 Quantities of ketamine seized worldwide, 2009-2014
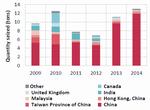
Click to enlargeSource: Responses to the annual report questionnaire.
East and South-East Asia driving the increase in global ketamine seizures
Over the years, global ketamine seizures have fluctuated greatly. The significant increase in global ketamine seizures reported since 2012 is largely attributable to East and South-East Asia, where ketamine seizures more than doubled, from 6 tons to more than 12 tons, in 2014. According to expert perceptions, there are also indications of increasing non-medical use of ketamine in East and South-East Asia. In recent years, dismantled ketamine laboratories have been reported in East and South-East Asia. In China, for example, the number of dismantled ketamine laboratories increased from 81 in 2012 to 122 in 2013; and in Hong Kong, China, a dismantled ketamine laboratory was reported in 2012.
According to WHO, among recreational users of ketamine, there is growing evidence of symptoms of ketamine dependence, as well as adverse physical effects, particularly urinary and biliary tract problems, after prolonged use or high doses of ketamine. |225| Increased rates of high-risk injecting behaviour in association with ketamine use have been reported by specific user groups. |226|
New psychoactive substances: market developments
MAP 4 Number of new psychoactive substances reported by country, 2008-2015
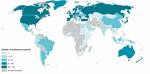
Click to enlargeSource: UNODC early warning advisory on new psychoactive substances, 2008-2015
Note: The boundaries and names shown and the designations used on this map do not imply official endorsement or acceptance by the United Nations. Dashed lines represent undetermined boundaries. Dotted line represents approximately the Line of Control in Jammu and Kashmir agreed upon by India and Pakistan. The final status of Jammu and Kashmir has not yet been agreed upon by the parties. The final boundary between the Sudan and South Sudan has not yet been determined. A dispute exists between the Governments of Argentina and the United Kingdom of Great Britain and Northern Ireland concerning sovereignty over the Falkland Islands (Malvinas).
The global market for new psychoactive substances (NPS) continues to expand. The emergence and persistence patterns of these substances show significant differences between countries and regions. Marketed in many different ways and forms, NPS can be observed among many different user groups. The effects of NPS use on the human body are not yet fully understood — safety data regarding toxicity are often not available and long-term side effects are not known. The range of drugs available on the market has probably never been wider. This situation poses additional challenges to prevention, treatment, control and identification efforts.
Wider range of new psychoactive substances reported
Between 2008 and 2015, a total of 644 NPS had been reported by 102 countries and territories to the UNODC early warning advisory on NPS. The emergence of NPS was reported for the first time in 2015 in Kyrgyzstan and Mauritius. In 2015, the early warning advisory also registered the emergence of NPS in previous years in Belarus, Serbia, South Africa and Tajikistan. The majority of countries and territories that reported the emergence of NPS up to December 2015 were from Europe (41), followed by Asia (30), Africa (16), the Americas (13) and Oceania (2).
The NPS market continues to be characterized by a large number of new substances being reported. Although data collection for 2015 is still in progress, 75 new substances have been reported to UNODC for the first time, compared with a total of only 66 in 2014. Between 2012 and 2014, most substances reported for the first time belonged to the group of synthetic cannabinoids. The data reported for 2015 so far show a different pattern: first, 20 synthetic cathinones (a group of substances with stimulant effects similar to cocaine or methamphetamine) were reported for the first time — almost as many as synthetic cannabinoids (21); and second, 21 "other substances" (substances not belonging to any of the major groups identified in previous years) were reported for the first time, including synthetic opioids (e.g. fentanyl derivatives) and sedatives (e.g. benzodiazepines).
New psychoactive substances: stability and change
A growing number of NPS are reported every year by a large number of countries and territories throughout the world. NPS that have an established presence in the market include ketamine (reported by 62 countries and territories), khat (reported by 56), JWH-018 (reported by 50), mephedrone (reported by 49) and methylone (reported by 47). |227| Other NPS are transient in nature and are only reported by a small number of countries and territories for a couple of years.
FIG. 68 Number of new psychoactive substances reported in 2014 and the year in which those substances were first reported to UNODC
Click to enlargeSource: UNODC early warning advisory on new psychoactive substances.
Approximately 19 per cent of the countries and territories reporting NPS have identified more than 100 different substances since 2008. At the same time, more than a quarter of all countries and territories reporting the emergence of NPS have reported only one substance, which may be attributable to limited technical capacity for identifying NPS.
Some NPS seem to have a stable presence in the drug market. A large proportion of the 451 substances registered in the UNODC early warning advisory on NPS in 2014 had already been reported in previous years. Twenty-three of those substances reported in 2014 had been reported for the first time in 2008 and had been reported every year since then; those substances include the phenethylamine 4-fiuoroamphetamine, the synthetic cannabinoid JWH-018 and the synthetic cathinone mephedrone. Many other NPS that appeared in subsequent years were also reported each year until 2014. Thus, there is an element of stability in the NPS market. Nevertheless, 66 new substances were reported to the UNODC early warning advisory for the first time in 2014.
Several other NPS have been reported by a small number of countries for a period of just one or two years. Between 2008 and 2014, a total of 569 NPS were reported to be on the market; however, by 2012, 26 of those substances were no longer reported to be available on the market and by 2013, 69 substances were no longer reported to be available. For instance, N-benzyl-1-phenylethylarnine was reported by six countries in Europe and Oceania between 2009 and 2012, but since then no further reports on that substance have been submitted to UNODC, suggesting that the substance is no longer available.
Many newly reported NPS are actually derivatives of previously reported substances whose molecular structure has been slightly modified. One such example is the series of 2,5-dimethoxy ring-substituted phenethylamines (2C series). Modelled on 4-bromo-2,5-dimethoxyphenethylamine (2C-B), a substance controlled under the Convention on Psychotropic Substances of 1971, 20 NPS belonging to the 2C series were reported worldwide until 2014. However, about half of them did not remain on the market and were only reported for a small number of years. These included 2C-T, which was reported only in 2011 by Canada, and 2C-G and 2C-N, which were reported in 2011 and 2012 by Canada and Poland. Other substances belonging to the 2C series seem to be more persistent, such as 2C-T-2 and 2C-T-7, which were reported from 2009 to 2014 by 14 countries in the Americas, Europe and Oceania.
FIG. 69 Number of countries reporting the CP-47,497-C8 homologue, a synthetic cannabinoid, by year and region, 2008-2014
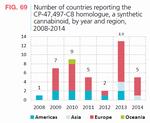
Click to enlargeSource: UNODC early warning advisory on new psychoactive substances.
Other substances, such as those belonging to the synthetic cannabinoid CP series, have shown large variations in market availability since 2008. For example, the CP-47,497-C8 homologue was first reported by one country in Asia (Japan) in 2008; after several fluctuations, the reporting of that synthetic cannabinoid reached its peak in 2013, with 13 countries in the Americas, Asia and Europe having reported its presence.
There are elements that influence the NPS market, such as user preference, legal responses and law enforcement efforts to seize substances before a significant user base becomes established. UNODC monitoring of NPS since 2008 has shown a rather dynamic supply situation, characterized by persistence (substances that emerge, spread and stay for several years) and change (substances that appear for a short time or only locally).
Significant seizures of new psychoactive substances
Significant quantities of synthetic NPS |228| have been seized over the past few years, reaching 34 tons in 2014. The global market for NPS continues to be dominated by synthetic cannabinoids, with North America, in particular the United States, accounting for the largest quantities seized worldwide. Of the 32 tons of synthetic cannabinoids seized worldwide in 2014, |229| 26.5 tons were seized in the United States alone. Europe also recorded significant seizures of synthetic cannabinoids: 5.4 tons of synthetic cannabinoids were seized in 2014 (mainly in Cyprus and Turkey), compared with 1.2 tons in 2013. Of all the drug groups, synthetic cannabinoids accounted for the largest seizures in Cyprus in 2012 (8.3 tons) and 2014 (4.4 tons); in most cases, the seized synthetic cannabinoid was AM-2201. |230|
FIG. 70 Quantities of synthetic cathinones seized, by region, 2010-2014
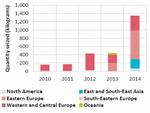
Click to enlargeSource: Responses to the annual report questionnaire.
Global seizures of synthetic cathinones have been steadily increasing since they were first reported in 2010. Those seizures tripled between 2013 and 2014, reaching 1.3 tons. Most synthetic cathinones were seized in Eastern Europe (692 kg were seized in the Russian Federation), in Western and Central Europe (312 kg were seized in England and Wales) and in East and South-East Asia (226 kg were seized in Hong Kong, China). In 2014, the Russian Federation also reported significant seizures of aminoindanes (438 kg).
The risk of mixtures of new psychoactive substances sold in various compositions
FIG. 71 Examples of seized products of new psychoactive substances containing combinations of substances
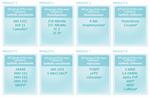
Click to enlargeSource: UNODC survey on new psychoactive substances, 2014.
Note: The main substance found in each product is listed first.
� Substance under international control at the time the product was seized.
b Different chemical NPS group.
c Pharmaceutical product.
d Adulterant.Seizure reports indicate that NPS are frequently sold in various compositions in a combination of different compounds, including internationally controlled drugs, pharmaceutical products and adulterants. Over the past few years, various countries in Europe and South-East Asia have reported seizures of "ecstasy" tablets containing mainly a blend of non-controlled substances, including NPS, and little or no MDMA. However, recent seizure reports show that packaged NPS products contained mixtures of a variety of NPS compounds. Mixtures can arise intentionally (for example, if the producer believes that some blends will have greater effects for the user than any of the substances in isolation) or unintentionally (for example, if the producer lacks the skill or the facilities to produce a consistently pure product).
In 2013, European countries reported more than 110 NPS products containing a combination of up to seven different NPS compounds sold as one product. Synthetic cannabinoids were found to be present in more than 55 per cent of those NPS products, and synthetic cathinones were present in more than 25 per cent. |231|
In addition to NPS mixtures containing substances belonging to the same NPS group, in 2013, four European countries reported 10 different NPS products that included combinations of substances from different chemical NPS groups. The most frequently identified combination of NPS groups found in such products included phenethylamines combined with synthetic cathinones. Generally, synthetic cathinones were most frequently identified in NPS products combining different NPS groups and were usually observed in combination with ketamine and other phencyclidine-type substances, phenethylamines and tryptamines. |232|
It should be noted that polydrug use is not limited to NPS use. People who use drugs often choose to take multiple substances concurrently, including mixing street drugs with alcohol and/or prescription drugs. But the sheer number of potential combinations of NPS and, most importantly, the fact that NPS users are often unaware of what they are actually consuming can complicate the situation with NPS. The use of NPS products containing a variety of psychoactive substances that may or may not be known to the user potentially exposes the user to additional serious health risks, as little or no scientific information is available to determine the psychoactive effects that these combinations may have.
Understanding the use of new psychoactive substances
In the past few years, a growing number of NPS have been sold on illicit drug markets. Available NPS may or may not have effects and profiles similar to those of the substances under international control that they are designed to mimic. |233| A large number of NPS are designed to mimic the effects of controlled drugs such as cannabis, cocaine, heroin, LSD, MDMA ("ecstasy") or methamphetamine. Analysis of the pharmacological effects of NPS reported up to December 2015 |234| revealed that the majority of those substances were synthetic cannabinoid receptor agonists, stimulants and classic hallucinogens.
FIG. 72 Proportion of new psychoactive substances by pharmacological effect, December 2015
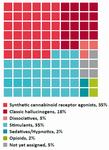
Click to enlargeSource: UNODC early warning advisory on new psychoactive substances, 2008-2015.
Data on the prevalence of NPS use indicate diverse trends. Among the reasons for this are the limited data available for comparing the prevalence of NPS use over time, limited survey tools for capturing NPS use and limited knowledge of NPS users about the substances they use. In the United States, there are indications of an increase in NPS use among certain user groups between 2009 and 2013; the prevalence of lifetime use of a "novel psychoactive substance" among the population aged 12-34 was 1.2 per cent in 2013. |235| There are signs of declining use of synthetic cannabinoids among secondary school students in the United States. The prevalence of past-year use of synthetic cannabinoids among twelfth-grade students decreased from 11.4 per cent in 2011 to 5.2 per cent in 2015. |236| This is associated with an increase, over the same period, in the perceived risk of taking synthetic cannabinoids among the same group. The use of NPS with stimulant effects (reported as "bath salts") among twelfth graders remained stable at 1 per cent in 2015. The prevalence of the use of synthetic cannabinoids among eighth, tenth and twelfth graders has declined to the lowest levels since the collection of such data began. However, the large amount of synthetic cannabinoids seized between 2012 and 2014 (more than 93 tons) and the large number of calls to poison centres for problems related to the use of synthetic cannabinoids (3,682 in 2014 and 7,779 in 2015) |237| indicate the continued presence and use of this NPS group in the United States.
According to the Crime Survey for England and Wales, |238| over the period 2014-2015, 279,000 adults (0.9 per cent of the population aged 16-59) reported the use of NPS. Among young adults (ages 16-24), the prevalence of NPS use was much higher (2.8 per cent), the majority of the users being young men. Herbal smoking mixtures were the most commonly used form of NPS, with 61 per cent of the population aged 16-59 reporting their use. According to Public Health England, |239| the number of individuals "presenting to treatment" for a "club drug" or NPS more than doubled, from 2,727 to 5,532, between the financial years 2009-2010 and 2014-2015. The largest increase was recorded for mephedrone — from 953 in the period 2010-2011 to 2,024 in the period 2014-2015. Compared with the previous period, the prevalence of past-year use of mephedrone in England and Wales in the financial years 2014-2015 remained stable at 1.9 per cent for young adults and 0.5 per cent for adults, which is sim-ilar to the prevalence of past-year use of amphetamines (0.6 per cent) and higher than that of LSD (0.4 per cent) or heroin (0.1 per cent). |240|
In 2014, Chile reported for the first time data on the prev-alence of past-year use of synthetic cannabinoids: 0.56 per cent |241| among adults (ages 15-64), which is similar to the prevalence of the use of hallucinogens (0.55 per cent) and opioids (0.58 per cent).
In several countries, the surge in NPS use in prisons has been reported with a corresponding rise in violence and hospital admissions. There are indications that synthetic cannabinoids, in particular, have emerged as a major problem. The substances abused by prisoners in England and Wales |242| were reported to be primarily cannabis (13 per cent), synthetic cannabinoids (10 per cent), heroin (7 per cent) and other NPS (5 per cent). Although synthetic cannabinoids were identified as a concern in 37 per cent of the male prisons inspected in the financial year 2013-2014, |243| this proportion increased to 64 per cent in the financial year 2014-2015. |244| According to reports, many prison staff and prisoners reported high levels of synthetic cannabinoid use, which was associated with mental and physical health problems, as well as altered behaviour of prisoners. |245| In New Zealand, about 47 per cent of detainees used synthetic cannabinoids in 2014. |246| While the past-year prevalence of the use of synthetic cannabinoids in 2014 remained unchanged compared with 2013, the past-year frequency of the use of synthetic cannabinoids increased, from 67 days in 2013 to 110 days in 2014. Almost a third (30 per cent) of the detainees who had used synthetic cannabinoids in the past twelve months reported perceived dependence in 2014, up from 17 per cent in 2013. Other NPS reported by detainees to be used included MDPV |247| and ketamine.
The injecting use of NPS, particularly synthetic cathinones, continues to be reported among specific high-risk user groups and was associated with an elevated or even increasing rate of HIV infection. These include young people, subgroups of MSM, people who have previously injected other drugs and people who have switched from snorting to injecting. In a study conducted in Hungary, |248| 92 of 167 PWID tested HIV-positive, the most common drug injected being pentedrone (48 per cent). In Ireland, an unexpected increase in cases of acute HIV infection among PWID in 2015 was associated with the injecting use of the synthetic cathinone alpha-pyrrolidinopentio-phenone (alpha-PVP) among so-called "chaotic" PWID. |249| Injecting was reported to occur multiple times a day, with users often reusing syringes and sharing filters. According to Public Health England, within five years of the first appearance of mephedrone |250| around 1 in 10 PWID reported the injection of mephedrone. Increased mephedrone use was also reported by subgroups of MSM who injected the substance for use in a sexual context ("chemsex"), often sharing injecting equipment and engaging in unprotected sex. |251| These findings indicate an increase in the number of people who inject synthetic cathinones in Europe, an increase in high-risk behaviour and a higher risk of acquiring blood-borne viruses such as HIV and hepatitis C.
CHAPTER 2
THE WORLD DRUG PROBLEM AND SUSTAINABLE DEVELOPMENT
INTRODUCTION
From illicit cultivation and production to trafficking and use, the world drug problem, with all its ramifications, is intertwined with a vast array of social, economic and environmental issues. This exerts great pressure on development efforts, which in turn have an influence on the drug problem. Interventions made in response to the drug problem themselves generate further interplay with the broader development and social context and introduce additional, sometimes unforeseen, complexity to this dynamic. The importance of this interaction is increasingly being recognized by the international community, as reflected in the discussions on the Sustainable Development Goals and the special session of the General Assembly on the world drug problem held in 2016.
FIG. 1 Dimensions of sustainable development
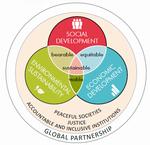
Click to enlargeThe concept of development, together with the engagement by the international community in this area, is reflected in the Millennium Development Goals, followed by the recently formulated 2030 Agenda for Sustainable Development. |1| The 17 Sustainable Development Goals and their targets are integrated and indivisible and balance the three dimensions of development: economic, social and environmental. The new development agenda also recognizes that sustainable development cannot be realized without peace and security, and that peace and security will be at risk without sustainable development. Factors that give rise to violence, insecurity and injustice, such as inequality, corruption, poor governance and illicit financial and arms flows, are addressed in the development agenda.
The present chapter uses the framework of the Sustainable Development Goals to examine the interplay between the drug problem and the broader development context. It clusters the discussion around five topics — social development; economic development; environmental sustainability; peaceful, just and inclusive societies; and partnership — in the light of the world drug problem and the global response thereto. Specifically, the present chapter seeks to elucidate the interplay between each of these aspects of sustainable development on the one hand, and the issue of drugs on the other, while distinguishing between the drug problem as a phenomenon (illicit drug use, production and trafficking) and the response to the drug problem.
In analysing the interaction between social development and the world drug problem, the first section in this chapter summarizes the evidence of the social costs of illicit drug use, the most important being its effects on the health of people who use drugs. The section also investigates the health impact of drug use across levels of development. Other aspects addressed include the impact on the families of people who use drugs and their communities, and the marginalization and stigmatization of people who use drugs and the repercussions of that, particularly on their employment opportunities. The section also addresses the impact of the response to the drug problem on social development, with reference to, for example, alternative development, as well as the availability of drugs for medical and scientific purposes.
The second section, on economic development, addresses the question of how the level of economic development relates to drug use and the formation of illicit drug markets, by examining indicators at the national level. The analysis attempts to identify patterns describing the evolution of the drug problem and the role of development. It also discusses socioeconomic factors at the subnational level, focusing on marginalization and poverty. The economic cost of drug use resulting from loss of productivity is also taken into account, as are the costs associated with efforts by state institutions to help drug users.
The third section, on environmental sustainability, presents evidence on the environmental impact of illicit drug cultivation, production and trafficking, as well as drug supply reduction interventions, including deforestation and biodiversity loss.
The fourth section, on peaceful, just and inclusive societies, addresses topics that have been recently introduced into the international development agenda through the Sustainable Development Goals. It examines different forms of violence in connection with drugs, including links to terrorism and insurgency, and it discusses the long-term and short-term outcomes of the response to the drug problem. In addition, the section investigates the extent to which drug trafficking is intrinsically associated with violence, describes how the drug problem can be an enabler or an outcome of violence, and highlights the role of the underlying rule of law in shaping this relationship. It also explores how the criminal justice system influences, and is influenced by, the drug problem, looking in particular at how drug trafficking can undermine the system, as well as the role of law enforcement in influencing drug prices and markets. Moreover, the discussion covers the impact of criminal justice on people who use drugs, the extent of the resource drain on the system arising from the incarceration of drug users, and alternatives to imprisonment. In addition, the section describes the mutually reinforcing relationship between the drug problem and corruption and addresses the scale and the impact of illicit financial flows arising from drug trafficking and production.
Last but not least, the section on partnership looks at development assistance data provided by countries and highlights divergent trends between overall development assistance on the one hand and the assistance provided for the drug-related sectors on the other, underlining the need to redress this imbalance in the context of the 2030 Agenda for Sustainable Development.
Figure 2 schematizes the interactions discussed in this chapter, which serve as a template for most of the subsections in the chapter.
Fig. 2 Analytical framework of the thematic chapter
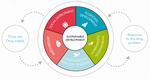
Click to enlarge
Impact of drug use on social development
Public health impact
There are numerous ways in which illicit drug use, production and trafficking can have an impact on sustainable development. Principal among them are the negative consequences for public health, which, as its absence precludes human development in every other dimension, lies at the heart of sustainable development.
Sustainable Development Goal 3. Ensure healthy lives and promote well-being for all at all ages
The impact of illicit drug use on the health of people who use drugs and, more generally, on public health is notorious and well documented. Target 3.5 of the Sustainable Development Goals is to strengthen "the prevention and treatment of substance abuse, including narcotic drug abuse". Prevention, treatment, care, recovery, rehabilitation and social reintegration measures and programmes all play a role in addressing the problem of drug use and reducing the negative health impact on society.
In addition to medical conditions resulting directly from the psychoactive and physiological effects of drugs, certain forms of drug use and modes of administration are important risk factors for contracting other diseases; this not only affects people who use drugs but also the people with whom they come into contact. As discussed in the previous chapter, there are many potential health risks and outcomes for people who use drugs, including overdose, suicide, trauma, mental health problems, disability and premature death.
People who develop dependence and become affected by drug use disorders are those who account for the vast majority of negative health consequences among people who use drugs. UNODC estimates that, as of 2014, out of a quarter of a billion past-year drug users, more than 29 million had a drug use disorder (see page 1). Sporadic or regular drug use that has not progressed to drug dependence can still carry some health risks, particularly if it has the potential to change the user's behaviour when he or she is under the influence of drugs; even a single episode, or small number of episodes, can have damaging effects. Since products sold in the illegal drug market under a certain name may contain a wide variety of substances, and people who use drugs do not have information about the contents of what they consume, there are also additional risks. Moreover, episodic drug use itself carries the risk of evolving into drug-dependent use.
Certain people who use drugs may manage to lead socially integrated lives in parallel with regular drug use and thus do not conform to the stereotypical image of a problem drug user, but that does not prevent the development of drug dependence, and the harm caused by drug use may only be felt in the long term. In general, the consequences of drug use may develop independently in two different aspects of an individual's life: health and social. In some cases, there may be health conditions with a limited impact on an individual's social life; in other cases, the social impact of drug use may be more serious than the health aspects. Broadly speaking, the social consequences of drug use may emerge only at later stages of the development of drug use disorders.
FIG. 3 Burden of drug use disorders� per 100,000 population, by level of development, 2013
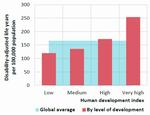
Click to enlargeSource: Human development index from the United Nations Development Programme (UNDP); data on burden of disease (disability-adjusted life years) from the Institute for Health Metrics and Evaluation, University of Washington, GBD Compare, 2015. Available from http://vizhub.healthdata.org/gbd-compare.
Note: The designations "low", "medium" etc. based on the human development index are those used by UNDP
� The sum of the burden attributed to opioids, cocaine, cannabis and amphetamines, excluding "Other drugs".
Globally, roughly 200,000 people lose their lives each year to causes attributed to drug use. People who regularly use drugs tend to live with disability and die early. The Global Burden of Disease Study quantifies the adverse health impact of hundreds of diseases, injuries and risk factors. It indicates that opioids, cocaine, amphetamines and cannabis together accounted for almost 12 million years of life lost |2| because of premature death or disability in 2013, of which more than 8 million were linked to the use of opioids. |3| Based on data from the study, developed countries appear to be disproportionately affected by the overall health impact of drug use (see figure 3).
Target 3.3 of the Sustainable Development Goals
By 2030, end the epidemics of AIDS, tuberculosis, malaria and neglected tropical diseases and combat hepatitis, water-borne diseases and other communicable diseasesEpidemics and communicable diseases have a negative impact on the health of millions of people and constitute a major challenge to sustainable development, which are among the reasons why target 3.3 of the Sustainable Development Goals is aimed at ending, by 2030, the epidemics of AIDS and tuberculosis and combating hepatitis, waterborne diseases and other communicable diseases. To improve prevention and treatment of these diseases, better understanding of their risk factors is needed. One of the biggest risk factors associated with the use of drugs stems from their mode of administration, particularly injecting drug use. Smoking, swallowing, snorting or inhaling a drug can lead to a variety of health problems, but injecting a drug carries a much greater risk of overdose, vein damage, abscesses and infection, in particular the transmission of blood-borne viruses such as HIV and hepatitis C.
It is currently estimated that some 11.7 million people worldwide inject drugs, of whom around 1.6 million (14.0 per cent) are living with HIV. People who inject drugs (PWID) are estimated to make up appromately 5-10 per cent of all people living with HIV, |4| and injecting drug use accounts for around 30 per cent of new HIV infections outside sub-Saharan Africa. |5| |6| Scientific estimates of the probability of HIV transmission ensuing from exposure to an infected source indicate that needle-sharing drug use carries one of the higher risks of transmission per exposure (albeit much lower than transmission by blood transfusion or mother-to-child transmission without antiretroviral therapy). |7| |8|
HIV transmission is not the only health consequence associated with drug use. According to data on the global burden of disease, drug use as a risk factor accounted for 32 per cent of deaths caused by cirrhosis resulting from hepatitis C and 14 per cent of deaths caused by liver cancer. |9|
Drug use can also have an impact on public health by increasing the risk of road traffic accidents (driving while under the influence of drugs) and accidents in the workplace, which not only cause serious harm to people who use drugs but also to the people around them.
Sexual behaviour and the health impact of drug use
Although indirect, one mechanism whereby drug use may have repercussions on the health of society in general is linked to the sexual behaviour of people who use drugs. This is of particular concern in the case of at-risk groups such as PWID, for whom an increased risk of transmission caused by drug use itself can be the very cause (or a major driver) of a high prevalence of certain sexually transmitted infections. When non-injecting drug use increases the likelihood of risk-taking behaviour among other at-risk groups, such as men who have sex with men (MSM) and transgender individuals, that can also have an impact.
Research confirms that there are links between drug use patterns and sexual behaviour. It is difficult to disentangle causalities between drug use and sexual behaviour, but the following patterns have been documented: transmission of sexually transmitted infections from people who use drugs to spouses and partners; people who use drugs engaging in sex work as a way to fund drug use; and people who use drugs engaging in high-risk sexual behaviour while under the influence of certain drugs, especially stimulants and "party drugs". Local reports from India, Myanmar and Ukraine have documented HIV epidemics associated with injecting drug use that have spread to the general population chiefly through heterosexual contact. |10|
A report by the Commission on AIDS in Asia |11| described one example in Indonesia in which HIV did not spread in the sex industry until a few years after it had reached a very high level among PWID.
It has been hypothesized that the use of certain drugs increases or decreases sexual desire and levels of sexual activity and has a disinhibiting effect, making users less likely to engage in safer sex, thus exacerbating the negative health impact of drug use. Stimulants such as cocaine and ATS are the most commonly cited drugs linking drug use with high-risk sexual behaviour and HIV transmission. It has also been argued that many people use the disinhibiting effects of amphetamines to facilitate sex, including high-risk sex, and that the impulsivity produced by amphetamines makes users potentially more likely to engage in unprotected sex. For example, a study in the United States found methamphetamine use to be related to increased, unprotected sexual activity and the risk of contracting sexually transmitted diseases, including HIV, irrespective of gender, age, race, ethnicity or sexual orientation. |12|
Impact of drug use on gender equality and the empowerment of women
Sustainable Development Goal 5. Achieve gender equality and empower all women and girls
Women affected by drug use disorders are more vulnerable and more stigmatized than men. They suffer from co-occurring mental health disorders to a greater extent than men and they are more likely to have been victims of violence and abuse. However, they are far less likely to enter drug treatment programmes than men, which can reduce their opportunities to reintegrate into society and exacerbate their sense of stigmatization as people who use drugs. |13| Drug use may thus have a direct negative impact on gender equality and the empowerment of women.
There are many aspects of the drug problem that have an impact on gender equality and therefore on social development. Given that there are many more men than women who use drugs, research, guidelines and training programmes concerning people who use drugs remain largely male-focused and fail to address the specificities of female drug use patterns. The impact of drug use is also greater on women than on men because women tend to lack access to the continuum of care for drug use disorders.
Women who use drugs face several issues and problems that enhance their vulnerability to HIV (as well as other major health issues) such as sex work, sexually transmitted infections, viral hepatitis, mental health problems, reproductive health issues, childcare, stigma and violence, in addition to a lack of gender-sensitive health services. |14| Women who inject drugs, in particular, are an often hard-to-reach and highly vulnerable group, to the extent that even data relating to them are more limited than data relating to their male counterparts.
An indirect consequence of drug use on the health of women is that HIV is not only transmitted between PWID through the sharing of injecting equipment but also from (predominantly male) PWID to their spouses and other sexual partners owing to inadequate use of protection such as condoms. Although they also have their own set of risk factors, generally there is a risk incurred by the female sex partners of men who inject drugs, who share injecting equipment, have multiple sex partners, practice limited condom use, engage in sexual violence and have low risk perception and disclosure of HIV status and drug use, as well as low uptake for HIV testing. |15| In a study of over 4,000 female sex partners of men who inject drugs in India, young age, early marriage (more than half had been married before the age of 18), unsupportive partners, diagnosable mental health problems (mainly depression), poor decision-making powers and economic dependence characterized many of the women, who also reported high rates of exposure to domestic violence but low rates of seeking help in such situations. |16|
Drug use and intimate partner or family-related violence
Drug use has been identified as a major risk factor for family-related violence. As this type of violence particularly affects women and girls, drug use can effectively be seen to be a factor contributing to violence against women and girls, which, according to target 5.2 of the Sustainable Development Goals, needs to be eliminated in all its forms, in the public and private spheres.
Target 5.2 of the Sustainable Development Goals
Eliminate all forms of violence against all women and girls in the public and private spheres, including trafficking and sexual and other types of exploitationA study in Afghanistan found that drug use led to domestic violence, with over half of family members interviewed reporting that they had been hit by or had hit out at a drug-using relative during a confrontation regarding the latter's drug use. |17| In India, physical violence by family members was reported by 43 per cent of a sample of 179 women with a male family member currently using drugs, and verbal aggression was reported by 50 per cent. |18|
Research indicates that the pathways leading to drug use are different for men and women, with the initial period of a woman's drug-using career significantly related to their relationship with men. |19| A study in the United States of 416 women in opioid substitution treatment (using methadone) found that frequent use of "crack" by women who use drugs increased the likelihood of subsequent violence from intimate partners. |20|
Women who inject drugs may also experience violence, perpetrated by intimate partners or law enforcement personnel (or clients if the women are sex workers). Research also shows that women who experience intimate partner violence are less likely to use condoms and more likely to share injecting equipment, to have multiple sexual partners and to trade sex. |21|
Impact of problem drug use on the family, children and youth
"People are at the centre of sustainable development... and the commitment was made ... to benefit all, in particular the children of the world, youth and future generations of the world." |22|
Another way in which drug use can have a negative impact on social development is by undermining the functioning of society's basic cell — the family — and the welfare of children and youth, upon whom its future hinges.
Family
Different patterns of drug use have different types and degrees of impact. In some situations, drug use may make little or limited difference to the family; in other cases, it may have distinct effects on family structures and on marital relationships, family violence and child abuse and neglect and on the family economy. Drug use is often associated with child abuse and domestic violence and is also a leading contributor to marital dissatisfaction, family breakups and rejection of family members. |23|
A UNODC study on people who use drugs in Afghanistan found that nearly 70 per cent of family members of people who use drugs had experienced financial problems as a result of a family member's drug use, which led to a reduction in overall family income caused by a decrease in the financial contribution by the person using drugs. Family members interviewed reported that 60 per cent of drug-using relatives who had been employed prior to using drugs had subsequently lost their jobs. Almost half of the family members interviewed also said they had been forced to borrow money as a result of drug use in the family; almost 70 per cent reported that they had faced financial difficulties as a result of that drug use; and a third of all family members indicated that they had gone without food or other basic necessities as a result. |24|
While drug-using parents may have a negative impact on their children's development, drug use by children, teenagers and young adults can also have a profound impact on a family, affecting the dynamics and relationships with parents, siblings and other members of the extended family, often eliciting feelings of anger, sadness, anxiety, shame and loss. Parents of drug-using children have linked deterioration of their own physical and psychological health to the stress and conflictual nature of living with their child's drug problem. Siblings of drug-using children may experience the loss of a close relationship with their drug-using brother or sister and may themselves be exposed or deliberately introduced to drug use that leads to more problematic use. |25|
Children
Sustainable Development Goal 4. Ensure inclusive and equitable quality education and promote lifelong learning opportunities for all
Target 16.2 of the Sustainable Development Goals
End abuse, exploitation, trafficking and all forms of violence against and torture of childrenChildren appear as a group of special concern in several of the Sustainable Development Goals, in particular Goal 1 (target 1.2 of which covers children living in poverty), Goal 2 (which covers malnutrition), Goal 3 (which covers mortality among newborns and children), Goal 4 (which covers education) and Goal 16 (target 16.2 of which covers violence against children). The development of children is, however, directly in the hands of their parents, whose parenting skills have a profound effect on their offspring. Unstable and inconsistent family and living environment factors, such as transient living conditions, inconsistent caretaking and violence resulting from drug-using parents, have been linked to psychological and emotional development problems among children. Moreover, parents who use drugs may be absent because they are incapacitated by drug use or spending time procuring drugs, in treatment or in prison. |26|
A study undertaken in Ireland suggested that opiate dependence has a specific impact on parenting processes, particularly on the physical and emotional availability of parents and on the capacity of parents to provide an emotionally consistent environment. The factors involved relate to the parents' focus on the supply and acquisition of drugs, the impact of intoxication and withdrawal from opioids, preoccupation with drugs and instability of moods. Drug-using parents reported that they were aware of their limitations as parents and were dissatisfied with their levels of availability, emotional responsiveness and stability regarding their children. |27|
Youth
Target 4.4 of the Sustainable Development Goals
By 2030, substantially increase the number of youth and adults who have relevant skills, including technical and vocational skills, for employment, decent jobs and entrepreneurshipDrug use often affects people during their most productive years, and the entrapment of youth in both drug use and the illicit drug trade itself, as opposed to engagement in legitimate employment and educational opportunities, poses distinct barriers to the development of individuals and communities. Depending on a wide range of factors associated with the culture and context of that use, such as the type of drugs and the availability of particular drugs, young people may be vulnerable and at risk of drug use.
There is not a straight cause-and-effect relationship between development and the involvement of youth in illicit drug use and drug trafficking, as these factors are all associated with each other. A key feature in understanding risk factors for youth is their interconnectedness, especially relating to the onset of drug use disorders. |28|
Impact of social development on the drug problem
An entire area of development interventions, namely alternative development, exists for the express purpose of reducing illicit drug crop cultivation, among other things. There is ample evidence that it is only when interventions have succeeded in improving the development status of communities that they turn away from illicit cultivation |29|
More broadly, just as drug use has serious ramifications for development, certain socioeconomic factors, such as poverty, poor education and lack of health-care services, can have a negative impact on drug use. Inequality, social deprivation and lack of alternative livelihoods, to name but a few, can all be viewed as deficiencies in development that feed one or another aspect of the drug problem. Poverty, unemployment, poor education, domestic violence and social disadvantage are vulnerabilities linked to social development that can be conducive to drug use. Moreover, people with drug use disorders whose lives are characterized by low levels of literacy and education may have limited understanding of the potentially harmful effects of drugs, particularly relating to the risk of drug dependence, because of a general lack of accurate, practical and realistic information about drugs and their effects. |30|
Countries with well-developed and articulated healthcare delivery systems, well trained staff and efficient procedures for the issuance and processing of both import and export authorizations tend to fare better in ensuring the availability of opioids for medical purposes. According to the International Narcotics Control Board (INCB), the consumption of narcotic drugs for pain relief is concentrated primarily in countries in North America, Western Europe and Oceania, |31| some of which are also regions with a high level of documented misuse of prescription opioids. Based on data by the National Center for Health Statistics, |32| every year since 2002 more than 40 per cent of the total number of overdose deaths in the United States have been related to prescription opioids. Street gang members have capitalized on the problem of misuse of prescription opioids in the United States by trafficking prescription drugs, specifically hydrocodone and oxycodone. |33|
Social norms and drug use
Another indirect way that social development can have an influence on the drug problem is by supporting or undermining existing structures of society that can increase (or decrease) vulnerability to drug use. One aspect of this is related to changing social norms, whereby an individual's inclination to engage in drug use, particularly the initiation of drug use or of a new type of drug-using behaviour, is influenced by the level of acceptability that individuals perceive to be associated with that particular behaviour within their immediate acquaintances, family, community, peer group and society in general.
As society and social norms change, the inclination to engage in drug use may therefore also undergo change. For example, in families where drugs are used or attitudes towards their use are positive, the incidence of drug use among children is higher than in families where drug use is low and where attitudes towards drug use are not as permissive. One study showed that children of people with drug use disorders are seven times more likely than their peers to grow up with drug and alcohol problems. |34|
FIG. 4 Use of cannabis compared with attitudes towards cannabis use among twelfth graders in the United States, 1975-2015
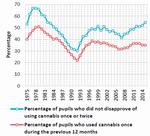
Click to enlargeSource: Monitoring the Future study: United States, Department of Health and Human Services (1975-1994), and Institute for Social Research, University of Michigan (1995-2015).
The results of school surveys in the United States provide an indicator of the acceptability of using cannabis, as measured by the percentage of pupils who did not disapprove of people (over 18 or older) who try cannabis once or twice; the trend in this indicator over the period 1975-2015 mirrors the trend in prevalence of cannabis use. Indeed, this disapproval indicator is a slightly better predictor of the trend in cannabis use than the perceived ease of availability of cannabis. Although this pattern is observable over the long term, in recent years the trends have begun to diverge, which may be linked to developments in the policy on cannabis in some states of the United States.
A similar pattern emerges from the results of a recent study of drug use among the school population in Chile (covering pupils between the eighth year of primary school and the fourth year of secondary school). In 2013, past-year prevalence of cannabis use rose sharply (reaching 30.6 per cent, up from 19.5 per cent in 2011); at the same time, several perception indicators (including parental disapproval) showed significant shifts towards greater acceptability of cannabis use and a decrease in the perception of risk. |35|
One study of already socially excluded young people who were living in impoverished areas in the United Kingdom of Great Britain and Northern Ireland, where there were changing illicit drug markets and few opportunities in the local economy, found that young people experienced an erosion of normative cultural barriers between recreational and problematic drug use and had an increased risk of transitioning from cannabis to heroin use. |36| This is likely to be true for similarly impoverished groups in the rapidly changing drug markets of developing countries.
A review of over 50 articles on school-based education programmes to prevent the use of drugs and other substances identified various cultural components used to adapt the programmes to different schools and settings and evaluated whether the inclusion of such components enhanced outcomes. The study found that among the components that enhanced the outcomes for participants in the school-based drug use prevention programmes was the incorporation of positive values of the participants' cultural and ethnic identities, such as religiosity. |37|
Migration and drug use
Target 10.7 of the Sustainable Development Goals
Facilitate orderly, safe, regular and responsible migration and mobility of people, including through the implementation of planned and well-managed migration policiesOne of the numerous perils of migration is that it can affect drug use patterns not only because it may expose migrants to new drugs, but also because migrants often find themselves living in new and challenging circum-stances away from the support of their families and other networks. A UNODC study in Afghanistan, in which interviews were conducted with more than 3,000 people who had been using drugs (opium, cannabis, heroin and tranquillizers) for more than six months on a regular basis, found that 26 per cent of the people interviewed had started using drugs in the Islamic Republic of Iran and 8 per cent had started using drugs in Pakistan. |38| Participants in focus-group discussions in all provinces mentioned that the problems faced by migrants could drive them to use drugs. An earlier study in Afghanistan yielded similar results; of the opium users, 40 per cent (all men) had ini-tiated their opiate use in the Islamic Republic of Iran and 4 per cent had initiated their opiate use in Pakistan. |39|
While migration itself can directly affect drug use patterns, the absence of safe and accessible channels for migration contributes (together with various root causes such as environmental disasters, conflict and political and social upheaval) to the displacement of populations, the formation of communities of internally displaced persons and refugees and the deterioration of many aspects of life, exacerbating poverty and creating unemployment. This leads to conditions conducive to the emergence of illicit drug use, which may arise, for example, as an escape from social stress and post-conflict conditions.
Studies on the mental health of populations displaced by conflict have brought out the links with post-traumatic stress disorder and depression, both potential triggers for initiating or escalating drug use. |40| Research conducted in six settings of protracted displacement for refugees and internally displaced people — in Iran (Islamic Republic of), Kenya, Liberia, Pakistan, Thailand and northern Uganda — found that a range of narcotic drugs, psycho-active substances and other substances, such as opiates, khat, benzodiazepines and alcohol, contributed to wide-reaching health, social and protection problems. The study also found that displacement experiences, including dispossession, livelihood restriction, hopelessness and an uncertain future may make communities particularly vulnerable to drug use and its effects, and changing social norms and networks (including the population in the surrounding area) may result in changed and potentially more harmful patterns of use and resultant social costs. |41|
Migrants can develop problems related to the use of drugs and other substances while in their country of origin, in transit, in temporary refuge or in resettlement, and a variety of risk factors for developing drug dependence in those settings have been reported, including male gender, exposure to war trauma, displacement and coexisting mental health problems. |42|
Links between social exclusion, stigma and drug use
Target 10.2 of the Sustainable Development Goals
By 2030, empower and promote the social, economic and political inclusion of allTarget 10.3 of the Sustainable Development Goals
Ensure equal opportunity and reduce inequalities of outcome, including by eliminating discriminatory laws, policies and practices and promoting appropriate legislation, policies and action in this regardClearly, not all people who use drugs are marginalized and not all marginalized people are people who use drugs. Nevertheless, marginalization can be viewed as contributing to drug use, just as drug use can be viewed as contributing to the marginalization of some users: drug use can cause a deterioration in living conditions, while processes of social marginalization can be a reason for initiating drug use. |43|
Since marginalization is not easy to measure directly, it does not lend itself to quantitative research. However, several categorical risk factors for marginalization have been shown to be linked to drug use, including unemployment, homelessness, incarceration, sex work and vulnerable youth (such as young victims of family abuse and violence). |44| For example, a cohort study among homeless people in the four largest cities of the Netherlands (Amsterdam, Rotterdam, The Hague and Utrecht) found that cannabis had been used in the past month by 43 per cent of adult homeless people and by 63 per cent of young homeless people. |45| A study carried out in Ireland found 67 per cent of homeless ex-prisoners to be drug-dependent. |46|
FIG. 5 Living situation of regular "crack" users in Brazil
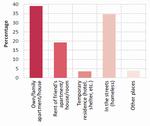
Click to enlargeSource: A profile of Users of Crack and/or Similar Drugs in Brazil (Brazil, National Drug Policy Secretariat, 2013).
High-risk behaviours, such as injecting drug use and sharing injecting equipment, are also reported to be high among homeless people. |47| Research conducted in 2015 by Homeless Link, a charitable company in the United Kingdom, found that 34 per cent of people "sleeping rough" (sleeping in uncomfortable conditions, typically outdoors) had used heroin in the previous month and 37 per cent had used "crack" or cocaine. |48| Elsewhere, a study focusing on the profile of regular |49| users of "crack" or similar smokeable forms of cocaine (thus excluding cocaine salt) in Brazil |50| found that more than a third of those users spent a significant time on the streets and that less than a quarter of them had been to secondary school, although more than 95 per cent had been in school at some point in their lives. The study also found that more than 70 per cent of the users shared their drug using equipment, a pattern which raises concerns about the transmission of infections, especially viral hepatitis. Moreover, prevalence of HIV among these users was eight times higher than the prevalence rate in the general population of Brazil (5.0 per cent versus 0.6 per cent).
Drug use itself can also contribute to marginalization. In some societies, the stigma of being drug users and discrimination drive people who use drugs to the margins of society. People with drug use disorders are frequently distanced from their communities and families. The marginalization and stigmatization of people who regularly use drugs also have a negative impact on their employment opportunities and social relationships. Stigma and social exclusion can lead to a loss of human capital, as people who use drugs are unable to contribute to or participate in a range of community activities such as civic duties, voluntary work, sports clubs, religious gatherings and cultural events. Stigma also contributes to poor mental and physical health, non-completion of drug treatment and increased involvement in high-risk behaviour such as sharing injecting equipment. |51|
Drug dependence and unemployment: a vicious cycle
FIG. 6 Unemployment� among past-month drug users in the United States, by drug type, 2013
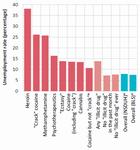
Click to enlargeSource: United States, National Survey on Drug Use and Health, Substance Abuse and Mental Health Services Administration (SAMHSA), Center for Behavioral Health Statistics and Quality, National Survey on Drug Use and Health, 2013; data extracted from the National Addiction and HIV Data Archive Program, hosted by the Inter-university Consortium for Political and Social Research at the University of Michigan (http://doi.org/10.3886/ICPSR35509.v3).
� For details, including an explanation of the methodological differences in the unemployment rate based on data from the National Survey on Drug Use and Health (NSDUH) and the Bureau of Labor Statistics (BLS), see the online methodology section of the present report.
There is a clear positive association between drug dependence and social disadvantage, including unemployment and poverty. The relationship between drug use and employment status is complex and characterized by reciprocal causality: drug use exacerbates the risk of unemployment, while unemployment increases the risk of drug use.
Drug use can hamper a person's employment prospects by reducing productivity and the chance of finding work. Conversely, unemployment can cause stress and anxiety, financial difficulties, dissatisfaction and disaffection, which are all risk factors for initiation, perpetuation, intensification or resumption of drug use. In the United States, for example, the prevalence of past-month use of any drug among the population aged 18 years or older averaged 18 per cent among the unemployed, 10 per cent among part-time workers, 8 per cent among full-time workers and less than 6 per cent among those in the "other" category, such as retirees. |52| Data from EMCDDA for 30 European countries |53| suggest that, as of 2013, among all persons accessing treatment for drug use disorders who were in the labour force, at least half were unemployed. |54| A UNODC study on drug use in Afghanistan also found distinct links between drug use and employment status. |55|
FIG. 7 Increased likelihood of being a past-month drug user among the unemployed population, compared with the population in full-time employment in the United States, by drug type, 2013
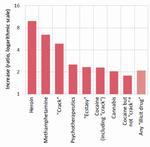
Click to enlargeSource: United States, National Survey on Drug Use and Health, SAMHSA, Center for Behavioral Health Statistics and Quality, National Survey on Drug Use and Health, 2013; data extracted from the National Addiction and HIV Data Archive Program, hosted by the Inter-university Consortium for Political and Social Research at the University of Michigan (http://doi.org/10.3886/ICPSR35509.v3).
� See the online methodology section of the present report.
A detailed breakdown of employment status among past-month users of drugs in the United States brings out different levels of association between drug use and unemployment across the various drug types. Heroin, methamphetamine and "crack" cocaine were the drugs most closely associated with unemployment, both in terms of the unemployment rate among past-month users and in terms of the increased likelihood of being a past-month user among the unemployed (compared with employed people). The unemployment rate among past-month heroin users was 38 per cent, while unemployed people were almost 10 times more likely to be heroin users than people in full-time employment (prevalence rates of 0.59 per cent and 0.060 per cent, respectively). The association was much stronger in the case of "crack" cocaine than cocaine in general (see figures 6 and 7).
There are several mechanisms whereby problem drug use can affect an individual's chances of finding and keeping a job. First, people with drug use disorders can suffer from a range of serious personal, health, lifestyle and other problems that need to be addressed before they are in a position either to complete welfare-to-work programmes successfully or to take up and retain paid employment. |56| Second, drug use may be associated with other factors, such as lack of qualifications, low levels of literacy and poor employment histories, which themselves reduce the competiveness of people who use drugs on the job market. |57| Third, additional barriers may arise from social circumstances, such as the exclusion of people from job opportunities because of a criminal record and the stigmatization of people who use drugs, with the resultant discriminatory practices by employers and providers of social services (such as child-care). Fourth, many people with drug use disorders may be acutely aware that limited skills, poor or no qualifications, gaps in their work history, particularly related to imprisonment, and a criminal record can make looking for a job extremely challenging, to the extent that it may seem a pointless venture. |58|
Drug use can limit the opportunities of a person entering or remaining in the workforce, whereas frustration caused by the failure to find adequate employment can increase drug consumption, creating a vicious cycle, particularly in the case of drug-dependent persons.
How stigma can affect the effectiveness of drug responses
Just as a good level of social development enhances the efficacy of government efforts to counter the drug problem, deficiencies in the social milieu may hamper efforts to reduce illicit drug supply and demand. In particular, the stigmatizing attitudes towards people who use drugs that may extend to staff in health-care services can get in the way of their ability to deliver effective treatment to drug users.
Several studies have identified stigma as a significant barrier to accessing health-care and treatment services for drug users, with some health-care providers holding negative beliefs about people with drug use disorders, including overuse of system resources, non-investment in their own health, abuse of the system through drug-seeking and diversion, and failure to adhere to recommended treatment and care. |59| |60| Surveys of health professionals have indicated that they may hold negative or stereotypical views of people with drug dependence, which are likely to compromise the provision of high-quality care, while studies of nurses found that negative and punitive attitudes towards people who use drugs are relatively common. Judgmental, unsympathetic or hostile attitudes and views held by health professionals are likely to discourage individuals with drug-related problems from accessing health-care services. |61|
Generally, PWID may be perceived as a threat to health-care staff, as well as the community, because they are a potential cause of fear and vigilance, partly as a result of the perceived threat of needle-related injuries and of transmission of blood-borne viruses. A study to examine the extent of discrimination and stigma related to hepatitis C infection experienced by 274 PWID in Sydney, Australia, found that over half (52 per cent) reported discrimination in health-care settings as a result of having tested positive for hepatitis C, and 65 per cent reported that such discrimination was a result of being a drug user, with females more likely than males to experience discrimination because of their status with regard to hepatitis C. |62| According to UNAIDS, health-care services may even exclude PWID or treat them badly when they ask for help. |63|
The punitive approaches of law enforcement authorities with regard to people who use drugs can contribute to their marginalization, particularly when those approaches lead to high levels of incarceration (for a more detailed discussion, see the subsection entitled "Criminal justice").
Drug responses and social development
Target 3.5 of the Sustainable Development Goals
Strengthen the prevention and treatment of substance abuse, including narcotic drug abuse and harmful use of alcoholDrug demand reduction efforts and the entire continuum of care for people who use drugs, when successful, reduce drug use and therefore its impact on public health. The benefits affect both the people who use drugs and society in general, and such efforts have proved effective in preventing the transmission of, for example, HIV and viral hepatitis. Drug use prevention programmes have also been shown to lead to a decrease in a range of other risky behaviours, such as aggressiveness and truancy.
Effective strategies for countering the drug problem exist, but it takes a well-developed framework to implement them effectively. Even at the level of monitoring the extent of drug use, developed countries are typically better placed than developing countries to assess the extent of the problem. For example, heroin use in Europe has undergone a significant decline in recent years, and this improvement has been attributed in part to increased effectiveness in drug demand reduction efforts, specifically a dramatic increase in treatment availability, which removed a significant proportion of the demand from the market. |64|
Experience has provided an abundance of evidence on how drug demand reduction programmes can have a positive impact. |65| |66| Programmes are more effective when they recognize that drug use can be the result of multiple causes, and when they incorporate not only drug-specific components, but also skills that help individuals to deal effectively with the challenges of each phase of life, such as relationship skills for adolescents or parenting skills for parents. The results are also enhanced when the interventions employ and expand the use of evidence-based tools systematically. Moreover, the entire continuum of care interventions can be even more effective when it incorporates evidence-based measures aimed at minimizing the adverse public health and social consequences of drug abuse, including appropriate medication-assisted therapy programmes, injecting equipment programmes as well as antiretroviral therapy and other relevant interventions that prevent the transmission of HIV, viral hepatitis and other blood-borne diseases associated with drug use. The implementation of evidence-based programmes remains at very low levels of coverage in many parts of the world |67| and is still under-funded. |68|
Impact of alternative development on social development
When successful, alternative development programmes also lead to the broader development of the affected communities. In Myanmar, for example, alternative development projects in Wa Special Region 2 resulted in several benefits on the health front: vaccinations reduced infant mortality and eliminated leprosy among children; and electricity and potable water were brought to some townships. In Thailand, alternative development resulted in increased access to education, health services and potable water, with a resulting decline in the incidence of malaria and smallpox. In Pakistan, alternative development efforts in Dir District, Khyber Pakhtunkhwa (formerly North-West Frontier Province), resulted in the provision of drinking water infrastructure, an effective immunization programme and the improvement of roads, thereby enhancing accessibility to social services. Alternative development programmes often create and strengthen social organizations and generally enhance the level of organization of rural communities, enabling progress on various fronts, especially when such programmes encourage the direct participation of beneficiaries in the design, planning and implementation of projects. A discussion of the social component of alternative development, including detailed examples, can be found in chapter II of the World Drug Report 2015.
Availability of drugs for medical and scientific purposes
Target 3.b of the Sustainable Development Goals
Support the research and development of vaccines and medicines [...], provide access to affordable essential medicines and vaccines, [...]Target 3.b of the Sustainable Development Goals is closely linked to the objective of drug control, which is to ensure access to controlled drugs for medical and research purposes while preventing diversion and abuse. In the preamble to the Single Convention on Narcotic Drugs of 1961 as amended by the 1972 Protocol, the parties to the Convention recognized that the medical use of narcotic drugs continues to be indispensable for the relief of pain and suffering and that adequate provision must be made to ensure the availability of narcotic drugs for such purposes.
Notwithstanding the clear intentions of the control system, 5.5 billion people, or three quarters of the world's population, have little or no access to medicines containing narcotic drugs and have inadequate access to treatment for moderate to severe pain. WHO estimates that each year 5.5 million terminal cancer patients and 1 million end-stage HIV/AIDS patients, as well as many other people with chronic, non-malignant pain, suffer untreated or under-treated moderate to severe pain, including 800,000 patients with lethal injuries caused by accidents and violence, patients with chronic illnesses, patients recovering from surgery, women in labour (110 million births per year) and paediatric patients. |69|
While some controlled substances play an important role in the management of pain and other medical uses, in some countries the strategies in place to prevent the abuse, misuse and diversion of controlled substances may sometimes affect the availability of those substances. Human Rights Watch reviewed the national drug control strategies of 29 countries and found that 25 of them failed to identify the issue of ensuring availability of controlled substances for medical and scientific use as an objective or to outline specific measures on this issue. |70|
Impact of other drug responses on social development
There are other ways in which the response to the drug problem, particularly efforts to counter the illicit supply of drugs, may impact health and social development. Eradication of illicitly cultivated crops, if not adequately complemented by initiatives to provide alternative livelihoods, may impact the livelihood of already poor farmers and their families. These aspects are discussed below, in the sections on economic development and environmental sustainability.
Furthermore, when the response to illicit drug use neglects the health aspects of drug use and treats the problem exclusively as a criminal offence, excessively focusing on punishment, consequences can ensue for the well-being of people who use drugs, of prison populations and of society in general. These aspects are discussed below, in the subsection on criminal justice.
Finally, when the response to the drug problem fails to take into account the particular needs of women, it may contribute to undermining the objectives of gender parity and of the empowerment of women and girls. This applies not only to direct interventions against the drug problem but also to the monitoring of drug use, as women are likely to be under-represented in research identifying prevalence, needs, risks and outcomes of drug use, leading to a gap in appropriate policy development and continuing to perpetuate a lack of understanding of women's specific needs and issues in that area. |71|
Various Sustainable Development Goals and targets make reference to economic aspects, but Goal 8, dealing with economic growth, and Goal 1, dealing with poverty, are probably the two most relevant in analysing the links between economic development and the drug problem.
Poverty, economic disadvantage and unemployment are some of the enabling factors of illicit crop cultivation and drug production. Economic aspects can also have an impact on the evolution of illicit drug markets, as variations in income levels and purchasing power may influence drug consumption patterns. Just as economic development has an impact on illicit drug markets, the drug problem can also have economic ramifications. The economic cost of drug use that is incurred, for example, when drug-using segments of the workforce do not receive adequate treatment, can impact on productivity. The costs associated with efforts by state institutions to help people who use drugs, such as efforts to provide treatment and rehabilitation, as well as law enforcement efforts, can also have an impact on government budgets.
Sustainable Development Goal 8. Promote sustained, inclusive and sustainable economic growth, full and productive employment and decent work for all
Impact of economic development on the drug problem
One way to look at how economic development affects the drug problem is to compare the latter across different countries on the basis of their economic development. Such an analysis provides a simplified view, as there are a multitude of factors that can play a role in shaping the drug problem of each country. Proximity to a drug-producing area or to a major drug trafficking route, for example, explains more than economic development the higher than global rates of opiate use in the Near and Middle East and South-West Asia or the higher rates of cocaine use (including "crack" cocaine) in South America and West Africa. Nevertheless, a global macrolevel analysis can still provide insights into how economic development may have a bearing on the drug problem, although the relationship between development and the drug problem needs to be viewed in dynamic terms.
Some patterns manifest themselves at the global level and can be seen in cross-country comparisons based on national indicators; other patterns are intrinsically tied to variations within countries and can be observed from socioeconomic indicators at the subnational level. Some patterns are evident when all drug types are considered together, some emerge when focusing on a single drug type and others can be observed in the interplay and the trade-offs between different drugs.
Economic development and drug use
FIG. 8 Prevalence of past-year use of drugs among persons aged 15-64, by drug category and national income, 2013
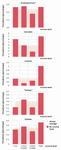
Click to enlargeSource: World Bank (for income levels) and UNODC estimates based on responses to the annual report questionnaire and other official sources (for drug use data).
* Including prescription stimulants.
Fig. 9 Prevalence of past-year use of opiates and cocaine versus per capita gross domestic product in countries with national data, 2013 or the latest year for which data are available
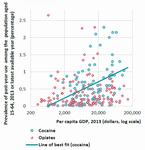
Click to enlargeSource: World Bank (for per capita gross domestic product (GDP)) and national data and estimates based on responses to the annual report questionnaire and other official sources (for drug use data).
The present section examines three overarching patterns whereby the level of economic well-being can influence drug use. First, the analysis uses cross-country comparisons to explore to what extent higher national income is conducive to the formation of illicit drug markets. Second, it uses subnational data to examine poverty, together with other forms of economic and social disadvantage, |72| as a risk factor for drug use. Third, it explores the relationship between socioeconomic status and different patterns of drug use.
The first pattern emerges from analysing indicators of drug use and economic development at the national level, as past-year use of drugs of all types is higher in "high-income" countries. As figures 8 and 9 show, cocaine is the drug most clearly associated with high income. The association between the problem of drug use and development can also be noted in terms of disability-adjusted life years (see figure 3, page 65).
Development and the evolution of drug use and consumer markets
Drugs that command a relatively high price, and ultimately greater profits for traffickers, may find an easier foothold in countries with relatively higher levels of per capita income. Although historically there have been different dynamics (including licit use) that have triggered the onset of the use of certain drugs, it is likely that income levels play an important role in enabling drug use to take hold and consolidate. Estimates by United States authorities show the magnitude of the amounts spent on drugs: in 2010, people in the United States who used a drug at least four times a month spent an average of $10,600 a year on cocaine, $17,500 on heroin and $7,860 on methamphetamine. |73| Total annual national expenditure related to the purchase of drugs amounted to $28 billion spent on cocaine, $27 billion on heroin and $13 billion on methamphetamine.
High-income countries are likely to have above-average drug prices and to be more attractive to international drug traffickers. This is particularly the case for cocaine and heroin, which originate in confined and well-defined areas of production, creating a scenario in which consumers worldwide compete for a product with a concentrated supply and leading to a situation in which supply gravitates to those places where the largest profits are to be made. In contrast, cannabis and, to a certain extent, some kinds of ATS can be sourced locally and on a very small scale, sometimes even by self-sufficient consumers.
This may help to explain, for example, why relatively undeveloped countries in Africa, which is not located near cocaine and heroin production areas, have typically had relatively low rates of cocaine and heroin use (prior to some of them becoming cocaine or heroin transit areas), whereas the same cannot be said of the prevalence rates of cannabis use, which have tended to be even higher than the global average. The use of unprocessed drugs such as opium and coca leaf remains largely confined to the places in which they are cultivated, where they have been used for centuries, while their derivatives have not always found a large market in the countries of origin. Heroin use, for example, is quite low in Latin American countries, although opium is cultivated in the subregion and is also processed into heroin.
Just as different drug categories display different patterns, different drug subcategories may also explain some of the complexities of illicit drug markets. For example, although the prevalence of past-year use of cocaine in South America is not very different from the figure for North America, the majority of cocaine users in the United States use cocaine in salt form, whereas in South America the use of other forms of cocaine (in base form) appears to be much more widespread. Moreover, some of the "products" consumed in base form in South America are siphoned off from intermediate stages of the cocaine-processing chain, when they may still contain high levels of impurities and are thus usually considered to have less potential to fetch high prices. In contrast, even "crack" cocaine (used for smoking) in the United States is believed to be obtained from a reverse step that reverts to base form (in this case, "crack") from salt form. Another possible illustration of this pattern is the case of the domestic heroin market in India. Reports by the Government of India indicate that heroin in the domestic retail market is considered to be of "low value" and that this reflects a distinct market from the heroin transiting India from Afghanistan and headed for other destinations.
Within the same country, different sub-types of a given drug category may have quite different patterns of association with the socioeconomic status of users. Economic well-being is not necessarily homogenous within a country and different subgroups may use different drugs to differing degrees. Indeed, certain links between drug use and socioeconomic well-being, such as income levels and employment status, are only visible at the subnational or community level.
For example, in the United States, the association of drug use with unemployment status is quite different in the case of cocaine salt and "crack" cocaine (see figures 6 and 7 in the section entitled "Social development"). Although this is sometimes attributed to "crack" being cheaper than cocaine salt, it is not clear whether, or in which sense, price can be a determining factor; one study, |74| based on data covering cities in the United States, determined that, in purity-adjusted terms, there were no consistent differences between prices of "crack" and cocaine salt. The study tentatively suggests that, given typical transaction sizes in practice, the minimum cost for achieving intoxication was frequently lower. However, data from a later study |75| indicate that the median costs of "crack" and cocaine transactions are comparable ($27 for cocaine salt versus $25 for "crack" cocaine). Because of their different modes of administration, the typical experience associated with "crack" use is shorter but reportedly more intense than that of cocaine salt, so it can be argued that users of cocaine salt would need to spend more to achieve the same level of intensity. The differences may also extend to the potential for users to develop tolerance and dependence.
Generally, even though wealthy societies appear to be more vulnerable to drug consumption, within those societies, economic and social disadvantage is a significant risk factor for drug consumption to translate into drug dependence and drug use disorders. Poverty is associated with drug use disorders, not because of any link with discretionary income but because poor people are more vulnerable and more likely to live on the margins of society. It is relative poverty and marginalization within one country that affects the development of drug use disorders, rather than absolute levels of income. Moreover, drug use can itself exacerbate poverty and marginalization, creating the potential for a vicious cycle.
Higher socioeconomic groups may play a separate role in facilitating the onset of recreational use as a first step in the subsequent formation and consolidation of illicit drug markets. The mechanisms that drive this interaction merit further study, but they may be attributable to a higher propensity to experiment, higher income levels, higher association with an urban location of residence and different patterns of entertainment among people in the higher socioeconomic brackets. A study on cannabis use demonstrated this phenomenon by drawing on evidence from France, Germany and the United States. The study showed how, at the outset, it was mostly well-educated men in the countries examined who started to experiment with cannabis use. Gradually, this shifted to men with low levels of education. Women followed at lower rates and the change was not as marked; moreover, the people who transitioned to daily cannabis use were predominantly those in the lower socioeconomic bracket. |76|
FIG. 10 Prevalence of past-year drug use and of drug abuse or dependence� in Colombia, by socioeconomic class,b 2013
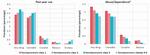
Click to enlargeSource: Observatorio de Drogas de Colombia, Estudio Nacional de Consumo de Sustancias Psicoactivas en Colombia — 2013, June 2014
� "Dependence" is defined according to the ICD-10 criteria of the World Health Organization, and "abuse" is defined according to the DSM-IV criteria of the American Psychiatric Association.
b The socioeconomic classes were ranked so that class 1 was the least wealthy and class 6 the most wealthy.This pattern is also consistent with data on drug use in Colombia, which show very distinct patterns for past-year drug use and for drug use disorders in different socioeconomic classes. In the case of cannabis and "ecstasy", for example, there is a progressive increase in rates of occasional (past-year) use with higher levels of socioeconomic status (see figure 10), but overall drug use disorders are associated with the lower socioeconomic classes.
Sustainable Development Goal 1. End poverty in all its forms everywhere
As mentioned earlier, poverty is a significant risk factor for drug use; conversely, drug use itself frequently places a significant strain on the finances of people with drug dependence and on their families' finances. The extent of the financial strain brought about by drug use may be related not only to the price of a drug but also to the potential of the person using the drug to develop a tolerance to that particular drug, and hence to its pharmacological properties. In the case of heroin, for example, it is believed that experienced users may seek much higher doses than first-time users. People with fewer economic resources who use drugs may also be exposed to higher levels of harm as they resort to cheaper variants of drugs. Lower prices may be associated with lower purity levels, which imply higher health risks because of the presence of adulterants, by-products and other substances.
The financial difficulties experienced by people with drug dependence are often corroborated by the methods found to have been adopted to generate income. One study in Brazil focused on the profile of regular |77| users of "crack" or other similar smokeable forms of cocaine (thus excluding cocaine salt). |78| The study estimated that 13 per cent of users had resorted to begging as a source of income during the preceding 30 days, 7.5 per cent were sex workers or had exchanged sex for money, 6 per cent had resorted to illicit activities linked to the sale or distribution of drugs and 9 per cent had resorted to other illicit activities.
Low income levels are relevant not only in themselves, but also in relation to the context and the society in which an individual lives, as income inequality within a society may contribute to the marginalization of the less wealthy. As discussed in the World Drug Report 2012, an analysis based on Gini coefficients indicated that countries with high levels of inequality (Gini coefficients exceeding 50) tended to face relatively higher levels of drug problems, mostly as transit or production countries. Societies characterized by high income inequality tend to be more prone to crime, and in some extremely unequal societies, members of marginalized groups may view involvement in criminal activities such as drug trafficking as the only feasible strategy for upward social mobility. Similarly, without realistic hopes of a better future, members of those groups may become disillusioned and more vulnerable to illicit drug use. |79|
Many drug-dependent persons are trapped in a vicious cycle of poverty and drug use because of a wide range of factors, such as family breakdown, lack of education and limited access to employment opportunities and health care. However, even though the causes of poverty and deprivation are to some extent social, they are experienced individually and those who experience them have their own set of reasons and motivations for responding to their circumstances in a particular manner. |80| Not everyone living in a poor community will succumb to drug dependence and it is important to recognize that not all people who are drug-dependent are to be found in the poorest socioeconomic groups.
In sum, poverty, together with other forms of social disadvantage, |81| is strongly associated with drug use disorders, both as a risk factor leading to drug use and as a consequence of drug use. Moreover, in some countries middle or upper socioeconomic classes are associated with higher levels of "recreational" drug use, which may simply be a manifestation of purchasing power or may reflect more willingness, or opportunities, to experiment with drug use.
Are developing countries following in the steps of developed countries when it comes to patterns of drug use?
The evolution of the global markets for some drug types has been led by the dynamics in developed countries. This is clear from the history of the illicit use of synthetic drugs and cocaine and, based on historical qualitative assessments, it is also true to a large extent for heroin — all drugs that require a certain degree of processing or synthesis. After emerging in developed countries, over time, consumption eventually tends to catch on in countries with lower levels of development. More broadly, the evolution of consumer markets in developing countries seems to follow patterns seen in developed countries (see the discussion below).
FIG. 11 Share of past-year cocaine and opiate users among the global population, cumulative with per capita gross domestic product, 2000 and 2013
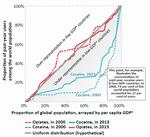
Click to enlargeSource: World Bank (for per capita gross domestic product (GDP)) and UNODC estimates based on responses to the annual report questionnaire and other official sources (for drug use data).
� Gross domestic product.
Figure 11 shows an overall shift in cocaine use from developed to developing countries between 2000 and 2013. Given the lack of data, the same analysis can only be done for opiates in general rather than specifically for heroin and only since the year 2000.
FIG. 12 Selected indicators of the use of heroin and other substances in China and the United States, 1990-2015
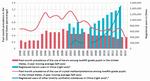
Click to enlargeSource: Office of the National Narcotics Control Commission of China; and Monitoring the Future study, Institute for Social Research, University of Michigan.
� Data for the period 1990-2001, 2006 and 2015 were not available.
b The category "other substances" includes mainly synthetic substances such as methamphetamine and ketamine; a comprehensive breakdown for all years was not available.Consumption of most synthetic drugs and new psychoactive substances (NPS) first emerged in the more developed countries before expanding in less developed countries. Prime examples are the emergence of methamphetamine in Japan and North America near the middle of the twentieth century, the subsequent emergence of "ecstasy" and other hallucinogens in North America and Europe and the ongoing proliferation of the consumption of NPS in Europe, Japan and North America. It is at a later stage when the use of these substances expanded in less developed countries; for example, the peak in methamphetamine use in the United States happened between 1995-2002, while in China methamphetamine use is a more recent occurrence and the available indicators do not yet show signs of reaching a peak (see figure 12).
The drivers of the emergence of synthetic drug markets in developed countries may be a combination of supply-side and demand-side factors. On the demand side, greater purchasing power, as well as potentially greater inclination and opportunities to experiment with substances for recreational purposes, may play a role. In the case of ATS, however, it appears that the substances' availability for other purposes, including their use in medicine, together with the associated potential for diversion, was crucial in triggering the onset of misuse. In addition, technological innovation and the presence of a variety of precursors and other chemicals in the licit markets facilitated the establishment of clandestine laboratories manufacturing synthetic drugs in developed countries, often close to demand. |82|
Apart from data on drug use, availability indicators also illustrate some patterns in the evolution of the development of illicit drug markets in developed countries and a certain replication of those patterns in the markets of less developed countries. The market in Europe offers a two-fold illustration of these dynamics: first, an apparent situation in which the market in Western and Central Europe may be the first to have become saturated and to have stabilized with respect to most drugs, with an ongoing surge in NPS (see figure 13); and second, an apparent consistent time lag between the situation in Western and Central Europe and the subsequent expansion in Eastern Europe (see figure 14). As with many other social phenomena, development may accelerate the diffusion and a certain homogenization of the drug problem. In effect, an analysis of reported expert perceptions of trends in illicit drug use made across drug types in 2012 also points in this direction: while there appears to have been an overall stabilization in countries of the Organization for Economic Cooperation and Development (OECD) since 2002, other countries tend to perceive the trend as increasing. |83|
FIG. 13 Long-term trends in drug seizures in Western and Central Europe, 1980-2014
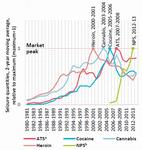
Click to enlargeSource: Responses to the annual report questionnaire and other official sources (for data on heroin, cannabis, cocaine and ATS); and EMCDDA (for data on NPS).
� Excluding "ecstasy" and prescription stimulants.
b Data for NPS refer to countries covered by the early warning system used by EMCDDA, namely the European Union member States, Norway and Turkey; data on NPS for 2014 were not available.FIG. 14 Comparison of seizure trends in Western and Central Europe and in Eastern Europe, by drug type, 1999-2014
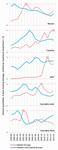
Click to enlargeSource: Based on responses to the annual report questionnaire and other official sources.
a Excluding "ecstasy" and prescription stimulants.
How does economic development influence drug trafficking?
Does globalization affect drug trafficking?
Facilitating trade and easing trade barriers are features of globalization that can potentially have an impact on drug trafficking. While the value of trade agreements in boosting economic development is not under question, by fostering the expansion of trade and global transportation networks, trade openness may also facilitate the cooperation and the formation of alliances among criminal organizations in different countries. Such cooperation expands the power and reach of cartels to distant markets and thereby strengthens their ability to evade detection by local law enforcement. Indeed, it has been argued that globalization has driven an overall decline in the retail prices of drugs by increasing the efficiency of their distribution, by reducing the risk premium involved in dealing drugs and by increasing the degree of competition in illicit drug markets. |84|
Strategies adopted to facilitate trade, such as free trade agreements and the establishment of free trade zones, export-processing zones, economic areas and customs unions, may reduce the opportunity for law enforcement authorities, specifically customs authorities, to monitor shipments from their origin to their destination. Such strategies shift the onus of monitoring trade from the country of destination to the point of entry into the broader economic area. This may potentially affect not only trafficking in illicitly produced drugs but also, depending on the specific arrangements, the diversion of licitly produced substances, particularly precursor chemicals, as the prevention of diversion comes to rely on internal market regulations and safeguards rather than on cross-border protocols. In addition, some agreements may extend to the free movement of people, making the detection and monitoring of drug traffickers more challenging.
Example of development programmes that may have triggered illicit cultivation In the mid-twentieth century, the Andean nations of Bolivia, Colombia, Ecuador and Peru coordinated efforts to develop road infrastructure into their Amazonian low-lands with the goal of interconnecting the Andean section of the Amazon basin, from Venezuela to Bolivia.� The Declaration of the Presidents of America, resulting from a meeting of the Presidents of the American States held in Punta del Este, Uruguay, in April 1967, crystallized the scope and ambition of this massive development plan and included the goals of laying the foundation for economic integration by completing the Carretera Marginal de la Selva and modernizing agricultural food production through development, agrarian reform and land settlement. In Peru, a badly conceived agricultural reform that was applied from 1970 onwards destroyed the agricultural companies, distributing the land and properties of the landowners ("gamonales") among their workers, leading to the loss of the jobs of many workers, who migrated in search of land and other economic opportunities.
There was an urgent need to expand the agricultural land base,b since agricultural modernization and demographic growth, coupled with vastly inequitable land distribution in the Andes, made hundreds of thousands of farmers redundant.c Colonization projects emerged to direct and sometimes follow migration flows of Andean farmers seeking land or a new start or fleeing violence.d, e, f, g, h
Map 1 shows the location of the development projects in the Andean subregion during this period, as well as the main locations of coca bush cultivation in the 1990s. Colombia opened projects in Meta along the Ariari, at El Retorno in Guaviare, near Florencia Caqueta and Puerto Asis, Putumayo;c, g i but preparations for construction of the road only started in 2012. Colonization projects in Colombia were quickly abandoned in favour of supporting spontaneous colonists, an approach viewed as efficient and effective.i, j Colonization projects east of the Andes in Ecuador (not shown on map 1) were small in comparison, directly associated with providing support for colonists along the single and late-starting oil extraction road.c, j Bolivia opened projects in Santa Cruz, Chapare and Alto Beni.e In Peru, special development projects began in 1980, along the Carretera Marginal de la Selva; examples being the special projects of Huallaga Central, Alto Huallaga and Pichis-Palcazu. Aimed at triggering the development of the local population, these projects enabled the settlement, with better development prospects, of Andean and coastal migrants.
Designed to bring socioeconomic development to the subregion, overall, these initiatives may have inadvertently set the stage for the subsequent increase in coca bush cultivation.
a-j See the online methodology section of the present report.
The literature presents various hypotheses about the effects of trade openness on the ability of the authorities to reduce drug trafficking. One study that examines the various theories concludes that trade openness decreases the interdiction capabilities of authorities in drug-consuming countries while increasing those of authorities in drug-producing countries. It also finds that greater openness to trade does not have a consistently significant effect on the interdiction capabilities of authorities in transit countries. |85|
Economic development and illicit crop cultivation and drug production
In the relationship between economic development and drugs, nowhere is the link more pronounced than in the case of the illicit cultivation of drug crops. Socioeconomic factors such as poverty and lack of sustainable livelihoods drive farmers in rural areas to engage in illicit crop cultivation and are manifestations of poor levels of development, which, alongside issues of governance, constitute the enablers of large-scale illicit crop cultivation in rural areas.
Socioeconomic data collected through UNODC crop monitoring surveys confirm that poverty is one of the enabling factors of the illicit cultivation of coca bush and opium poppy. For example, the latest survey of illicit cultivation in Myanmar |86| found that the reasons for illicit opium poppy cultivation were predominantly income-related, with village headmen indicating that, on average, the most important use of the income generated by illicit opium poppy cultivation in their villages was buying food, followed by paying debt and paying household property expenses. Most village headmen reported decreases in income among farmers who ceased cultivating opium poppy. Despite this, the average income in poppy-growing villages was still lower than in non-poppy-growing villages, |87| corroborating the thesis that it is the struggle of villagers to make ends meet that leads to their decision to engage in illicit cultivation.
Not all poor farmers are engaged in illicit cultivation, and for certain households and communities the decision to engage in illicit cultivations is related to development issues that go beyond income levels. In Afghanistan, it has been shown that villages growing opium poppy are further from market than non-poppy-growing villages and that there is a relation between opium poppy cultivation and the absence of basic development facilities such as access to power grids. |88| Lack of security and governance has also proved to increase the likelihood of individuals and communities engaging in illicit cultivation. |89|
Economic development can reduce the vulnerability of farmers to engage in illicit crop cultivation and drug production and can bring about a sustainable reduction in such cultivation. One of the clearest examples of successfully reduced illicit crop cultivation is the case of Thailand, where illicit cultivation of opium poppy was reduced from around 17,900 ha in the crop year 1965/1966 to 129 ha in 2003/2004. Although progress was achieved in the context of a broad set of development objectives, the reduction of illicit opium poppy cultivation was also explicitly recognized as one of those objectives. Indeed, the case of Thailand illustrates how two streams of intervention — economic development and drug control — have worked well together to help the hill tribes to benefit from the overall progress made and provide them with alternative sources of income and have led to illicit opium poppy cultivation remaining relatively limited since 2004 (265 ha in 2013, the latest year for which estimates are available).
MAP 5 Agricultural development projects in the Andean countries in the 1960s and 1970s and coca bush cultivation in the early 1990s
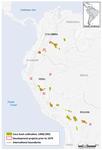
Click to enlargeSource: L. M. Davalos, K.M. Sanchez and D. Armenteras, "Deforestation and Coca Cultivation Rooted in 20th-Century Development Projects" (forthcoming).
Notes: The boundaries and names shown and the designations used on this map do not imply official endorsement or acceptance by the United Nations.
If development interventions are not sensitive to the vulnerabilities of communities to specific drug issues, they may inadvertently trigger dynamics that increase illicit cultivation. One example is the impact of large development programmes in the early 1960s and 1970s in the Andean subregion, where programmes to modernize agriculture and develop infrastructure were initiated to bring socioeconomic development to the subregion. At the same time, these dynamics may have also set the stage for later increases in coca bush cultivation (see map 1 and box on page 82).
In countries with large-scale illicit crop cultivation in rural areas, the elimination of such cultivation can have an impact on the income and employment opportunities of labourers and farmers. Only when efforts to control illicit crop cultivation are accompanied by development measures to ensure alternative livelihoods can communities enjoy positive economic development.
Two contrasting examples can be seen in Afghanistan, where the illicit opiate economy has created a significant link between the labour market and opium poppy cultivation. The opium ban enforced in Taliban-controlled territory in the growing season 2000/2001, which resulted in a very pronounced drop in opium poppy cultivation, had a negative effect on the rural economy. It led to a significant rise in the level of opium-denominated debt and a dramatic increase in levels of rural unemployment. The economic downturn and problems repaying accumulated debts led to increased migration to Pakistan and the mortgaging of land. |90|
The 2005 opium ban in Nangarhar Province, in southern Afghanistan, offers a contrasting example, as it was accompanied by significant development investments in physical and social infrastructure. After the ban, Nangarhar witnessed significant economic growth between 2009 and 2011, experiencing dramatic increases in job opportunities and wage rates. In the lower-lying districts of the province, along the Kabul river, the initial response to the ban was often to replace opium poppy with a combination of wheat and another cash crop (such as onions in the district of Surkhrud and green beans in the district of Kama), but many farmers adapted to the growing demand from the rapidly expanding urban centres of Jalalabad and Kabul, cultivating a wide range of annual and perennial horticultural crops. Many households experienced a pronounced increase in income-earning opportunities; the economic growth is reflected in the expanding footprint of the markets in the district centres of Kama and Surkhrud, as well as in the district of Jani Khel. |91| Although the improvement in Nangarhar could be observed over a number of years, other more recent developments related to governance issues now threaten to undo the progress achieved in that province. |92|
The region of San Martín in Peru is another example of positive economic development occurring in parallel with efforts to reduce illicit drug supply in rural communities affected by illicit cultivation. Over the period 1996-2000, an average of 3,700 ha of illicit coca bush cultivation were eradicated each year, while agricultural cooperatives were set up and significant international funds were invested. The subsequent years saw significant economic growth in the region, together with sustained eradication of coca bush, even as coca bush cultivation in the rest of Peru rose. In the period 2001-2009, the regional gross domestic product (GDP) rose by 73 per cent.
Impact of the drug problem on economic development
The economic impact of the drug problem is multifaceted and ranges from creating an economy based on illicit activities in the rural areas of developing countries affected by large-scale illicit crop cultivation to discouraging business by fuelling violence, corruption, extortion and protection rackets, notably in transit countries, and to creating costs associated with consumption for individual consumers and for society in general.
Economic profits are generated across the entire chain of illicit drug production and distribution, but it is at the retail stage that profits are typically highest. UNODC, for example, estimated that, in 2009, the average wholesale price of cocaine in Bolivia (Plurinational State of), Colombia and Peru was only 1 per cent of the retail price in the United States (after taking purity levels into account), while the corresponding percentage in Mexico was 7 per cent. |93| |94| As a result, in absolute terms, only a small component of the immediate economic footprint of the global illicit trade in heroin and cocaine is to be found in coun-tries where illicit cultivation of coca bush and opium poppy is concentrated. A recent UNODC report on the illicit flow of trafficked opiates from Afghanistan along the Balkan route found that, in the period 2009-2012, the total gross profit averaged $357 million per year in Afghanistan, compared with $28 billion along the rest of the Balkan route.
However, the size of the illicit economy associated with drugs, relative to the licit economy, tends to be higher in drug-producing countries than in the consumer markets. This is partly because the licit economy in some drug-producing countries is relatively small and partly because supply is concentrated in those few countries. For example, UNODC estimated the total value of the illicit opiate economy in Afghanistan to be $2.8 billion in 2014. This figure, equivalent to 13 per cent of the country's GDP, considerably exceeded the value of the export of licit goods and services in 2014. |95| Based on UNODC estimates |96| of total gross profits related to cocaine trafficking, profits in Colombia were equivalent to 4.1 per cent of that country's GDP in 2009, compared with 0.2 per cent in the case of the United States and 0.36 per cent in the case of the United Kingdom.
In Afghanistan, the illicit economy provides access to labour for a large number of farmers and a source of income for other people involved in the trade and has therefore become embedded in the licit economy.
The macroeconomic impact of the opium economy depends, in particular, on how much of its proceeds actually enter the Afghan economy and how this is allocated between consumption, investment and savings, as well as, more generally, how it translates into demand for domestic and imported goods and services. A joint study by the World Bank and UNODC argues that, whereas farmers and wage labourers can be expected to spend rather than save the bulk of their earnings from the opium economy, mostly on domestic goods and services, opium traffickers and processors are likely to save a substantial proportion of their revenue and spend more on imports. While the opium economy results in a significant net inflow of money into Afghanistan's balance of payments, this is reduced by drug-related outflows of funds (including capital flight, as well as spending on imports). |97| |98|
TABLE 3 Overview of economic evaluations of the costs of the drug problem
Study Period covered by the data Cost per capita Cost as a percentage of GDP� Gonçalves, Lourenço and da Silva (2015) 2010 25 euros (1999 prices) .. Garcia-Altés and others (2002) 1997 .. 0.07 Mark and others (2001) 1996 .. .. Wall and others (2000) 1996 Can$ 43-69b .. Healey and others (1998) 1995 .. .. Mills, Skodbo and Blyth (2013) 2013 .. .. Lievens and others (2016) 2012 66 euros 0.19 Kopp (2015) 2010 36 euros 0.12c Potapchik and Popovich (2014) 2008 .. .. Vanags and Zasova (2010) 2008 .. 0.4 Observatorio Argentino de Drogas (2010) 2008 Arg$ 94 0.9 Observatorio Peruano de Drogas (2010) 2002-2010 US$ 6.8 n/a Slack and others (2009) 2005/2006 .. 0.7 Collins and Lapsley (2002) 1998/1999 .. 0.85 Collins and Lapsley (2008) 2004/2005 .. 0.88d Rehm and others (2006) 2002 Can$ 262 .. Godfrey and others (2002) 2000 .. .. Gordon and others (2006) 2003/2004 .. .. United States Office of National Drug Control Policy (2004) 1992-2002 2002: US$ 650 2002: 1.7 United States Department of Justice (2011) 2007 .. .. Miller and others (2006)e 1999 .. .. Fernandez (2012)e 2006 .. .. Sources: See the online methodology section of the present report.
Notes: The studies may use different methodologies and take into account different aspects of the drug problem; hence, the results are not directly comparable. Two dots (..) indicate that data are not available or are not reported separately.
� Gross domestic product.
b The cost calculation was restricted to untreated opioid dependence in one city.
c The percentage refers to public expenditure only.
d The cost calculation in the table pertains exclusively to "illicit drug abuse".
e These two studies focus specifically on the crime-related aspect of the drug problem.The cost of the drug problem and drug control policy: the economic perspective
In general, economic studies can be used to quantify the cost borne by society attributable to the drug problem. A review of the literature reveals 22 such studies worldwide (see table 1) that attempt to assess, at the national level, the overall cost attributable to the various aspects of the drug problem (or at least drug use). |99| The studies go beyond tallying the actual monetary disbursements that were made in connection with drugs. While they include the costs associated with the various forms of intervention in response to the drug problem, such as prevention, treatment and law enforcement (the "direct costs"), they also assign a value to other costs, such as the loss of productivity in the workplace associated with drug use ("indirect costs"). A large number of factors, including absenteeism, accidents and conflicts in the workplace, may lead to a decline in productivity as a consequence of drug use.
A review of the literature shows large variations in the cost of illicit drugs in the 14 countries examined. First, the cost in percentage of GDP ranged from 0.07 to 1.7 per cent. Second, the majority of the countries registered a high percentage of costs attributable to drug demand and supply reduction interventions (such as prevention, treatment and law enforcement), incurred to address the drug problem, as opposed to productivity losses and any other indirect costs. Some countries, however, were confronted with considerable productivity losses (57-85 per cent of the total cost). The lost productivity was the result of high levels of morbidity and premature mortality caused by illicit drug use; together with the high number of incarcerations for drug-related crime. Third, the composition of the costs of the response differs from country to country. The studies found, in most countries, high costs for law enforcement compared with health costs. The only exceptions were studies in two European countries, which registered medical costs of 60-65 per cent of the total cost of the interventions in response to the drug problem.
FIG. 15 Breakdown of the costs of drug use borne by society
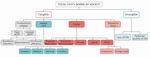
Click to enlargeSource: Adapted from D. Collins and others, "Introduction; improving economic data to inform decisions in drug control", Bulletin on Narcotics, vol. LII, Nos. 1 and 2 (2000), fig. II.
The above-mentioned cost studies were conducted mainly in high-income countries. Most of the studies focused on the costs associated with drug consumption (rather than drug production), by using a hypothetical scenario in which there was no drug use. Indeed, it appears that the established standard methodology and analytical framework for such studies are well suited to dealing with drug use but are less well suited when it comes to dealing with illicit drug production and trafficking (for a standardized conceptual breakdown of the costs of drug use, see figure 15).
One of the studies, an economic study in Chile, |100| is rather atypical in that it focused on the impact of drug-related crime. The study covered infringements of the national drug law, as well as other types of crime, such as robbery, sex-related crime and homicide, that can be attributed to drug use or drug trafficking through any of the following three mechanisms: the psychopharmacological link (drug users committing crime under the influence of drugs); the economic-compulsive link (drug users committing crime to fund their drug consumption); and the systemic link (crime related to drug trafficking that was not prosecuted under the drug law). |101| The costs taken into account consisted of the costs of drug law enforcement incurred by the various relevant institutions (mainly the police, the judicial system and the penitentiary system), as well as the cost of lost productivity resulting from incarceration of perpetrators of the above-mentioned crimes.
The study quantified these costs in 2006 at $268 million. A breakdown by type of crime shows that offences against the Chilean drug law per se only accounted for about one third (36 per cent) of the total costs, while the majority (60 per cent) of the costs could be attributed to robbery, including violent robbery. An independent breakdown by type of cost shows that the largest share of drug law enforcement costs was borne by the police (32 per cent of the total), followed by the penitentiaries (25 per cent) and the judicial system (17 per cent). Productivity losses attributable to incarceration for drug-related crimes accounted for virtually all of the remaining costs. The costs were also broken down by drug type, cocaine base ("cocaine base paste") being identified as the drug with the biggest impact, accounting for more than half of the cost, ahead of cocaine salt and cannabis.
Although the economic studies discussed above generally take into account a wide variety of costs that arise directly and indirectly from the drug problem, this is usually limited to costs that can be quantified in monetary terms. Non-tangible costs, such as loss of life or impaired quality of life, are frequently not quantified; and when they are quantified, it is usually done with reference to a non-monetary unit of measure, such as "years of life lost" or "years lived with a disability". While such studies can be very useful in assessing the economic toll that the drug problem has taken on society, other considerations also need to come into play when assessing the impact of the world drug problem and devising policy responses.
C. ENVIRONMENTAL SUSTAINABILITY
Environmental sustainability is embedded throughout the goals of the 2030 Sustainable Development Agenda. Goal 1, ending poverty, is closely linked to Goal 2, target 2.4 of which is to ensure sustainable food production systems and implement resilient agricultural practices. Complementary to this are Goal 13 (combating climate change) and Goal 15 (sustainably managing forests and combating desertification, land degradation and biodiversity loss). Water availability and management are covered in Goal 6, target 6.3 of which includes reducing pollution, eliminating dumping and minimizing the release of hazardous chemicals and materials.
The illicit cultivation and production of narcotic drug crops touch on all of these concepts. The present section describes how the illicit production of drugs and the drug control response can have adverse effects on ecosystems, for example, by resulting in the clearing of forests to illicitly cultivate drug crops. This section also reviews evidence on how efforts to reduce illicit drug supply may influence the expansion of illicit (and licit) farming activities to new, fragile or eco-sensitive areas; it also explains how well-designed alternative development interventions can improve biodiversity conservation, thereby mitigating climate change.
Illicit drug crop cultivation and drug production and trafficking: their impact on the environment
Deforestation
TABLE 4 Breakdown of deforestation into licit and illicit components: a summary of four studies : comparing side-by-side licit and illicit cultivation, by study and region
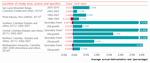
Click to enlargeNote: The "average annual deforestation rate" represents the average annual forest loss over the reference period, expressed as a percentage of the corresponding forest area at the beginning of that period.
� Maria A. Chadid and others, "A Bayesian spatial model highlights distinct dynamics in deforestation from coca and pastures in an Andean biodiversity hotspot" , Forests, vol. 6, No. 11 (2015).
b UNODC and Ministerio del Medio Ambiente del Perú, "Analisis económico de las actividades causantes de la deforestación en Pichis-Palcazú" (Lima, 2011).
c L. M. Dávalos and others, "Forests and drugs: coca-driven deforestation in tropical biodiversity hotspots", Environmental Science and Technology, vol. 45, No. 4 (2011), pp. 1219-1227.
d D. Armenteras, N. Rodriguez and J. Retana, "Landscape dynamics in northwestern Amazonia: an assessment of pastures, fire and illicit crops as drivers of tropical deforestation", PLoS ONE, vol. 8, No. 1 (2013).Deforestation is the principal environmental concern resulting from illicit crop cultivation, in particular coca bush cultivation in South America, opium poppy cultivation in South-East Asia and, to some extent, cannabis cultivation. Deforestation can be a direct or indirect result of illicit crop cultivation: it is a direct result when a piece of woodland is cleared for opium poppy or coca bush cultivation; and it is an indirect result when the various mechanisms associated with illicit crop cultivation, including licit agricultural activities, the formation of pastures and other forms of development and encroachment, have an influence on deforestation.
Target 15.2 of the Sustainable Development Goals
By 2020, promote the implementation of sustainable management of all types of forests, halt deforestation, restore degraded forests and substantially increase afforestation and reforestation globallyDirect deforestation
Farmers may encroach upon forest to illicitly cultivate crops such as coca bush, opium poppy or cannabis plant in remote areas for two reasons: the poor socioeconomic conditions of farmers at the agricultural frontier may push them to look for cash crops; and the illicit nature of this activity and the necessity to keep it a clandestine activity may spur a move to relatively remote areas.
Quantifying the extent of direct deforestation due to illicit cultivation, and the measurement of deforestation in general, is difficult. The net change in forest area over a given period may not reflect the complexity of the process, as losses in one place may be masked by gains in another, or the first transition from forest to non-forest may not be captured. Finally, illicit cultivation is not the only cause of deforestation and, as it often comes with other driving factors, the scale of direct deforestation resulting from such cultivation needs to be put in the context of the broader phenomenon.
According to UNODC estimates, over the period 2001-2014, an annual average of 22,400 ha of coca bush cultivation replaced forest in Colombia. |102| These estimates are done on a year-on-year basis and are therefore much less subject to the limitations associated with long gaps between snapshots in time. Although not directly comparable, data from the Food and Agriculture Organization of the United Nations indicate that net forest conversion in Colombia from all causes averaged 116,000 ha/year over the period 2001-2012; at the same time, the total loss of land with detectable tree cover (over all tree cover classes) averaged 209,900 ha/year. |103| However, specific studies in the Andes that focus more on the relative extent of forest conversion to illicit cultivation compared with other forms of land use suggest that the share of deforestation attributable to direct replacement by coca bush cultivation may be lower than the simple comparison above would suggest.
UNODC undertook a study of a risk area in Colombia of 12.4 million ha (defined as all locations within 1 kilometre of a coca bush cultivation site identified in the period in question) that included an assessment of deforestation. |104| The study found that a total of 2.6 million ha of forest had been lost in that area over the period 2001-2006, of which 5.3 per cent could be directly attributed to coca bush cultivation. A follow-up study |105| over a longer time period (2001-2012) showed that 1.2 per cent of the lost forest area was occupied by coca at the end of the period.
Another study, in the San Lucas mountain range of Colombia, reports land-use data for 2002, 2007 and 2010, based on satellite imagery, which suggest that the share of deforestation attributable to illicit coca bush cultivation was below 2 per cent during the periods 2002-2007 and 2007-2010. This does not, however, account for the possibility of conversion to licit use after deforestation for coca bush cultivation during those periods. |106| Aside from capturing the exact transition from forest to non-forest, which is difficult to attribute to coca bush cultivation or other activity, it clearly emerges from such studies that in the long run, most of the deforested areas became pastures and licit crop cultivation areas, and relatively small parts were dedicated to coca bush cultivation. One long-term study in Peru that analysed imagery from 1986, 1993 and 2007 covering a total area of 1.36 million ha in Pichis-Palcazú concluded that, by 2007, 269,000 ha had been deforested, of which 57 per cent consisted of pasture and the remainder consisted mainly of agriculture, with coca bush cultivation occupying only 0.39 per cent of the area. |107|
Indirect deforestation
The above-mentioned studies show that overall deforestation can only be directly attributed to coca bush cultivation to a small extent. Coca bush cultivation takes place in parallel with other human activities that cause deforestation, but this does not mean that there is necessarily a causal relationship between coca bush cultivation and deforestation in general.
Various mechanisms can determine an indirect influence of illicit cultivation on deforestation rates. Farmers who are willing or inclined to engage in such cultivation would naturally penetrate deeper into forests in order to conceal their activity, and this could gradually attract further expansion, licit agriculture, the formation of pastures and other forms of development and encroachment. Profits made by higher-level organizers involved in large-scale consolidation of farm-gate products and the processing of crops into end products such as heroin and cocaine might generate the need for laundering proceeds through activities such as cattle ranching, pasturage and logging, which themselves contribute to deforestation. Moreover, certain characteristics of illicit cultivation areas, such as little (or no) security and weak rule of law, may drive other illegal activities that cause deforestation, such as illegal logging and illegal mining.
MAP 6 Deforestation, 2000-2014, and the risk of illicit opium poppy cultivation in the Lao People's Democratic Republic and Myanmar
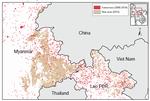
Click to enlargeSource: UNODC opium poppy risk maps; and M. C. Hansen and others, "High-resolution global maps of 21st-century forest cover change", Science, vol. 342, No. 6160 (November 2013).
Notes: The boundaries and names shown and the designations used on this map do not imply official endorsement or acceptance by the United Nations.
Several in-depth analyses have focused on the link between illicit cultivation and deforestation in Colombia (see box on page 89). Several variables were considered in order to investigate the potential effect of illicit crop cultivation systematically, but there is little empirical evidence to support the clear impact of such cultivation on overall deforestation, while outcomes vary from municipality to municipality. For example, in some particular cases in Colombia (i.e. Chocó, Nariño), high levels of coca bush cultivation were in fact directly related to high levels of deforestation. In general, deforestation and coca bush cultivation take place in the same areas, but this does not mean that more coca bush cultivation leads to more deforestation. It seems that actions, conditions and policies to provide incentives for frontier development drive deforestation, and coca is a crop that thrives in those environments. Ultimately, with increased development, the area under coca bush cultivation decreases, but deforestation continues, unless specific countermeasures are taken.
A similar exercise was undertaken to examine the potential relationship between deforestation and opium poppy cultivation in South-East Asia. In this case, maps were used to indicate areas with a high risk of opium poppy cultivation in the Lao People's Democratic Republic and Myanmar. The results of the modelling exercise did not show any evidence of a positive association between the risk of opium poppy cultivation and the probability of deforestation. This suggests that other factors, possibly socioeconomic factors not included in the model, are the main drivers of deforestation, of which the displacement of forest by opium poppy cultivation is only one component.
Does coca bush cultivation drive deforestation? A case study in Colombia While some studies indicate that there is a relationship between illicit cultivation and deforestation, other in-depth analyses have not confirmed this link and there is little empirical evidence of the impact of illicit cultivation on deforestation. A comparison of deforestation rates in Colombian municipalities and the extent of illicit cultivation fails to bring out clear overarching patterns. After several potential covariates other than coca bush cultivation were included in the model, such as urban population density, road density, the initial forested fraction, the fraction of the population with unsatisfied basic needs and eradication by aerial spraying, the best-fit model indicated that coca bush cultivation was not a significant determinant of deforestation rates.
One studya concluded that illicit crop cultivation is a driver of forest fragmentation through the perforation of forests. However, it is not clear if this results in a detectable impact in actual deforestation rates, and the study adds that some of the areas affected are later regenerated.
Another studyb set out to systematically isolate the potential effect of illicit crop cultivation as a catalyst of forest loss. The model measured the spatial proximity of coca bush cultivation in two ways — the distance to the nearest coca bush cultivation site and the area under such cultivation in the surrounding square kilometre — and examined how the probability of deforestation varied as a function of these two variables. Other variables usually associated with the probability of deforestation were also included in the model: the proportion of forest remaining,c distances to roads and rivers,d e f biophysical characteristics related to agriculture in general, such as climate, slope and aspectg and the protection status of the land.h The analysis did yield a certain link between coca bush cultivation and deforestation in southern Colombia only, where the probability of deforestation increased with the density of the coca bush cultivation and decreased with the distance from the nearest coca bush cultivation site. Once socioeconomic variables were included, the study did not support the thesis that coca is very different from other crops; instead it hypothesized that what sets municipalities growing coca bush apart is poor rural development, the underlying cause that enables a positive association between population growth and deforestation.
a-h See the online methodology section of the present report.
Deforestation as a result of drug trafficking
Another aspect of the illicit supply of drugs that may have repercussions on the environment is cocaine trafficking. Instances of deforestation stemming from such trafficking have been recorded in Petén, Guatemala, |108| and in eastern Honduras. |109|
FIG. 16 Forest loss and number of primary cocaine trafficking movements in eastern Honduras, 2004-2012
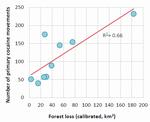
Click to enlargeSource: K. McSweeney and Z. Pearson, "Prying native people from native lands: narco business in Honduras", NACLA Report on the Americas, vol. 46, No. 4 (2013).
The simplest way in which trafficking facilitates encroachment is the clearing of strips of forest to enable the take-off and landing of light aircraft. However, the phenomenon may extend beyond this, as it can trigger violent land grabs, generate conflict over land tenure, attract not only licit but also other illicit activity and, as mentioned earlier, generate a need to launder illicit proceeds, a need that can be addressed by converting forest for activities such as cattle ranching. One such example may have occurred in the Maya Biosphere Reserve in Guatemala, |110| |111| a vast protected area where drug traffickers may have been able to take over land and impose their territorial control through violence. |112| Rapid increases in the local cattle inventory are thought to respond to the need to launder earnings from drug trafficking. |113| Local smallholders may "sell" the community lands in the reserve under coercion from drug traffickers and then move on, generating more deforestation. |114|
A quantitative link between drug trafficking and deforestation has been made in the case of Honduras. Forest loss in eastern Honduras over the period 2004-2012 appears to correlate with the number of registered air and maritime landings of cocaine shipments from South America to Honduras, as recorded in the Consolidated Counterdrug Database of the United States Office of National Drug Control Policy. Three interrelated mechanisms may explain this relationship: direct deforestation from landing strips and illegal roads; indirect deforestation from land grabs leading to greater pressure from displaced agriculturalists; and privatization of the public land to create "narco-estates" and launder trafficking assets. |115| The last variant often takes place at the expense of indigenous lands. |116|
Pollution and health hazards arising from chemicals and waste
Target 6.3 of the Sustainable Development Goals
By 2030, improve water quality by reducing pollution, eliminating dumping and minimizing release of hazardous chemicals and materials, halving the proportion of untreated wastewater and substantially increasing recycling and safe reuse globallyClandestine laboratories processing and manufacturing plant-based and synthetic drugs require significant quantities of precursors and other chemicals, many of which are hazardous to human health and potentially damaging to the environment. These chemicals include solvents; metals and salts; and acids and bases. Exposure to such chemicals can result in numerous health complications, ranging from eye, nose and throat irritation to liver and kidney impairments and bleeding and corrosion in the lungs. Some carry a risk of fire or explosion. |117| Health hazards are of particular concern in the case of synthetic drugs manufactured in urban settings, with a high risk of exposure for large segments of the population, but they also affect individuals who, often because they have no viable alternatives, work in establishments manufacturing plant-based drugs, frequently in inhumane and exploitative conditions. |118| The by-products and unused chemicals are frequently disposed of in urban sewerage systems, other urban settings or, in in the case of processing of plant-based drugs in non-urban areas, the natural environment, including rivers and forests.
The consequences in urban settings not only pose health risks but may also have an impact on the urban and industrial environment. According to the European Police Office (Europol), criminals engaged in the illicit manufacture of drugs may resort to simply dumping chemicals, burying them in the ground, leaving them in stolen trailers and draining liquids into sewerage systems, into or onto the ground or into surface water. Other techniques involve burning waste in stolen motor vehicles or mixing the chemicals with other chemical waste prior to releasing them into the open sea from maritime vessels. |119|
FIG. 17 Regional variation in reagents used to process one oil drum� of fresh coca leaves into coca paste in Colombia
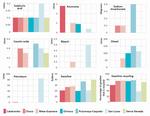
Click to enlargeSource: UNODC, Características Agroculturales de los Cultivos de Coca en Colombia (Bogotá, Sistema Integrado de Monitoreo de Cultivos Ilícitos, 2006).
� Approximately 87.5 kg of fresh coca leaves.
The chemicals used in the illicit supply chain of cocaine and opiates also contribute to pollution and health hazards in rural environments. In late 2005 and early 2006, UNODC undertook a systematic study of the illicit cultivation and processing of coca bush in Colombia, based on a nationwide sample of 1,300 coca bush growers, categorized by geographical region and by landscape. |120| Most of the agrochemicals found in the study to be used by coca bush growers were legal. A comparison of the use levels of the most commonly used legal agrochemicals with the manufacturers' recommendations indicated that, overall, coca bush growers in the study |121| reported using quantities of herbicides and pesticides within the range used by other tropical agriculturalists.
The study also investigated the use of reagents in the illicit processing of coca bush. The detailed data on reagents indicate: a distinct regional variation in the reliance on different organic solvents, whether gasoline, diesel or petroleum; complete dependence on sulphuric acid; and high levels of gasoline recycling, with variation related to fuel costs. There is potential for pollution by the use of the above-mentioned substances by the great number of laboratories, which are scattered throughout the Amazonian forest; however, the combination of high rainfall and reuse probably reduces the environmental impact of these sources. Indeed, in the early 1990s, field observations in Chapare, Bolivia, found that rainfall quickly diluted chemical spills. |122|
Water depletion and salinization
Target 15.3 of the Sustainable Development Goals
By 2030, combat desertification, restore degraded land and soil, including land affected by desertification, drought and floods, and strive to achieve a land degradation-neutral worldIn Afghanistan, opium poppy cultivation places an additional strain on the availability of water in areas already affected by water scarcity, and the irrigation methods used also contribute to salinization of desert areas.
According to one report, |123| in the Province of Helmand, which continues to be affected by high levels of opium poppy cultivation (covering 27 per cent of arable land in 2014), the combination of drought in the period 1999-2001, unsustainable development and withdrawals for irrigation resulted in a reduction of 98 per cent of the water flow along the lower Helmand river and the complete loss of the formerly rich downstream wetlands. In addition, drought appears to have intensified over time. The real-time record of global precipitation anomalies in the growing seasons (winter and spring) in Afghanistan from winter 2000-2001 until spring 2014 indicates that precipitation in that period was within 10 mm per month of the average in the reference period 1979-2000 in 14 out of the 28 growing seasons, while it was below that range in 12 seasons and above that range in just 2 seasons. At the same time, population growth has not abated, leading to intensification of cropping at the upstream end of canals. |124| Opium poppy cultivation contributes to water scarcity in two ways: by hoarding water from the irrigation system; |125| and by rendering financially viable pumping from the aquifer through tubewells. |126| At times, well-connected and locally powerful opium poppy growers were able to grow opium poppy by the roadside, as they did in Chahar Bolaq, to the extent that no water was available downstream. |127| In contrast, the growers dependent on tube-well irrigation north of the Boghra canal are among the least powerful and most marginal farmers in central Helmand. |128| Nevertheless, the returns on opium poppy enabled even those growers — at least for a while — to pay for the considerable costs of acquiring (or renting) and fuelling pumps, lowering the water table and ultimately degrading the marginal lands. |129| Sustained opium poppy cultivation may have depleted the already low capacity of the soil, leading to decreasing opium yields (such as the exceptionally low yield in the south in 2015), while the process of degradation may have been exacerbated by poor water management.
Biodiversity and protected areas
Target 15.5 of the Sustainable Development Goals
Take urgent and significant action to reduce the degradation of natural habitats, halt the loss of biodiversity and, by 2020, protect and prevent the extinction of threatened speciesOne of the concerns associated with illicit cultivation is its possible effect on biodiversity. Rather than being evenly distributed throughout the world, biodiversity is concentrated in lowland moist tropical forests, |130| |131| while montane tropical and subtropical forests are recognized as biodiversity hotspots, hosting a large number of species with a small known habitat. |132|
The tropical Andes are the world's most biologically diverse hotspot, accounting for 7 per cent of all plants and 6 per cent of all vertebrates; the Choco lowland forests along the Pacific coast also host a disproportionately large amount of plants and vertebrates. Opium poppy cultivation in the Andes is of particular concern, as the altitude suitable for such cultivation also corresponds to the especially vulnerable Paramo and sub-Paramo ecosystems. |133| To the extent that opium poppy cultivation replaces these ecosystems, it represents one of several threats, along with licit agriculture and the fires associated with it, as well as mining, in the case of Colombia. |134| |135|
The situation is similar in South-East Asia. The highlands of the Lao People's Democratic Republic and Myanmar are part of the Indo-Burma biodiversity hotspot, which is estimated to harbour in excess of 13,500 plant species, 7,000 of which are found nowhere else, but has less than 5 per cent of natural land cover remaining. |136|
FIG. 18 Coca bush cultivation in protected areas (national parks), Bolivia (Plurinational State of), Colombia and Peru, 2003-2014
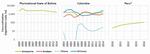
Click to enlargeNote: Data from national parks were assigned to each of the ecological regions. *Data for Peru were only available from 2010 onwards.
Cultivation of coca bush carries its own ramifications for biodiversity. Satellite-based data reveal clusters of persistent coca bush cultivation in protected areas (national parks) in all three coca-producing countries, where licit agriculture may also pose a threat. In Colombia, the protected areas most affected are encircled by a moving front of agriculture including coca bush cultivation in Sierra de La Macarena, Tinigua and Los Picachos national parks (see the Orinoco line in figure 18).
In Peru, the extent of coca bush cultivation in protected areas is limited. An analysis in 2004 of the location of coca cultivation according to potential land use in the three regions of Alto Huallaga, Apurimac-Ene and La Convención-Lares revealed that 2 per cent of the land area was occupied by coca cultivation, most of which (90 per cent) was on land without agricultural potential. Slightly less than a quarter of the coca cultivation was in protected areas, while two thirds was on land designated for forest.
In the Plurinational State of Bolivia, the most affected parks are Isiboro Secure and Carrasco. The first overlaps with the Alto Beni deforestation front and the second overlaps with the Chapare-Santa Cruz deforestation front. Coca-related encroachment into the parks dates back at least to the 1980s. |137|
Impact of drug control interventions on the environment
Alternative development
Target 2.4 of the Sustainable Development Goals
By 2030, ensure sustainable food production systems and implement resilient agricultural practices that increase productivity and production, that help maintain ecosystems, that strengthen capacity for adaptation to climate change, extreme weather, drought, flooding and other disasters and that progressively improve land and soil qualityAlternative development is an area of intervention in which efforts to reduce illicit drug supply contend with the socioeconomic conditions of farmers, as well as the environment in which the farmers live and earn their livelihood. Although short-sighted initiatives in the past may have had negative environmental consequences, alternative development has demonstrated that it can have a positive impact on the environment by promoting biodiversity and reforestation. The key elements, which are often critical to ensuring a holistic and sustainable success of alternative development programmes, include ccoommunal Oprairntoicoipation and the promotion of land ownership, community organization, good agricultural practices, including in post-harvest processes, agroforestry and forest management. |138|
One successful instance of alternative development extending to positive environmental effects can be seen in the San Martín Region in Peru, where alternative development initiatives included the replacement of coca production with the production of oil palm, cocoa and coffee and with agroforestry, in addition to reforesting 7.5 per cent of former coca and other crop fields (or about 650 ha). This last activity involved 350 local families. An additional 687 families were involved in 1,415 ha of agroforestry and coffee and cocoa cultivation for fair trade and organic markets. The success of the project rested on the provision of non-conditional support to beneficiaries, whether or not they eradicated coca bush, and on the inclusion of communities as a whole, whether or not they were directly involved in coca production. |139|
Land ownership was emphasized in the context of the Colombian initiative Forest Warden Families Programme, which ran during the period 2003-2013, reaching more than 120,000 families. |140| The project led to the purchase of more than 100,000 ha of land by approximately 30,000 families. The premise of this strategy is that land ownership discourages smallholders from joining or rejoining the coca economy and allows for the development of long-term productive projects. Although deforestation rates were not assessed in the project, land ownership also has the potential to slow down the agricultural frontier. |141|
In the past, crop substitution programmes, aimed at replacing illicit crops with licit crops, may have had undesired effects. In South-East Asia, for example, crop substitution has been criticized for promoting the shifting away from swidden agriculture, which allows for fallow periods during which the land may regenerate, towards permanent agriculture. |142| However, in terms of environmental impact, a study in northern Thailand showed how this does not necessarily translate into unsustainable deforestation. In the village of Pah Poo Chom, intensification of agriculture between the 1970s and 1990s took place in parallel with a decline in the overall use of land and the regrowth of forest on the steepest slopes, even as the population increased.
Eradication and displacement
The impact of illicit crop eradication on the environment may have different outcomes and different ramifications depending on the context. If eradication induces a displacement of the location of drug crop cultivation, this may result in negative environmental effects when farmers react to eradication initiatives and seek new cultivation sites that are out of the reach of law enforcement authorities. In Afghanistan, for example, the targeted "food zone" initiative in central Helmand, including eradication, may have played a role in the relocation of opium poppy growers north of the Boghra canal and the associated expansion of the agricultural frontier north of the canal, which almost doubled between 2008 and 2013. |143| This, in turn, may have contributed to soil depletion and other environmental effects north of the canal.
In the Andean countries, the easiest way for farmers to evade law enforcement is to establish their coca bush cultivation sites on relatively inaccessible mountain slopes. One study in the San Lucas mountain range in Colombia |144| obtained statistical confirmation that mountainous areas with some slope had a greater probability of being converted into coca bush cultivation areas, while the probability of converting forest into pasture decreased in very rugged terrain.
The complexity of the potential impact of eradication on the spatial distribution of coca bush cultivation, and associated environmental concerns, is also illustrated by other studies undertaken in Colombia. One study provided quantitative evidence to substantiate an overall shift in coca bush cultivation towards municipalities with a higher proportion of old-growth forest and lower road density over the period 2001-2008. |145| Together, the results provide evidence of coca growers migrating out of areas targeted for spraying and taking coca bush cultivation to new municipalities nearby. This explains the shifting of the Andean and Chocoan forest frontiers by coca bush growers.
Some studies, however, have shown that eradication may slow the advance of the agricultural frontier. Analyses of satellite imagery of eastern Bolivia |146| implied that that was the case. Aggressive campaigns to counter drug trafficking and to eradicate coca bush in the 1990s were identified as the main causes of the decline in forest clearing from the late 1980s to the 1990s. Although drug control policy was not identified as a driver of variation for farmers in Santa Cruz and the forest product sector, similar trends in forest clearing were observed. This highlights the difficulties in separating deforestation associated with or caused by coca bush cultivation from land-use change caused by other activities along the forest frontier.
Another study in Colombia suggested that eradication efforts may contribute to forest regrowth after coca bush cultivation has been abandoned. |147| The study observed that coca production had taken place in 8 of the top 10 municipalities gaining forest vegetation in 2001 and the total amount of coca produced had dropped markedly by 2010 (to 30 per cent of the initial amount), probably as a result of eradication efforts.
The possible impact of aerial spraying on the environment has been a long-debated and controversial issue in Colombia and elsewhere. In Colombia, since 1994, most coca bush eradication has been conducted by aerial spraying with the herbicide glyphosate. |148| Many views and opinions have enriched the discussion over the years and a considerable amount of research has been done, including on the substance glyphosate, spraying mixtures and the precision of spraying; however, the evidence is not conclusive, as some studies indicate that there is no negative impact on the environment while others indicate the contrary. |149|
D. PEACEFUL, JUST AND INCLUSIVE SOCIETIES
The new Sustainable Development Agenda recognizes the need to build peaceful, just and inclusive societies that provide equal access to justice and that are based on respect for human rights (including the right to development), on effective rule of law and good governance at all levels and on transparent, effective and accountable institutions. Among the targets associated with Sustainable Development Goal 16, those related to the rule of law and access to justice and reducing violence, economic crime (corruption and bribery), organized crime and illicit financial flows all have significant links with the world drug problem and with the response to it.
Violence
Defining drug-related violence
Target 16.1 of the Sustainable Development Goals
Significantly reduce all forms of violence and related death rates everywhereAlthough the drug problem may threaten peace and security in some countries, the connection between drugs and violence is not an automatic one. Moreover, as drug problems and violence can reinforce each other, it is challenging to assess to what extent drug problems impact on violence and vice versa. Indicators of drug-related violence may exist for certain locations and time periods, but data enabling comparison across countries and over time are difficult to come by. This is compounded by the multiple ways in which violence can be defined and the different forms it may take. Violence can be both lethal and non-lethal; it can sometimes be highly visible, and it can sometimes be hidden by its perpetrators and thus difficult to identify. |150|
Different stages of the drug problem result in different manifestations of violence. One way used to conceptualize these differences is to distinguish between psychopharmacological violence (violence stemming from direct drug use or withdrawal from drug use), economic violence (violence stemming from users' attempts to secure resources to buy drugs) and systemic violence (violence stemming from struggles for control between or within criminal groups over the illicit production and distribution of drugs). |151| |152| The intensity and lethality of violence vary significantly across this broad categorization. Illicit drug production and drug trafficking are more clearly associated with lethal violence, while illicit drug use is more related to property crime and domestic violence.
FIG. 19 Average homicide rates in relation to the location of countries on the illicit drug supply chain, 2009-2013
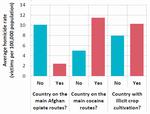
Click to enlargeSource: UNODC Homicide Statistics (2015). Available at www.unodc.org/unodc/en/data-and-analysis/homicide.html.
Globally, there is no clear correlation between homicide rates and prevalence of drug use, but there is an association between relatively higher homicide rates and the drug transit status of a country, albeit with variations within each group of countries.
Homicide rates are higher in cocaine transit countries and in cocaine-producing countries than in other countries. However, countries affected by Afghan opiate trafficking flows appear to be associated with relatively lower homicide rates, |153| suggesting that while drug transit and production can be associated with higher homicide rates, that is not always the case. There are differences across regions, countries and drug types.
Impact of drug use on violence
The relationship between drug use and violent crime is still under-researched and not properly understood, even though it is clear that some connection exists between the two phenomena. There is also enormous variation in the populations and in the sample sizes used in existing studies. There have been more analyses of the connection between drug use and crime in European countries and the United States than elsewhere. Meta-analyses of research studies suggest that certain drugs tend to drive the general association between drug use and crime and that the association tends to be stronger for property crime and drug law offences, including drug dealing.
Violence and the "crack" epidemic in the United States Between 1985 and 1991, homicide rates in the United States experienced an increase from 7.9 to 9.8 per 100,000 people, an upward trend mostly driven by increases in homicides among African-American males under 25 years of age (both as victims and perpetrators).� Similar increases occurred in robberies, which increased by 70 per cent between 1989 and 1994, especially robberies perpetrated by children under 18 years of age; among older perpetrators the uptick occurred earlier. Since the peak in crime in 1991, homicide rates have declined steadily.
The above-mentioned rise in violent crime has been linked to the "crack" cocaine epidemic and the violence generated by the "crack" markets, although the association between the rise in "crack" use and violent criminality was not automatic. In New York, one of the epicentres of the public security crisis that accounted for 9 per cent of national homicides in 1991, the peak in the use of "crack" occurred in 1984, yet the peak in homicides occurred in 1988, while an earlier uptick occurred in 1980. The increase in homicides appeared to be clearly related to the violent disputes generated by control over the "crack" markets, while the connection to "crack" use itself was tenuous despite widespread perceptions to the contrary. "Crack" use was related to the increase in robberies and to the increase in drug dealing, as many "crack" users turned to those activities to sustain their habits.
� A. Blumstein and J. Wallman, eds., The Crime Drop in America (New York, Cambridge University Press, 2006).
A review of studies conducted in Australia, the United Kingdom and the United States found a greater likelihood of property crimes being committed among people who use drugs than among those who do not. The studies focused on people who use drugs (mostly amphetamines and opiates) who had sought treatment or reported drug dependence. A stronger relationship was found between drug use and shoplifting, general theft and drug dealing than between drug use and other crimes. |154| The possibility that individuals engage in drug use to give them courage to commit violent acts was mentioned and found in some of these studies, although not very consistently. Generally, the evidence for psychopharmacological violence was weaker.
The relatively few existing studies have found drug use to be a risk factor for different types of family-related violence, such as minor and severe intimate-partner violence and child maltreatment. Some studies have also found a consistent link between witnessing or being a victim of violence early in life and engaging in drug use and crime later in life. Drug use is among the risk factors for both perpetrating and being a victim of family-related violence. Other risk factors include alcohol abuse, low socioeconomic status and a history of family-related violence. Drug use has been found to be a stronger predictor of committing an offence than having been victimized; for example, one study has found that women who use alcohol or drugs are more likely to be victims of battering and verbal abuse, but the effect seems less consistent when analysing severe abuse. |155|
Violence and illicit drug production and trafficking
Violence within illicit drug markets can be used for several purposes: to solve territorial, contractual, disciplinary or successional issues within and between drug trafficking organizations; to retaliate against state law enforcement or to pressure state officials not to enforce the law; and to induce changes in legislation or policy that affect criminal activities. In this sense, drug-related violence often affects criminals and state officials, but it is not limited to them and it can also affect civilians perceived as enemies, caught in the crossfire or affected by repressive policies. Violence resulting from market disputes between and within drug trafficking organizations, and from confrontation with state forces, can be lethal because it is more likely to involve firearms. It is also likely to have medium- and long-term objectives such as market control, which are unlikely to be achieved quickly.
Violence varies across countries affected by illicit drug production and trafficking, and it also varies over time within countries. Figure 20 illustrates the diverging trends in homicide rates in the main countries in which coca bush and opium poppy are cultivated. This divergence has not been systematically explained, although several factors related to those countries' political and societal landscapes and to the organization of illicit drug markets may account for it. In Colombia, powerful drug trafficking groups and the combination of internal armed conflict and the illicit drug trade have contributed to high levels of violence. In addition, as seen in the example of the Plurinational State of Bolivia, societal pressure, particularly from coca bush growers, has also shaped the operations of drug traffickers, possibly reducing the influence of large drug trafficking organizations. |156| Thus, while violence is likely to be more prevalent in cocaine-producing countries, the different homicide levels demonstrate that socioeconomic and political factors mediate this relationship.
FIG. 20 Homicide rates in selected countries affected by the illicit cultivation of coca bush and opium poppy, 2000-2013
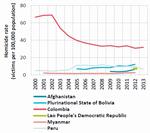
Click to enlargeSource: UNODC Homicide Statistics (2015). Available at www.unodc.org/unodc/en/data-and-analysis/homicide.html.
Violence associated with illicit drug markets also varies across regions. For example, although countries in both Latin America and South-East Asia play key roles in the illicit production of cocaine and opium, the former has been associated with significantly higher levels of violence than the latter. |157| Data collected for the Global Study on Homicide 2013 show that, among countries reporting the proportion of homicides related to gangs and organized crime, there is a clear difference between the Americas, where an average of 30 per cent of homicides can be related to gangs and/or organized crime, and Asia, where the proportion is about 2 per cent. |158| This does not indicate that organized criminal organizations may be less active in Asia than in the Americas, but it demonstrates that the modus operandi of such organizations is less violent in Asia than in the Americas.
Characteristics of the illicit drug market and drug trafficking organizations may explain why the cocaine trafficking route in the Americas appears to be associated with more violence than the opiate trafficking routes in Asia, and why East and South-East Asia seems generally less violent than Latin America, even though the drug problem significantly affects both subregions. In East and South-East Asia, various individuals and groups engage in illicit opium and heroin production and trafficking, and trafficking networks can be characterized as being compartmentalized and decentralized. Drug couriers tend to come from ethnic groups that straddle borders and are often from families involved in trafficking for generations, yet relatively independent of the traffickers and buyers that run the market. Although large organized criminal groups used to play a prominent role in drug trafficking, the organizations in control today seem less hierarchical and more decentralized. |159| In contrast, the cocaine supply chains in Latin America tend to be built around more cohesive, hierarchical organizations.
Drug-related violence associated with conflict, terrorism and insurgency
In a number of countries, resources generated by illicit activities such as drug trafficking have played a role in complicating and extending armed conflicts, often increasing their overall lethality. |160| The connection between the illicit drug trade and extremists has materialized in high-profile examples such as Afghanistan, Colombia, Myanmar and Peru. In Afghanistan, an analysis of the impact of opium production on terrorist attacks and casualties between 1994 and 2008 estimated that a 25 per cent increase in the number of hectares of cultivated opium poppy was associated with an average of 0.15 more terrorist attacks and 1.43 casualties per year. However, this association was modest relative to other variables. |161|
Colombia is another example where drug trafficking has been a crucial funding source for non-state armed groups since the mid-1990s. The illicit drug trade can thus become a funding source for insurgent and terrorist groups, and such a connection can in turn further weaken the rule of law, perpetuating both crime and insurgency and making conflicts more lethal. Despite the above-mentioned well-known examples, the connection between drugs, armed conflict and terrorism is not inevitable and varies significantly across armed groups and across countries affected by civil war. In fact, many armed groups and terrorist organizations operating in areas where they could profit by engaging in the illicit drug trade do not actually engage in it.
Collaboration between organized criminal and terrorist groups, if effectively realized, can, however, have grave implications for security. An analysis of terrorist and extremist organizations included in the Terrorism Knowledge Base, covering the years 1998-2005, |162| found that of the 395 organizations included in the data set, only about 9 per cent (35 organizations) were engaged in drug trafficking. |163| The study found that organizations are more likely to engage in drug trafficking when they have the logistical capability and the necessary network.
The profits associated with the illicit drug trade are a key motivation for non-state armed groups to engage in trafficking. However, in addition to direct financial gain, engagement in the drug trade may provide other non-monetary resources that are crucial for waging war, such as territorial control, military capacity and political and social legitimacy. By protecting illicit activities that provide livelihoods for impoverished segments of the population, armed groups may gain support, protection and intelligence from farmers. In Afghanistan, one reason for the Taliban's decision to allow the trade in opium was their realization of how critical it was for the local economy. Indeed, supporting the opium trade allegedly became one of the Taliban's greatest sources of legitimacy among the population. |164|
Responses to the drug problem and its links to violence
Research suggests that law enforcement and policing that target the protagonists and elements of the drug trafficking chain that generate the highest profits and the most violence are more effective in reducing violence than indiscriminate law enforcement by the authorities. For example, policing that targets the most violent drug traffickers can reduce violence by creating a powerful deterrent to violent behaviour (see box below). |165|
Another form of targeting that may reduce violence by weakening connections between armed groups and drug trafficking is the emphasis on drug interdiction rather than on illicit crop eradication. Along the same lines, effective alternative development programmes can weaken the connections between armed groups, drug trafficking and the population by providing incentives for the population to move away from illicit activities. But, as discussed in chapter II of the World Drug Report 2015, the interactions between alternative development and violence may also work in the opposite direction, meaning that in contexts where violence is already very high, alternative development is difficult to implement.
Targeted law enforcement can also entail strategies that do not focus on arresting low-level players in the drug trafficking chain and thus tend not to add to mass incarceration problems, which would have little positive (or perhaps even a negative) impact on violence. |166|
Long-term versus short-term outcomes of interventions
Strategies that focus on rapidly disrupting drug trafficking organizations and reducing violence in the short term can sometimes lead to more violence. By the same token, strategies that tackle the root causes of violence in the medium-to-long term may have a less discernible impact on short-term violence reduction.
Examples of successful policing that reduced violence Targeting the most violent drug traffickers was an approach implemented in Rio de Janeiro starting in 2008 as part of the programme known as Pacifying Police Units. The programme, which involved announcing in advance the entrance of police and military into some favelas (slums) where violent organizations operated and then introducing social programmes and the sustained presence of specially trained police, was credited with reducing homicides in certain favelas. An initiative known as the Drug Market Intervention Strategy and implemented in some cities in the United States was based on a similar principle, first identifying drug dealers in an active market, building cases against them, prosecuting the most violent and threatening others with arrest unless they stopped dealing. However, some limitations to this "violence-targeting" approach derive from the difficulty in collecting appropriate data for determining responsibility for violence and from the fact that violent drug traffickers often prefer to hide violence so as to avoid attracting the attention of law enforcement.�
� A. Durán-Martínez, "To kill and tell? State power, criminal competition, and drug violence", Journal of Conflict Resolution, vol. 59, No. 8 (2015), pp. 1,377-1,402.
The internal and external structure of illegal drug markets generate violence. Policies and measures aimed at dismantling the operation of criminal groups, such as actions primarily focused against their leaders, can lead to what has been described as "vacancy chains" |167| and ensuing violent succession competition as well as violent retribution by attacking the State itself. It has been argued that such mechanisms were present in the escalation of drug violence in Mexico since 2006, |168| before the rate of violent homicides started to decline after reaching a peak in 2011. |169| Elsewhere, analysis of organized crime in Osaka, Japan, suggests that the impact of law enforcement in generating "vacancy chains" was more limited than in other contexts, partially because police crackdowns focused on responding to violent activities and had as their primary goal the preservation of social order. |170|
Rule of law, access to justice and the drug problem
Target 16.3 of the Sustainable Development Goals
Promote the rule of law at the national and international levels and ensure equal access to justice for all
FIG. 21 Homicide rates and the amount of cocaine in transit in selected� cocaine transit countries in Latin America, 2010
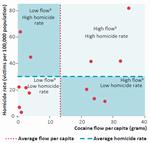
Click to enlargeSources: Estimates of the flow of cocaine based on United States, Office of National Drug Control Policy, "Cocaine Smuggling in 2010", January 2012; homicide data from UNODC Homicide Sta-tistics (2016). Available at www.unodc.org/unodc/en/data-and-analysis/homicide.html.
� Data were available for 13 countries.
b All flows are expressed per capita.Apart from the different effects that the inner characteristics of illicit drug markets can have on violence, there are characteristics related to the political and criminal justice systems that determine differences in violent outcomes. As figure 21 shows, the level of homicides in Latin America is not a direct consequence of drug trafficking, as some countries have a high level of homicides and a high level of cocaine trafficking while others have a high level of homicides but a low level of cocaine trafficking (or vice versa).
The strength of the rule of law and state presence are key determinants of how illegal activities are organized and how violent they may become. Where state presence is weak, owing to both a lack of services and an inability to provide security for citizens, criminal organizations can grow more powerful and violent and find opportunities to recruit more individuals into their ranks. In addition, where state law enforcement is weak or corrupt, criminal organizations may be more able to engage in combat with each other or with state officials. One example of such a dynamic is in West Africa, a subregion deeply affected by political instability, where the transit traffic in cocaine from South America destined for Western Europe has increased since 2005. The violent impact of such drug trafficking flows has been greater in countries with a highly unstable political environment.
Countries that face criminal violence may experience declines in, or prevent the escalation of, such violence when they conduct reforms that strengthen the rule of law, such as police reforms that increase police training and accountability. Those countries may also see declines in violence when they conduct operations to counter crime that make the price of using violence too high for drug traffickers.
One interesting example of the importance of reforms that democratize and strengthen the rule of law is in Nicaragua, where reforms of the police and their institutional culture have emphasized community policing, crime prevention and crime intelligence. As a result, homicide rates in Nicaragua are significantly lower than in some of the other Central American countries, despite similar vulnerabilities to crime and violence, such as poverty, the legacy of civil war and geographical importance to drug trafficking routes. |171| Elsewhere, after the violence and "crack" epidemic in the United States (see box on page 96), the steady decline in the homicide rate in that country in the 1990s has been attributed to different factors, including radical changes in policing strategies.
Criminal justice
Government interventions to disrupt drug trafficking organizations have, by definition, the objective of bringing criminals to justice and restoring the rule of law. Drug law enforcement operations, like law enforcement operations in general, when they are implemented by impartial, transparent and efficient institutions in compliance with human rights standards, promote the rule of law and justice for all. But when law enforcement operations go against those principles, incentives may be created for indiscriminate repression and for the violation of citizens' rights.
Where law enforcement agencies lack resources and are prone to corruption and where justice systems are weak and impunity is prevalent, demands on the police to be more effective in countering drug trafficking can lead to indiscriminate apprehension of those likely to be perceived as criminals. This can also lead law enforcement agents to target the types of crime for which suspects are easier to identify, which tend to be minor drug-related offences rather than more serious offences such as homicide. |172| Zero-tolerance policies, if not properly implemented, may sometimes run the risk of generating violence by stigmatizing and enabling the abuse of power to be directed against people who use drugs or low-level players in the drug trafficking chain. |173| |174| |175| This, in turn, can lead to mass imprisonment for low-level offences or to forced detention of people who use drugs.
Criminal justice, drug trafficking and illicit drug markets
The criminal justice system can indirectly influence the availability of drugs in illicit markets, not only when it reduces the illicit supply through interdiction but also when it increases the risk of interdiction, which raises the price of drugs in consumer markets. Drug dealers are in business to make profit, so when law enforcement increases the dealers' costs, those costs are passed along (in the form of price increases) to people who use drugs. Research suggests that the impact of law enforcement on drug prices is most appreciable in new or emerging markets, or when it induces market shocks in established markets. |176| |177|
Research confirms that ultimately higher costs imposed on drug trafficking by criminal justice interventions can translate into a reduction in illicit drug use in the long term, |178| although this does not automatically result in a reduction in market size. Indeed, it is not enough to rely exclusively on price increases as a deterrent to drug use, and it is essential to ensure that the reduction in demand, which is assisted by a price increase, actually outperforms that increase. This can be achieved by interventions that reduce demand directly, such as drug use prevention, treatment, rehabilitation and aftercare.
Criminal justice interventions can have other indirect and unforeseen impacts on drug markets. The targeting of high-ranking individuals in drug trafficking organizations may trigger restructuring |179| and changes in modus operandi and crackdowns in one particular area or route may induce shifts in supply patterns, as traffickers exploit other vulnerabilities and seek the path of least resistance in garnering profit from the illicit demand for drugs; |180| |181| such outcomes reflect the necessity to systematically consolidate progress in the rule of law beyond successes in one country or on one trafficking route. An example of this phenomenon is the shift in illicit cocaine production to cocaine-processing laboratories in Colombia following the introduction of a policy for shooting down small aircraft transporting coca paste or base from growing areas in the Upper Huallaga valley in Peru. |182|
In addition, drug trafficking can exert an influence on the criminal justice system. For example, a high level of drug trafficking can feed corruption and undermine the ability of the criminal justice system to function properly. The successes of drug trafficking organizations in achieving their criminal objectives, along with the sometimes more visible consequences of drug trafficking, may expose the inadequacy of the criminal justice system and lead to reform. In Colombia in the 1980s, when drug violence threatened the State, security agencies, especially the police, were unprepared for drug control operations and plagued by corruption and lack of coordination. The need to confront criminal organizations motivated crucial transformations in Colombian security agencies. |183|
Impact of criminal justice on people who use drugs
Different criminal justice approaches have a different impact on drug use and on people who use drugs. There are differences across jurisdictions in terms of definitions, prosecutorial discretion or types and severity of sanctions for drug-related offences. In some regions, countries exercise more punitive approaches when dealing with people apprehended for minor offences, such as possession of small quantities of drugs for personal consumption, which may result in such offenders being incarcerated. Several countries in Europe and Latin America have chosen to limit punishment by adopting alternative measures to incarceration or punishment (for example, fines, warnings, probation or counselling) in certain cases (without aggravating circumstances) involving minor offences related to personal consumption.
Punitive approaches do not necessarily translate into gains in terms of discouraging drug use. The imposition of severe penalties for drug use and the possession of drugs for personal consumption does not appear to have a deterrent effect on drug use in the community, |184| and it can actually have a negative impact on the well-being and health of people who use drugs.
Incarceration in prison and confinement in compulsory drug treatment centres often worsen the already problematic lives of people who use drugs and drug-dependent persons, particularly the youngest and most vulnerable. |185| Exposure to the prison environment facilitates affiliation with older criminals and criminal gangs and organizations, increases stigma and helps to form a criminal identity. It also often increases social exclusion, worsens health conditions and reduces social skills. Alternatives to incarceration within the community (in an outpatient or residential therapeutic setting), such as psychosocially supported pharmacological treatment for opiate dependence, can be more effective than imprisonment in reducing drug-related offences. |186| Criminal justice can have a different impact on women than on men. Female offenders and prisoners, especially those with drug use disorders, face particular hardship as, in many instances, criminal justice systems are not yet equipped for the special needs of women. Women affected by drug use disorders are more vulnerable and more stigmatized than men, they suffer from co-occurring mental health disorders to a greater extent than men and they are more likely to have been victims of violence and abuse (see the section above entitled "Social development"); and yet they are far less likely than men to access treatment. |187| Children with substance abuse disorders are of particular concern within the justice system, as they are often exploited by gangs and organized criminal groups in the illicit drug market. In many countries, the majority of children who are in detention are either children affected by drug dependence or children who have committed drug-related offences. Overreliance on the deprivation of children's liberty and insufficient application of drug treatment programmes or other alternatives to detention are common challenges, |188| despite international obligations to use the deprivation of liberty as a measure of last resort. |189|
The impact of drugs on the criminal justice system
FIG. 22 Trends in global crime rates, by type of crime, 2003-2013
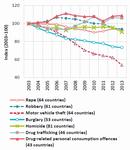
Click to enlargeSource: United Nations Survey of Crime Trends and Operations of Criminal Justice Systems (UNODC).
Notes: Trends are calculated as weighted crime rates per 100,000 population relative to the base year 2003. To produce global estimates, the estimated crime rates for each region were weighted according to the share of the region's population in the global population. Data on drug trafficking and drug-related personal consumption offences refer mostly to persons arrested or prosecuted for those types of crime.
FIG. 23 Sentenced prisoners by principal offence of final sentence, 2012
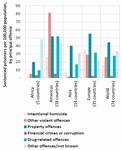
Click to enlargeSource: Note by the Secretariat on world crime trends and emerging issues and responses in the field of crime prevention and criminal justice (E/CN.15/2016/10).
As with any law carrying the potential of criminal punishment, the enforcement of drug-related laws may result in a corresponding burden on the criminal justice system and require resources dedicated to investigation, prosecution, adjudication and incarceration in connection with drug-related offences. At the global level, drug-related offences recorded by the police, and offences related to personal consumption in particular, have increased moderately over the past decade, whereas other kinds of crime, such as robbery, motor vehicle theft, burglary and homicide, have decreased substantially (see figure 22). UNODC estimates that just under a third of the global prison population (30 per cent over the period 2012-2014, compared with 32 per cent over the period 2003-2005) continues to be made up of unsentenced or pretrial prisoners. |190| Among convicted prisoners, drug-related offences account for an estimated 18 per cent of the global prison population, representing a rate of 28 per 100,000 population |191| (see figure 23).
There is great variation in the criteria used by national laws to establish the "personal consumption" versus "trafficking" character of a drug-related offence; they can include the drug type and amount, associated thresholds (or none at all), drug purity, position in a gang and whether the person in question uses drugs. This variation thus makes the comparison of data across countries challenging. Global aggregates show that the number of offences related to personal consumption exceeds the number of trafficking offences, reflecting the fact that the number of people who use drugs is much larger than the number of people in the drug supply chain. The limited data available also indicate that the conviction rate (the number of persons convicted as a proportion of the number of persons suspected) for offences related to personal consumption tends to be lower than the conviction rate for trafficking offences. Moreover, the stipulated periods of imprisonment tend to be longer for trafficking offences. All of those factors help determine the relative share of drug trafficking offences and offences related to personal consumption in the overall extent of incarceration attributable to drug-related offences. More than three quarters of all persons held in prison for drug-related offences in 2014 had been convicted of drug trafficking offences and less than a quarter had been convicted of offences related to personal consumption (based on data from 29 countries). |192| |193|
One study estimated that 235,000 people were detained without their consent in 1,000 drug detention centres in East and South-East Asia, where they may be subject to a range of human rights violations, such as forced labour, physical punishment and sexual violence. |194|
Alternatives to imprisonment for personal consumption offences can have a positive impact on access to justice
The international drug control conventions have given the flexibility to provide people who possess, purchase or cultivate drugs for personal consumption, or in other situations considered minor in nature, measures of treatment, education, aftercare, rehabilitation and social reintegration, either as an alternative to conviction or punishment or in addition to conviction or punishment, taking into account the gravity of the offence. |195| Examples of this approach are the diversion of minor cases from the criminal justice system through the exercise of police or prosecutorial discretion and the imposition of non-custodial measures as an alternative to imprisonment. This is in line with the international drug control conventions |196| and with the requirements of an effective penal policy that is in compliance with human rights standards. In addition, States parties to international drug control conventions are required to take measures to prevent drug abuse and to provide for early identification, treatment, education, aftercare, rehabilitation and social reintegration of persons who abuse drugs. |197|
Alternatives to imprisonment can clearly have a positive impact on people who use drugs. The provision of evidence-based treatment and care services to drug-using offenders, as an alternative to incarceration, has been shown to substantially increase recovery and reduce recidivism. |198| There is considerable evidence that effective treatment of drug dependence offering clinical interventions (inpatient or outpatient) as an alternative to criminal justice sanctions substantially increases recovery. This improves outcomes both for the person with the drug use disorder and the community when compared with the effects of criminal justice sanctions alone. |199|
Alternatives to imprisonment have sometimes been put in place as a response to developments in drug use. For example, the spread of the use of "crack" in the United States in the 1980s was a major factor in prompting the introduction of "drug courts". Similarly, the challenging nature of the drug problem in Portugal in the 1990s set the scene for a turning point in Portuguese drug control policy, as well as the institutional setup for its implementation. |200|
Corruption, organized crime and illicit financial flows
Corruption
Target 16.5 of the Sustainable Development Goals
Substantially reduce corruption and bribery in all their formsCorruption and related forms of crime such as extortion engender costs in terms of discouragement or impediment to investment, entrepreneurship and business formation (which have prerequisites such as the rule of law and procedural transparency) and ultimately the hindrance of prosperity and economic development.
There is a mutually reinforcing relationship between the drug problem and corruption. The illicit drug trade often flourishes where state presence and the rule of law are weak and, thus, where opportunities for corruption exist. At the same time, the profits and power of drug trafficking organizations provide them with resources to reinforce corruption by buying protection from law enforcement agents — particularly when the agents' levels of remuneration are low — and from politicians and the business sector; this means that corruption can be the Achilles heel in the response to drug trafficking.
Types of corruption
Corruption can be at a high or low level. Low-level or "petty" corruption often starts with street police or local politicians, who may be vulnerable to crime because of a lack of social legitimacy or because they come from the very same communities as members of criminal groups. |201|
As drug traffickers grow in power, they may also infiltrate police institutions to ensure the acquiescence of officials. High-level or "grand" corruption, for its part, affects the highest ranks of power, such as police chiefs, national politicians and high-level law enforcement officials. The practice of corrupting officials to facilitate drug trafficking has been documented in all parts of the world.
Corruption can also vary depending on the strength of the rule of law and the effectiveness of state institutions; characteristics of the political systems such as the strength of political parties, the efficacy of the criminal justice system, including its investigative and prosecutorial functions, the existence of functioning oversight mechanisms and sanctions for corruption can reduce the extent of drug-related corruption. The organization of criminal groups can also affect the specific interaction between state officials and criminal groups. In Italy, for example, studies have found that organized criminal groups with complex internal structures, such as Cosa Nostra and 'Ndrangheta, whose activities include, but are not limited to, the illicit drug trade, have benefited from high-level political connections and even enjoyed official state sanctioning in parts of Sicily and Calabria. In other parts of the country, organized criminal groups such as the Camorra and the Apulian groups, which are less hierarchical and strict in their recruitment practices, have more diffuse, though still strong, political connections. |202|
When institutions are strong, corruption can also exist, although more sporadically and manifested in more individualized links. For example, according to a report by the General Accounting Office in the United States, less than 1 per cent of employees of the Custom and Border Patrol were arrested on charges of corruption between 2005 and 2012; among the 144 employees arrested or indicted for corruption, pressure from drug trafficking and other trans-national criminal groups was found to be a key factor. Of the 144 cases, 103 were found to be "mission-compromising", including instances involving drug trafficking or the smuggling of migrants. There were 32,290 allegations of corruption or misconduct during the same period, |203| which shows that even though corruption may not threaten the integrity of an institution as a whole, it does affect its performance and plays a very important role in illegal networks.
Drug trafficking organizations conduct their business using both corruption and violence. Criminals and drug traffickers use those two strategies simultaneously, and even as complements, because the threat of violence or the direct use of violence can be used to make corruption cheaper. |204| However, the type of corrupt network can also determine whether violence becomes more or less pervasive. Corrupt networks that are predictable and stable offer protection that criminals might be unwilling to destabilize through violence. |205| Some analysts argue that the characteristics of political systems and the relations between different law enforcement agencies may shape the organization and predictability of corruption networks. Predictable corrupt networks — those that guarantee protection from law enforcement — can deter criminals from deploying large-scale violence. Such networks may be more likely to emerge where government power is centralized and the rule of law is weak because those environments facilitate the creation of corruption channels at the highest echelons of power. This, in turn, may deter the use of violence because criminals may prefer to avoid violence, as that could force the government authorities to target them more strongly. |206| By the same token, institutional changes that decentralize power and create political competition may fragment corruption channels and compel criminals to use violence to pressure the authorities. |207|
Drugs and illicit financial flows
Target 16.4 of the Sustainable Development Goals
By 2030, significantly reduce illicit financial and arms flows, strengthen the recovery and return of stolen assets and combat all forms of organized crimeProfits from the illicit drug trade can constitute considerable financial incentives for organized criminal groups. For example, a recent UNODC study |208| showed that the illicit proceeds of opiates smuggled along the Balkan route through Europe amounted to, on average, $28 billion per year. Almost half of those profits were generated in the four European countries with the largest illicit markets for opiates: France, Germany, Italy and United Kingdom. However, profits from the illicit opiate trade in those countries accounted for a significantly smaller proportion of GDP (0.07-0.19 per cent) than in countries with a relatively small GDP, such as Albania (2.60 per cent of GDP), Iran (Islamic Republic of) (1.66 per cent) and Bulgaria (1.22 per cent).
Money-laundering occurs by many different means, ranging from the use of small, decentralized techniques, involving money orders or remittances, to sophisticated uses of front businesses; in all cases, however, the often substantial proceeds of the illicit drug trade are recirculated via legitimate means. In many cases, such illicit proceeds can inject large cash inflows into a country's economy and can have important macroeconomic effects, such as changes in currency values and increases in budgets and foreign exchange reserves, as in a number of West African countries, some of which have been significantly affected by cocaine trafficking. In Guinea-Bissau, for example, foreign exchange reserves rose from $33 million in 2003 to $174 million in 2008; and in the Gambia, the value of the dalasi increased very rapidly with no clear change in capital inflows. |209|
One of the consequences of illicit financial flows is that they may undermine the integrity of a country's financial system, including its international financial sectors. In the case of opiates originating in Afghanistan, for example, a report by the Financial Action Task Force |210| found that money does not generally flow from the major consumer markets to Afghanistan directly; rather, intermediate countries act as gateways to move money to or from Afghanistan. The transfer of funds between consumer markets and intermediate countries varies significantly, with drug traffickers using the full range of money transfer techniques, such as the banking system, money or value transfer services, and high-value commodity and cash couriers. However, funds moving between intermediate countries and Afghanistan seem to make particular use of cash couriers and money or value transfer services.
Part of the proceeds from the illicit drug trade generated in the country of consumption are transferred to financial centres, where the accounts of companies, financial institutions, resident individuals and financial service professionals are used to accumulate and redistribute the financial flows.
Recent examples of money-laundering illustrate how illicit proceeds are recirculated through major financial institutions in developed countries. In 2012, the United States Department of Justice fined a bank based in the United Kingdom $1.9 billion for "failures of oversight" that allowed the laundering of at least $881 million in proceeds from drug trafficking. |211| Such failures included failure to monitor at least $670 billion in wire transfers from the bank's unit in Mexico. The money originated from the Sinaloa cartel in Mexico, the Norte del Valle cartel in Colombia and other smaller drug trafficking organizations. |212| These forms of illicit financial flows are essential for criminal groups to survive and constitute an enormous threat to sustainable development.
Sustainable Development Goal 17. Strengthen the means of implementation and revitalize the global partnership for sustainable development The provision of assistance geared towards global sustainable development, including development assistance to be provided by developed countries to developing countries, is another key element addressed in the Sustainable Development Goals. Developed countries are to provide 0.7 of gross national income in official development assistance to developing countries. Moreover, target 17.9 of the Sustainable Development Goals is to enhance international support for implementing effective and targeted capacity-building in developing countries to support national plans to implement all the Sustainable Development Goals. Given the extensive interplay that exists between sustain-able development and drug control, development assistance and capacity-building must also be channelled into measures to counter the world drug problem.
The efforts of the international community in countering the world drug problem have long recognized the importance of partnership as embodied in the concept of common and shared responsibility that requires effective and increased international cooperation. At a special session of the General Assembly, held in April 2016, Member States recognized that the world drug problem remains a common and shared responsibility that should be addressed in a multilateral setting through effective and increased international cooperation and demands an integrated, multidisciplinary, mutually reinforcing, balanced, scientific evidence-based and comprehensive approach. The special session was an important milestone after the policy document of 2009 "Political Declaration and Plan of Action on International Cooperation towards an Integrated and Balanced Strategy to Counter the World Drug Problem", which defined action to be taken by Member States as well as goals to be achieved by 2019. At the 2016 session, Member States adopted the outcome document entitled "Our joint commitment to effectively addressing and countering the world drug problem". |213|
This document welcomes the 2030 Agenda for Sustainable Development, and notes that efforts to achieve the Sustainable Development Goals and to effectively address the world drug problem are complementary and mutually reinforcing. Moreover, in the document Member States reaffirmed the need to mobilize adequate resources to address and counter the world drug problem and called for enhancing assistance to developing countries, upon request, in effectively implementing the Political Declaration and Plan of Action and the operational recommendations of the outcome document.
Resource allocation for international development assistance
Data on the provision of official development assistance are made available by OECD, covering assistance committed and disbursed by members of the OECD Development Assistance Committee as well as by other donors. According to OECD international aid statistics (Creditor Reporting System), over the period 1995-2014, international assistance by those donors followed a broadly increasing trend, even when adjusted for inflation (expressed in 2013 dollars). However, over the same period, the magnitude of commitments towards the sectors specific to drug-related matters, namely "alternative development" (agricultural and non-agricultural) |214| and "narcotics control", |215| followed a different trend. Assistance in these sectors, particularly in the "narcotics control" sector, increased substantially after 1998, when the twentieth special session of the General Assembly, devoted to countering the world drug problem together, was held. Over the period 1999-2008, "narcotics control" assistance averaged $1.44 billion (in constant 2013 dollars) and "alternative development" assistance averaged $219 million (in constant 2013 dollars) — approximately 80 times and 5 times the annual average over the period 1995-1998, respectively.
Despite the adoption in 2009 of the Political Declaration and Plan of Action on International Cooperation towards an Integrated and Balanced Strategy to Counter the World Drug Problem, |216| assistance in both sectors, particularly in the "narcotics control" sector, has declined significantly since 2008. Moreover, while the "narcotics control" sector dominated the drug-related total over the period 1999-2008, the decline in that sector was so steep that assistance in the "alternative development" sectors, even though significantly lower than in the peak years of 2007 and 2008, exceeded assistance in the "narcotics control" sector every year from 2010 onwards. Expressed as a percentage of total development assistance, total assistance to the above-mentioned drug-related sectors reached its highest level (2.6 per cent) in 2000 and stood at 0.14 per cent in 2014.
The major beneficiaries of assistance in drug-related sectors reflect the location of drug crop cultivation. Over the period 2009-2014, South America accounted for more than half of the assistance committed to the "narcotics control" sector, as well as to "alternative development", while the region of South and Central Asia (OECD designation) accounted for more than a fifth of the "narcotics control" commitments and more than a third of "alternative development" commitments. |217|
There may be important contributions towards development assistance in drug-related areas by countries that are not covered by the Creditor Reporting System of OECD. Some development assistance, which in the OECD Creditor Reporting System is not categorized under the sectors discussed above, may also contribute, directly or indirectly, to countering the world drug problem. For example, the sector "medical services" covers, among other areas, "drug and substance abuse control", |218| while assistance to the "STD control including HIV/AIDS" sector may also indirectly contribute to the mitigation of drug use disorders.
Technical assistance and international cooperation
In the 2009 Plan of Action on International Cooperation towards an Integrated and Balanced Strategy to Counter the World Drug Problem, several courses of action in the area of international cooperation were agreed. In particular, it was agreed that Member States should scale up international assistance in addressing drug demand reduction in order to achieve a significant impact. With respect to drug supply reduction, in the Plan of Action, Member States committed themselves to providing further encouragement and assistance for: the sharing of information through official channels in a timely manner; the implementation of border control measures; the provision of equipment; the exchange of law enforcement officers; collaboration between the private and public sectors; and the development of practical new methods for effectively monitoring drug trafficking activities.
At the special session of the General Assembly, Member States reaffirmed their commitment to implementing effectively the provisions set out in the Political Declaration and Plan of Action, and recommended, inter alia, the following measures: strengthening specialized, targeted, effective and sustainable technical assistance (including, where appropriate, adequate financial assistance), training, capacity-building, equipment and technological know-how, to requesting countries, in order to assist Member States to effectively address the health, socioeconomic, human rights, justice and law enforcement aspects of the world drug problem; enhancing North-South, South-South and triangular cooperation among Member States, in cooperation with the international development community and other key stakeholders; and strengthening the regular exchange of information, good practices and lessons learned among national practitioners from different fields and at all levels.
Responses from Member States to the UNODC annual report questionnaire from 2010 onwards indicate that Member States continued to engage in a wide range of cross-border activities and international cooperation to reduce the illicit supply of drugs, including the exchange of information, joint operations with other countries and the exchange of liaison officers. A range of communication platforms continue to be used extensively to exchange information between law enforcement agencies. The majority of responding Member States use multiple communication platforms, including both formal and informal channels; the most common include regional and international meetings, direct communication between law enforcement agencies, the International Criminal Police Organization (INTERPOL), liaison officers, regional organizations, the World Customs Organization and diplomatic channels. |219|
FIG. 24 Number of countries reporting the receipt of specific types of technical assistance, 2010-2014
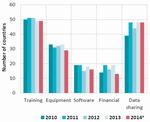
Click to enlargeSource: Responses to the annual report questionnaire.
� Data for 2014 reflect the responses received as of November 2015.
FIG. 25 Trends in global commitments to providing official development assistance: assistance in all sectors and in the sectors "narcotics control" and "alternative development",� 1995-2014
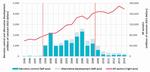
Click to enlargeSource: OECD, International Development Statistics online database (Creditor Reporting System). Data extracted March 2016.
� The sum of agricultural alternative development and non-agricultural alternative development.
The Plan of Action also recognizes that several developing countries, especially those on major drug trafficking routes, require technical assistance to further strengthen their law enforcement agencies. In line with this, nearly three quarters of responding Member States reported receiving technical assistance in the area of drug supply reduction from another country or from an international organization in 2014. The data indicate a stable trend in the provision of most forms of assistance and suggest that those forms of assistance that come with fewer financial implications are the most frequently adopted. Specifically, the most common forms of assistance were training and data-sharing, followed by the provision of equipment. Less common forms of assistance included the provision of software and financial aid.
The outcome document of the special session of the General Assembly also calls for Member States to consider strengthening a development perspective as part of comprehensive, integrated and balanced national drug policies and programmes so as to tackle the related causes and consequences of illicit supply chain of drugs by, inter alia, addressing risk factors affecting individuals, communities and society, which may include a lack of services, infrastructure needs, drug-related violence, exclusion, marginalization and social disintegration, in order to contribute to the promotion of peaceful and inclusive societies. The document also recommends that Member States promote partnerships and innovative cooperation initiatives with the private sector, civil society and international financial institutions to create conditions more conducive to productive investments targeted at job creation in areas and among communities affected by or at risk of illicit drug cultivation, production, manufacturing, trafficking and other illicit drug-related activities in order to prevent, reduce or eliminate them, and to share best practices, lessons learned, expertise and skills in this regard.
Given the fact that the drug problem is intertwined with a vast array of development issues, it is fair to say that sustainable development can only truly occur if the world drug problem is addressed. As this chapter shows, although official development assistance has increased overall, assistance to drug-related sectors has actually decreased. The momentum already generated towards the achievement of the 2030 Sustainable Development Agenda could provide an ideal opportunity to redress this imbalance.
[Source: United Nations Office on Drugs and Crime - UNODC, Vienna, 23Jun16]
Cannabis
Cannabis cultivation, production and eradication, 2014 or latest year available in period 2010-2014
Year Country Product Outdoors/ indoors Cultivated (ha) Eradicated (ha) Harvestable (ha) Production (tons) Plants eradicated Sites eradicated 2012 Afghanistan resin outdoors 10,000 a 1,400 2014 Albania herb outdoors 540 551,414 2014 Algeria resin outdoors 2,522 2011 Argentina herb outdoors 5,605 2,335 2014 Armenia herb outdoors 1.00 b 1.00 0.00 2012 Australia herb indoors 17,668 322 2012 Australia herb outdoors 35,146 240 2014 Austria herb indoors 19,719 400 2014 Austria herb outdoors 2.00 b 2.00 0.00 2,795 130 2013 Azerbaijan herb outdoors 23.95 b 23.95 0.00 263.96 8,469 151 2014 Azerbaijan herb outdoors 17.50 b 17.50 0.00 14,889 195 2012 Belarus herb oudoors 81.20 2014 Belgium herb indoors 350,531 1,137 2014 Belgium herb outdoors 6,057 90 2014 Belize herb outdoors 110,000 2014 Bosnia and Herzegovina herb outdoors 6,141 2014 Brazil herb outdoors 44.01 1,364,316 2014 Bulgaria herb indoors 66 2014 Bulgaria herb outdoors 35.00 b 35.00 0.00 21,516 34 2010 Chad herb outdoors 10.00 2014 Chile herb indoors 40,947 1,592 2014 Chile herb outdoors 215,671 227 2014 Colombia herb outdoors 265.79 2014 Costa Rica herb outdoors 5.90 b 5.90 0.00 882,550 151 2014 Côte d'Ivoire herb outdoors 1.00 b 1.00 2010 Croatia herb outdoors 0.30 b 0.30 2014 Czech Republic herb indoors 71,458 301 2014 Czech Republic herb outdoors 6,227 2014 Domnican Republic herb outdoors 6.00 b 6.00 0.00 0.21 111 8 2014 Ecuador herb outdoors 648 34 2013 Egypt herb/resin outdoors 344.70� 344.70 2014 El Salvador herb outdoors 1,321 77 2011 Estonia herb indoors 385 1 2014 France herb outdoors 158,592 837 2014 Germany herb indoors 109,563 755 2014 Germany herb outdoors 6,988 116 2014 Greece herb indoors 1,753 2014 Greece herb outdoors 50,331 2014 Guatemala herb outdoord 15.00 b 15.50 0.00 1,560,638 40 2014 Hungary herb indoors 10 2014 Hungary herb outdoors 25 2013 Iceland herb indoors 6,552 323 2011 India herb outdoors 1,112.00 2014 Indonesia herb outdoors 122.0 106.00 671 6 2014 Ireland herb indoors 15,463 357 2010 Israel herb indoors 1,000 25 2014 Italy herb indoors 51,534 639 2014 Italy herb outdoors 70,125 1,134 2011 Jamaica herb outdoors 372.69 1,053,000 2011 Kazakhstan herb outdoors 79,470 228 2014 Kenya herb outdoors 133.00 b 133.0 0.00 5,801 2014 Latvia herb indoors 221 15 2013 Latvia herb outdoors 348 14 2012 Lebanon herb outdoors 3,500.00� 800.00 2,700.00 2014 Lithuania herb indoors 4 2013 Malta herb indoors 27 2013 Mexico herb outdoors 13,000.00 a 5,734.45 2013 Mongolia herb outdoors 15,000.00 a 4,000.00 11,000.00 4,000 4,000 2013 Morocco resin outdoors 47,196.00 a 5,000.00 42,196.00 700.00 2010 Mozambique herb outdoors 1,079 2014 Myanmar herb outdoors 15.00 b 10.00 5.00 3 2014 Netherlands herb indoors 5,722 2014 Netherlands herb outdoors 284 2014 Netherlands herb 1,600,000 2014 New Zealand herb indoors 18,508 704 2014 New Zealand herb outdoors 104,849 2014 Nicaragua herb outdoors 0.30 1,507.00 3,014 30 2014 Nigeria herb outdoors 4,529.15 b 4,529.15 2.54 53,719,342 2013 Panama herb indoors 0.50 b 0.50 0.00 37 2 2013 Panama herb outdoors 10.50 b 10.50 0.00 78,633 2 2014 Paraguay herb outdoors 6,000.00 a 2,474.00 3,526.00 1,803 2012 Peru herb outdoors 2014 Philippines herb outdoors 28.00 1,367,321 504 2014 Poland herb indoors 845 45 2013 Poland herb outdoors 1.80 69,240 12 2013 Republic of Korea herb outdoors 8,072 2014 Republic of Moldova herb outdoors 100.00 a 59.00 41.00 10,000.00 200,548 2014 Republic of Moldova herb indoors 41.00 2013 Romania herb indoors/outdoors 8,835 69 2014 Russian Federation herb outdoors 24,096.29 a 66.90 24,029.39 369.57 2,118 2013 Sierra Leone herb outdoors 190.00 a 190.00 190 3 2012 Slovakia herb indoors 2,927 2013 Slovakia herb outdoors 1,077 2014 Slovenia herb indoors 9,223 118 2014 Slovenia herb outdoors 1,844 2014 Spain herb indoors 208,449 2014 Spain herb outdoors 61,673 2010 Sri Lanka herb outdoors 500.00 a 500.00 4,000.00 2014 Sudan herb outdoors 8.00 b 8.00 0.00 345.00 2014 Swaziland herb outdoors 1,500.00 a 1,069.50 430.50 3,000,000 210 2014 Sweden herb indoors 10,000 56 2014 Switzerland herb indoors 45,620 748 2012 Tajikistan herb outdoors 2,180,121 2013 Trinidad and Tobago herb outdoors 10.28 b 10.28 0.00 61.00 597,100 117 2012 Uganda herb outdoors 150.00 a 88.00 62.00 5 2013 Ukraine herb outdoors 166.90 483,000 2014 United States herb indoors 361,727 2,754 2014 United States herb outdoors 4,033,513 6,376 2014 Uzbekistan herb outdoors 0.30 b 0.30 0.00 716 2014 Viet Nam herb oudoors 2.30 Sources: UNODC annual report questionnaire; Government reports; United States International Narcotics Control Strategy Report.
a Estimate of total area under cannabis cultivation.
b Area identified by the authorities for eradication.
Cocaine
Global illicit cultivation of coca bush, 2003-2014 (hectares)
2003 2004 2005 2006 2007 2008 2009 2010 2011 2012 2013 2014 Bolivia (Plurinational State of) 23,600 27,700 25,400 27,500 28,900 30,500 30,900 31,000 27,200 25,300 23,000 20,400 Colombia a 86,000 80,000 86,000 78,000 99,000 81,000 73,000 62,000 64,000 48,000 48,000 69,000 Peru b 44,200 50,300 48,200 51,400 53,700 56,100 59,900 61,200 64,400 Peru c 62,500 60,400 49,800 42,900 Total 153,800 158,000 159,600 156,900 181,600 167,600 163,800 154,200 155,600d 133,700 120,800 132,300 Sources: Plurinational State of Bolivia: 2002: CICAD and United States Department of State, INCSR. Since 2003: national illicit crop monitoring system supported by UNODC. Colombia: national illicit crop monitoring system supported by UNODC. Peru: national illicit crop monitoring system supported by UNODC.
Note: Different area concepts and their effect on comparability were presented in the World Drug Report 2012 (p. 41-42). Efforts to improve the comparability of estimates between countries continue; since 2011 the net area under coca bush cultivation on the reference date of 31 December was estimated for Peru, in addition to Colombia. The estimate presented for the Plurinational State of Bolivia represents the area under coca cultivation as seen on satellite imagery.
a Net area on 31 December. Estimates from 2009 onwards were adjusted for small fields, while estimates for previous years did not require that adjustment.
b Area as interpreted from satellite imagery.
c Net area on 31 December, deducting fields erradicated after satellite imagery was taken.
d The global coca cultivation figure was calculated with the "area as interpreted on satellite imagery" for Peru.
Reported cumulative eradication of coca bush, 2006-2014
Unit 2006 2007 2008 2009 2010 2011 2012 2013 2014 Bolivia (Plurinational State of) manual hectare 5,070 6,269 5,484 6,341 8,200 10,460 11,044 11,407 11,144 Colombia manual hectare 41,346 66,392 96,003 60,565 43,804 35,201 30,487 22,127 12,496 spraying hectare 172,026 153,134 133,496 104,771 101,939 103,302 100,549 47,053 55,554 Peru manual hectare 9,153 10,188 11,102 10,091 12,239 10,290 14,235 23,947 31,200 Ecuador manual hectare 9 12 12 6 3 14 Ecuador plants 64,000 130,000 152000 57,765 3,870 55,030 122,656 41,996 15,874 Venezuela (Bolivarian Republic of) manual hectare 0 0 0 0 .. .. .. .. .. Source: UNODC annual report questionnaire and government reports.
Note: The totals for Bolivia (Plurinational State of) since 2006 include voluntary and forced eradication. The totals for Peru include voluntary and forced eradication. Cumulative eradication refers to the sum of all eradication in a year, including repeated eradication of the same fields. Two dots indicate that data are not available.
Potential manufacture of 100 per cent pure cocaine, 2006-2014 (tons)
2006 2007 2008 2009 2010 2011 2012 2013 2014 Bolivia (Plurinational state of) 94 104 113 .. .. .. .. .. .. Colombia a 660 630 450 488 424 384 333 290 442 Range 240-377 249-331 345-540 Peru 280 290 302 ... .. .. .. .. .. Total based on "old" conversion ratios* 1,034 1,024 865 842 788 776 714 662 746 Total based on"new" conversion ratios* 1,232 1,234 1,122 1,111 1,060 1,051 973 902 943 Sources: Plurinational State of Bolivia: Own calculations based on UNODC (Yungas of La Paz) and DEA scientific studies (Chapare) coca leaf yield surveys. Colombia: National illicit crop monitoring system supported by UNODC and DEA scientific studies. Because of the introduction of an adjustment factor for small fields, estimates since 2010 are not directly comparable with previous years.Because of the introduction of an adjustment factor for small fields, estimates since 2010 are not directly comparable with previous years.Taking into account the incorporation (in 2013) of two adjustments to the methodological processes used to calculate coca production in Colombia with a view to improving accuracy (the permanence factor, which improves estimates of production area, and the differentiated cocaine base conversion factor, which takes account of emerging trends in the alkaloid extraction process), the continuity of the historical data is affected. Data from 2009 onwards have been adjusted. Peru: Own calculations based on coca leaf to cocaine conversion ratio from DEA scientific studies. Detailed information on the ongoing revision of conversion ratios and cocaine laboratory efficiency is available in the World Drug Report 2010 (p. 249).
Note: *Conversion of hectares under coca cultivation into coca leaf and then into cocaine HCl, taking yields, amounts of coca leaf used for licit purposes and cocaine laboratory efficiency into account. Because of the ongoing review of conversion factors in Bolivia (Plurinational State of) and Peru, no final estimates of the level of cocaine production can be provided. Figures in italics are being reviewed. Two dots indicate that data are not available. Information on estimation methodologies and definitions can be found in the online methodology section of the present report.
Global cocaine interception rates,* 2014
Global cocaine production estimates (tons), based on: Global cocaine seizures (tons) Global interception rate* (percentage) "old" conversion ratios "new" conversion ratios As reported (at "street purity") (Wholesale-) purity adjusted seizures (100% pure substance), based on: "unweighted" average of reported purities (62%)** average of purities 'weighted' by seizures (69% for cocaine HCL/73% for all cocaine) Production of cocaine (100%pure), in tons 746 943 Seizures of cocaine HCl, in tons 566 351 390 Interception rate - Best estimate a b 43 - Minimum a b 37 - Maximum a b 55 Seizures of cocaine HCl, cocaine paste, cocaine base and crack-cocaine, in tons 655 406 507 Interception rate - Best estimate a b 54 - Minimum a b 43 - Maximum a b 68 Source: Coca cultivation surveys in Colombia, Peru and the Plurinational State of Bolivia, 2014 and UNODC, annual report questionnaire data.
Note: Calculation of interception rate = b/a (for example 507/943 = 54 per cent). *Seizures adjusted for wholesale purity divided by cocaine production estimates. ** Calculation based on wholesale purity information from 63 countries or latest year available over the 2005-2014 period (information from 23 countries reporting in 2014, 23 over the 2010-13 period and 17 over the 2005-2009 period).
Opium/Heroin
Cultivation of opium poppy in selected countries, 1998-2015 (hectares)
2000 2001 2002 2003 2004 2005 2006 2007 2008 2009 2010 2011 2012 2013 2014 2015 SOUTH-WEST ASIA Afghanistan 82,171 7,606 74,100 80,000 131,000 104,000 165,000 193,000 157,000 123,000 123,000 131,000 154,000 209,000 224,000 183,000 minimum 102,000 104,000 109,000 125,000 173,000 196,000 163,000 maximum 137,000 145,000 155,000 189,000 238,000 247,000 202,000 Pakistan (best estimate) 260 213 622 2,500 1,500 2,438 1,545 1,701 1,909 1,779 1,721 362 382 493 217 372 Subtotal (best estimate) 82,431 7,819 74,722 82,500 132,500 106,438 166,545 194,701 158,909 124,779 124,721 131,362 154,382 209,493 224,217 183,372 SOUTH-EAST ASIA Lao People's Democratic Republic� (best estimate) 19,052 17,255 14,000 12,000 6,600 1,800 2,500 1,500 1,600 1,900 3,000 4,100 6,800 3,900 6,200 5,700 minimum 904 2,040 1,230 710 1,100 1,900 2,500 3,100 1,900 3,500 3,900 maximum 2,890 2,990 1,860 2,700 2,700 4,000 6,000 11,500 5,800 9,000 7,600 Myanmar� (best estimate) 108,700 105,000 81,400 62,200 44,200 32,800 21,500 27,700 28,500 31,700 38,100 43,600 51,000 57,800 57,600 55,000 minimum 65,600 49,500 38,500 .. .. 22,500 17,900 20,500 17,300 29,700 38,249 45,710 41,400 42,800 maximum 97,500 71,900 49,600 .. .. 32,600 37,000 42,800 58,100 59,600 64,357 69,918 87,300 69,600 Thailand b 890 820 750 842 129 119 157 205 288 211 289 289 209 265 .. .. Viet Nam b (best estimate) Subtotal (best estimate) 128,642 123,075 96,150 75,042 50,929 34,719 24,157 29,405 30,388 33,811 41,389 47,989 58,009 61,965 64,065 61,465 SOUTH AND CENTRAL AMERICA Colombia (best estimate) 6,500 4,300 4,153 4,026 3,950 1,950 1,023 715 394 356 341 338 313 298 387 .. Mexico c (best estimate) 1,900 4,400 2,700 4,800 3,500 3,300 5,000 6,900 15,000 19,500 14,000 12,000 10,500 11,000 17,000 24,800 minimum 21,500 maximum 28,100 Guatemala (best estimate) .. .. .. .. 330 100 .. .. .. .. .. .. 220 310 640 .. Subtotal (best estimate) 8,400 8,700 6,853 8,826 7,780 5,350 6,023 7,615 15,394 19,856 14,341 12,338 11,033 11,608 18,027 25,827 OTHER Other countries d (best estimate) 2,479 2,500 2,500 3,074 4,731 4,993 4,275 3,979 8,312 7,489 10,211 15,811 11,471 12,225 10,400 10,400 TOTAL (best estimate) 221,952 142,094 180,225 168,600 195,940 151,500 201,000 235,700 213,003 185,935 190,662 207,500 234,895 295,291 316,709 281,064 minimum 152,935 149,762 170,000 189,444 245,201 269,809 243,264 maximum 211,835 233,662 249,400 287,952 338,309 372,209 319,364 TOTAL best estimate (rounded) 222,000 142,100 180,200 168,600 195,900 151,500 201,000 235,700 213,000 185,900 190,700 207,500 234,900 295,300 316,700 281,100 Source: Afghanistan: before 2003: UNODC; since 2003: national illicit crop monitoring system supported by UNODC. Pakistan: annual report questionnaire, Government of Pakistan, United States Department of State. Lao People's Democratic Republic before 2000: UNODC; since 2000: national illicit crop monitoring system supported by UNODC. Myanmar: before 2001: United States Department of State; since 2001: national illicit crop monitoring system supported by UNODC. Colombia: before 2000: various sources, since 2000: national illicit crop monitoring system supported by UNODC. Mexico: Before 2015: estimates derived from United States Government surveys (INCSR); since 2015: national illicit crop monitoring system suppored by UNODC. Guatemala: United States Department of State (INCSR 2016).
Note: Figures in italics are preliminary and may be revised when updated information becomes available. Information on estimation methodologies and definitions can be found in the methodology section of the online version of the present report.
� May include areas that were eradicated after the date of the area survey.
b Owing to continuing low cultivation, figures for Viet Nam as of 2000 were included in the category "Other countries".
c The Government of Mexico does not validate the estimates provided by the United States Department of State over the 1998-2014 period, as they are not part of its official figures and it does not have information on the methodology used to calculate them. The Government of Mexico has implemented a monitoring system in collaboration with UNODC to estimate illicit cultivation for 2015. The figures prior to 2015 are - for methodologial reasons - not comparable with previous estimates. More information on the opium poppy cultivation estimates and the statistical ranges for 2015 (actually referring to the period July 2014 - June 2015) are contained in a joint report by the Government of Mexico and UNODC entitled "Resultados del Proyecto de Monitoreo de Cultivos Ilícitos en Territorio Mexicano" ("Results of the Project on Monitoring Illicit Cultivations on Mexican territory").
d Eradication and plant seizure reports from different sources indicate that illicit opium poppy cultivation also exists in the following subregions: North Africa, Central Asia and Transcaucasia, Near and Middle East/South-West Asia, South Asia, East and South-East Asia, Eastern Europe, South-Eastern Europe, Central America and South America. Starting in 2008, a new methodology was introduced to estimate opium poppy cultivation and opium/heroin production in these countries. These estimates are higher than the previous figures but have a similar order of magnitude. A detailed description of the estimation methodology is available in the online version of the World Drug Report.
Global potential production of oven-dry opium in selected countries, 2000-2015 (tons)
2000 2001 2002 2003 2004 2005 2006 2007 2008 2009 2010 2011 2012 2013 2014 2015 SOUTH-WEST ASIA Afghanistan 3,276 185 3,400 3,600 4,200 4,100 5,300 7,400 5,900 4,000 3,600 5,800 3,700 5,500 6,400 3,300 minimum 3,000 4,800 2,800 4,500 5100 2,700 maximum 4,200 6,800 4,200 6,500 7800 3,900 Pakistan (best estimate) 8 5 5 52 40 36 39 43 48 44 43 9 9 12 5 9 Subtotal (best estimate) 3,284 190 3,405 3,652 4,240 4,136 5,339 7,443 5,948 4,044 3,643 5,809 3,709 5,512 6,405 3,309 SOUTH-EAST ASIA Lao People's Democratic Republic� (best estimate) 167 134 112 120 43 14 20 9 10 11 18 25 41 23 92 minimum 7.2 16.3 7.4 4.3 6.6 11.4 15 18 11 51 84 maximum 23.1 23.9 11.2 16.2 16.2 24 36 69 35 133 176 Myanmar� (best estimate) 1,087 1,097 828 810 370 312 315 460 410 330 580 610 690 870 670 647 minimum 213 350 420 520 630 481 498 maximum 445 820 830 870 1,100 916 815 Thailand b 6 6 9 6 2 2 2 3 5 3 5 6 3 4 Viet Nam b (best estimate) Subtotal (best estimate) 1,260 1,237 949 936 415 328 337 472 424 345 603 641 734 897 766 781 SOUTH AND CENTRAL AMERICA Colombia (best estimate) 88 80 52 50 49 24 13 14 10 9 8 8 8 11 12 Mexico c (best estimate) 21 91 58 101 73 71 108 150 325 425 300 250 220 225 360 475 minimum 275 maximum 641 Guatemala (best estimate) 12 4 4 6 14 Subtotal (best estimate) 109 171 110 151 134 75 121 164 335 434 308 258 232 242 386 501 OTHER Other countries d (best estimate) 38 32 56 50 61 82 16 15 139 134 181 281 156 159 175 175 TOTAL (best estimate) 4,691 1,630 4,520 4,783 4,850 4,620 5,810 8,091 6,841 4,953 4,730 6,983 4,831 6,810 7,732 4,766 minimum 3,898 5,789 3,738 5,558 6,202 3,771 maximum 5,581 8,220 5,539 8,052 9,420 5,746 TOTAL best estimate (rounded) 4,690 1,630 4,520 4,780 4,850 4,620 5,810 8,090 6,840 4,950 4,730 6,980 4,830 6,810 7,730 4,770 Sources: Afghanistan: before 2003: UNODC; since 2003: national illicit crop monitoring system supported by UNODC. Pakistan: annual report questionaire Government of Pakistan, United States Department of State. Lao People's Democratic Republic: before 2000: UNODC; since 2000: national illicit crop monitoring system supported by UNODC. Myanmar: before 2001: United States Department of State; since 2001: national illicit crop monitoring system supported by UNODC. Colombia: before 2000: various sources, since 2000: national illicit crop monitoring system supported by UNODC. Since 2008, production was calculated based on updated regional yield figures and conversion ratios from United States Department of State/DEA. Mexico: Before 2015: Estimates derived from United States Government surveys; data for 2015 based on cultivation surveys by the national illicit crop monitoring system supported by UNODC; yield ratios based on United States yield studies, conducted 2001-2003 in Mexico; Guatemala: United States Department of State (INCSR 2016).
Note: The opium production estimates for Afghanistan for 2006 to 2009 were revised after data quality checks revealed an overestimation of opium yield estimates in those years. Figures in italics are preliminary and may be revised when updated information becomes available. Information on estimation methodologies and definitions can be found in the online methodology section of the present report.
a May include areas eradicated after the date of the area survey. 2014 figures are not comparable to 2013 because two provinces were added to the survey and the timing of the survey was different.
b Because of continuing low levels of cultivation, figures for Viet Nam (as of 2000) were included in the category "Other countries."
c The Government of Mexico does not validate the estimates provided by the United States until 2014, as they are not part of its official figures and it does not have information on the methodology used to calculate them. The Government of Mexico has established, as of 2015, a system to monitor the area under opium poppy cultivation and is in the process of implementing a system, in collaboration with UNODC, to also estimate illicit opium production. Opium production estimates for 2015 are based on (i) the area under cultivation, established by the joint project of the Government of Mexico and UNODC and (ii) yield data, based on yield studies conducted by the United States in Mexico over the 2001-2003 period. The opium production figures shown for 2015 are preliminary and, for methodological reasons, are not comparable with the production figures over the 1998-2014 period. The opium production estimates for 2015, calculated by UNODC, have not been validated by the Government of Mexico.The production figures will be adjusted, once yield data from the joint Mexico/UNODC project entitled "Monitoring of the Illicit Cultivation on Mexican Territory" become available.
d Eradication and plant seizure reports from different sources indicate that illicit opium poppy cultivation also exists in the following subregions: North Africa, Central Asia and Transcaucasia, Near and Middle East/South-West Asia, South Asia, East and South-East Asia, Eastern Europe, Southeast Europe, Central America and South America. Starting in 2008, a new methodology was introduced to estimate opium poppy cultivation and opium/heroin production in these countries. These estimates are higher than the previous figures but have a similar order of magnitude. A detailed description of the estimation methodology is available in the online version of the World Drug Report.
Potential manufacture of heroin (of unknown purity) out of global (illicit) opium production, 2004-2015 (tons)
2005 2006 2007 2008 2009 2010 2011 2012 2013 2014 2015 Total potential opium production 4,620 5,810 8,091 6,841 4,953 4,730 6,983 4,831 6,810 7,723 4,770 Potential opium not processed into heroin 1,169 1,786 3,078 2,360 1,680 1,728 3,400 1,850 2,600 2,450 1,360 Potential opium processed into heroin 3,451 4,024 5,012 4,481 3,273 3,002 3,583 2,981 4,210 5,273 3,410 Total potential heroin manufacture 472 553 686 600 427 383 467 377 555 542 327 Notes: The calculation shows the potential amount of heroin that could have been manufactured out of the opium produced in a given year; it does not take into account changes in opium inventories, which may be also used for the manufacture of heroin and which may be important. Only in the case of Afghanistan is the proportion of potential opium production not converted into heroin within the country estimated. For all other countries, for the purpose of this table, it is assumed that all opium produced is converted into heroin. If all of the opium produced in Afghanistan in 2015 had been converted into heroin, the total potential heroin manfuacture would have risen to 300 tons in Afghanistan or 447 tons at the global level (the estimates for 2006 to 2009 were revised owing to the revision of opium production figures for Afghanistan).
The amount of heroin produced in Afghanistan is calculated using two parameters that may change: (a) the distribution between opium that is not processed and opium processed into heroin; and (b) the conversion ratio. The first parameter is indirectly estimated, based on seizures of opium versus seizures of heroin and morphine reported by neighbouring countries. From 2004 to 2013 a conversion ratio of opium to morphine/heroin of 7:1 was used, based on interviews conducted with Afghan morphine/heroin "cooks"; based on an actual heroin production exercise conducted by two (illiterate) Afghan heroin "cooks", documented by the German Bundeskriminalamt in Afghanistan in 2003 (published in Bulletin on Narcotics, vol. LVII, Nos. 1 and 2, pp. 11-31, 2005); and UNODC studies on the morphine content of Afghan opium (12.3 per cent over the 2010-2012 period, down from 15 per cent over the 2000-2003 period). The ratio was modified to 18:5 kg of opium for 1 kilogram of 100 per cent pure white heroin hydrochloride, equivalent to a ratio of 9.6:1 for heroin at an estimated 52 per cent export quality (see Afghan Opium Survey 2014); based on an estimated export quality of 59 per cent in 2015, the ratio was adjusted to 11:1 for 2015 (range: 10:4:1 to 11.6:1; see Afghan Opium Survey 2015). The estimates of the export quality of Afghan heroin are based on the average heroin wholesale purities reported by Turkey. For countries other than Afghanistan, a "traditional" conversion ratio of opium to heroin of 10:1 is used. The ratios will be adjusted when improved information becomes available. Figures in italics are preliminary and may be revised when updated information becomes available.
Reported opium poppy eradication in selected countries, 2005 to 2015
Unit of measurement 2005 2006 2007 2008 2009 2010 2011 2012 2013 2014 2015 Afghanistan Hectares 5,103 15,300 19,047 5,480 5,351 2,316 3,810 9,672 7,348 2,692 3,760 Algeria Plants 868 340 204 2,721 7,470 Azerbaijan Hectares 2 0.2 0.4 0.5 Azerbaijan Plants 201 2,628 34 284 Bangladesh Hectares 4 8 22 Canada Hectares 7 7 Canada Plants 60,000 60,000 Colombia Hectares 2,121 1,929 375 381 546 711 299 319 514 813 Ecuador Plants 7,500 74,555 115,580 257,306 44,200 4,025,800 2,554,865 2,023,385 Egypt Hectares 45 50 98 121 98 222 1 3 Greece Plants 192 60 144 Guatemala Hectares 489 720 449 536 1,345 918 1,490 590 2,568 1,197 India Hectares 12 247 8,000 624 2,420 3,052 5,746 1,332 865 1,636 Iran (Islamic Republic of) Hectares 2 1 1 1 Iran (Islamic Republic of) Plants 140,000 100,000 120,000 Italy Plants 1,797 2,007 6,717 Kazakhstan Plants 1,692 2,254 Lao People's Democratic Republic Hectares 2,575 1,518 779 575 651 579 662 707 397 809 Lebanon Hectares 27 8 21 14 4 6 1 Mexico Hectares 21,609 16,890 11,046 13,095 14,753 15,491 16,389 15,726 14,662 21,644 25,959 Myanmar Hectares 3,907 3,970 3,598 4,820 4,087 8,268 7,058 23,718 12,288 15,188 13,450 Nepal Hectares 1 21 35 Pakistan Hectares 391 354 614 0 105 68 1053 592 568 1,010 605 Peru Hectares 92 88 28 23 32 21 Poland Hectares 9 Republic of Moldova Plants 32,413 11,255 Republic of Korea Plants 25,369 Russian Federation Hectares 4 2 3 1 1 1 1 Russian Federation Plants 645 Tajikistan Plants 13 5,400 103 Thailand Hectares 110 153 220 285 201 278 208 205 264 Ukraine Hectares 28 436 39 Ukraine Plants 1,185,118 474,000 22,800,000 Uzbekistan Hectares 1 1 0.3 Venezuela (Bolivarian Republic of) Hectares 154 Viet Nam Hectares 38 99 31 38 35 25 19 TOTAL Hectares 36,643 41,220 44,302 26,088 29,687 32,392 36,791 52,897 39,551 44,203 TOTAL Plants 7,500 - - 74,555 115,580 1,505,089 140,866 4,666,196 25,483,152 2,154,182 Source: UNODC annual report questionnaire; Government reports; reports of regional bodies; and the United States International Narcotics Control Strategy Report.
Annual prevalence of the use of cannabis, opioids and opiates, by region and globally, 2014
Region or subregion Cannabis Opioids
(opiates and prescription opioids)Opiates Number (thousands) Prevalence (percentage) Number (thousands) Prevalence (percentage) Number (thousands) Prevalence (percentage) Best estimate Lower Upper Best estimate Lower Upper Best estimate Lower Upper Best estimate Lower Upper Best estimate Lower Upper Best estimate Lower Upper Africa 47,520 21,030 60,990 7.6 3.4 9.7 2,060 950 3,350 0.33 0.15 0.53 1,960 980 2,440 0.31 0.15 0.38 East Africa 6,640 2,200 11,230 4.2 1.4 7.1 270 100 1,180 0.17 0.06 0.74 240 170 330 0.15 0.11 0.21 North Africa 5,690 2,950 8,620 4.4 2.3 6.6 350 140 560 0.25 0.10 0.41 350 140 560 0.25 0.10 0.41 Southern Africa 4,610 3,190 8,380 5.1 3.5 9.2 370 240 390 0.40 0.26 0.43 310 210 330 0.34 0.23 0.37 West and Central Africa 30,590 12,690 32,760 12.4 5.1 13.3 1,080 470 1,230 0.44 0.19 0.50 1,060 460 1,210 0.43 0.19 0.49 Americas 48,970 48,200 50,550 7.5 7.4 7.7 13,350 13,130 13,620 2.0 2.0 2.1 2,090 1,890 2,270 0.32 0.29 0.35 Caribbean 700 320 1,830 2.5 1.2 6.5 100 60 190 0.4 0.2 0.7 80 50 160 0.28 0.18 0.58 Central America 810 750 910 2.9 2.7 3.3 40 40 50 0.2 0.1 0.2 20 20 20 0.07 0.06 0.08 North America 38,520 38,320 38,730 12.1 12.0 12.1 12,300 12,150 12,450 3.9 3.8 3.9 1,590 1,440 1,680 0.50 0.45 0.52 South America 8,940 8,820 9,070 3.2 3.2 3.3 910 880 930 0.3 0.3 0.3 400 390 410 0.14 0.14 0.15 Asia 56,520 29,890 90,890 1.9 1.0 3.1 12,290 9,280 15,830 0.42 0.32 0.54 10,160 7,690 13,360 0.35 0.26 0.46 Central Asia 1,930 1,350 2,300 3.5 2.4 4.1 490 470 510 0.88 0.85 0.91 450 440 470 0.81 0.78 0.84 East and SouthEast Asia 10,240 6,000 23,510 0.6 0.4 1.5 3,380 2,540 4,740 0.21 0.16 0.30 3,350 2,510 4,700 0.21 0.16 0.30 Near and Middle East 9,650 5,620 13,620 3.4 2.0 4.8 5,400 4,000 6,820| 1.91 1.41 2.41 3,470 2,500 4,650 1.22 0.88 1.64 South Asia 34,700 16,930 51,460 3.5 1.7 5.2 3,020 2,260 3,770 0.31 0.23 0.38 2,890 2,240 3,540 0.29 0.23 0.36 Europe 26,940 26,300 27,680 4.9 4.8 5.1 4,680 4,590 4,960 0.9 0.8 0.9 3,190 3,140 3,480 0.58 0.57 0.63 Eastern and South-Eastern Europe 5,450 4,870 6,130 2.4 2.1 2.7 3,090 3,020 3,160 1.4 1.3 1.4 1,890 1,820 1,960 0.83 0.80 0.86 Western and Central Europe 21,490 21,4301 21,550 6.7 6.7 6.7 1,590 1,560 1,800 0.5 0.5 0.6 1,310 1,320 1,520 0.41 0.41 0.47 Oceania 2,550 2,120 3,540 10.2 8.5 14.2 740 610 760 3.0 2.4 3.0 50 30 50 0.20 0.12 0.19 Global estimate 182,500 127,540 233,650 3.8 2.7 4.9 33,120 28,570 38,520 0.7 0.6 0.8 17,440 13,740 21,590 0.37 0.29 0.45 Source: UNODC estimates based on annual report questionnaire data and other official sources.
Annual prevalence of the use of cocaine�, amphetaminesb and "ecstasy", by region and globally, 2014
Region or subregion Cocaine Amphetamines and prescription stimulants "Ecstasy" Number (thousands) Prevalence (percentage) Number (thousands) Prevalence (percentage) Number (thousands) Prevalence (percentage) Best estimate Lower Upper Best estimate Lower Upper Best estimate Lower Upper Best estimate Lower Upper Best estimate Lower Upper Best estimate Lower Upper Africa 2,770 860 4,990 0.4 0.1 0.8 5,540 1,440 9,530 0.87 0.23 1.50 1,160 370 2,010 0.18 0.06 0.32 East Africa - - - - - - - - - - - - - - - - - - North Africa 30 30 40 0.0 0.0 0.0 780 280 1,290 0.57 0.20 0.94 - - - - - - Southern Africa 680 170 780 0.7 0.2 0.9 650 310 880 0.71 0.34 0.96 270 150 330 0.30 0.16 0.36 West and Central Africa 1,710 580 2,600 0.7 0.2 1.1 - - - - - - - - - - - - Americas 9,710 9,400 10,040 1.5 1.4 1.5 7,600 7,320 7,980 1.2 1.1 1.2 3,080 2,970 3,250 0.47 0.45 0.50 Caribbean 180 60 340 0.6 0.2 1.2 220 20 530 0.8 0.1 1.9 50 10 160 0.19 0.04 0.56 Central America 170 170 180 0.6 0.6 0.6 240 240 240 0.9 0.9 0.9 30 30 30 0.11 0.11 0.111 North America 5,140 5,020 5,260 1.6 1.6 1.6 4,560 4,490 4,620 1.4 1.4 1.5 2,490 2,460 2,520 0.78 0.77 0.79 South America 4,210 4,150 4,260 1.5 1.5 1.5 2,580 2,570 2,600 0.9 0.9 0.9 500 470 540 0.18 0.17 0.19 Asia 1,360 440 2,280 0.1 0.0 0.1 19,750 4,300 35,200 0.68 0.15 1.21 11,050 2,720 19,380 0.38 0.09 0.67 Central Asia - - - - - - - - - - - - - - - - - - East and SouthEast Asia 470 370 1,100 0.0 0.0 0.1 9,110 3,530 20,480 0.57 0.22 1.29 3,210 1,660 6,640 0.20 0.10 0.42 Near and Middle East 100 50 140 0.0 0.0 0.1 430 290 850 0.15 0.10 0.30 - - - - - - South Asia - - - - - - - - - - - - - - - - - - Europe 4,040 3,800 4,290 0.7 0.7 0.8 2,410 2,020 2,800 0.4 0.4 0.5 3,500 3,270 3,750 0.64 0.60 0.68 Eastern and South-Eastern Europe 510 300 740 0.2 0.1 0.3 840 480 1,210 0.4 0.2 0.5 1,300 1,090 1,520 0.57 0.48 0.67 Western and Central Europe 3,530 3,510 3,550 1.1 1.1 1.1 1,560 1,540 1,590 0.5 0.5 0.5 2,200 2,170 2,220 0.69 0.68 0.69 Oceania 390 390 470 1.5 1.5 1.9 480 380 520 1.9 1.5 2.1 610 560 620 2.42 2.22 2.49 Global estimate 18,260 14,880 22,080 0.38 0.31 0.46 35,650 15,340 55,900 0.8 0.3 1.2 19,400 9,890 29,010 0.4 0.2 0.6 Source: UNODC estimates based on annual report questionnaire data and other official sources.
a Cocaine includes cocaine salt, "crack" cocaine and other types such as coca paste, cocaine base, basuco, paco and merla. b Amphetamines include both amphetamine and methamphetamine.
Prevalence of use of Ketamine* in the general and youth population (per cent)
LIFE-TIME PREVALENCE PAST-YEAR PREVALENCE PAST MONTH REGION SUB-REGION COUNTRY SURVEY YEAR AGE OF POPULATION GROUP ALL MALE FEMALE ALL MALE FEMALE ALL MALE FEMALE SOURCE America Central America Costa Rica 2010 15-64 0.14 0.21 0.07 ARQ 2012 15-16 0.36 0.53 0.21 ARQ El Salvador 2010 17-25 0.19 0.19 ARQ 2012 17-25 0.20 Estudio Nacional sobre Consumo de Drogas en Poblacion Estudiantil Universitaria de El Salvador, 2012 North America Canada 2004 15 and above 1.00 0.30 ARQ 2007 15 and above 1.10 0.20 ARQ 2010 15 and above 1.40 0.20 ARQ 2010-11 15-16 1.60 2.30 0.80 1.10 1.60 0.00 ARQ United States of America 2002 19-28 1.20 Monitoring the future 2011 2003 19-28 0.90 Monitoring the future 2011 2004 19-28 0.60 Monitoring the future 2011 2005 19-28 0.50 Monitoring the future 2011 2006 19-28 0.50 Monitoring the future 2011 2007 19-28 0.30 Monitoring the future 2011 2008 19-28 0.40 Monitoring the future 2011 2009 19-28 0.50 Monitoring the future 2011 2010 19-28 0.80 Monitoring the future 2011 2011 19-28 0.50 Monitoring the future 2011 2000 12th Grade 2.50 Monitoring the future 2011 2001 12th Grade 2.50 Monitoring the future 2011 2002 12th Grade 2.60 Monitoring the future 2011 2003 12th Grade 2.10 Monitoring the future 2011 2004 12th Grade 1.90 Monitoring the future 2011 2005 12th Grade 1.60 Monitoring the future 2011 2006 12th Grade 1.40 Monitoring the future 2011 2007 12th Grade 1.30 Monitoring the future 2011 2008 12th Grade 1.50 Monitoring the future 2011 2009 12th Grade 1.70 Monitoring the future 2011 2010 12th Grade 1.60 Monitoring the future 2011 2011 12th Grade 1.70 Monitoring the future 2011 2012 12th Grade 1.50 Monitoring the Future 2013 Overview: Key Findings on Adolescent Drug Use 2013 12th Grade 1.40 Monitoring the Future 2013 Overview: Key Findings on Adolescent Drug Use 2014 12th Grade 1.50 Monitoring the Future 2014 South America Argentina 2006 16-65 0.50 0.60 0.40 Psicoactivas en Argentina 2004-2010 2006 16-24 0.70 Psicoactivas en Argentina 2004-2010 2008 16-65 0.30 0.50 0.10 Psicoactivas en Argentina 2004-2010 2008 16-24 0.20 Psicoactivas en Argentina 2004-2010 2009 .. 1.00 1.80 0.40 ARQ 2010 16-65 0.40 0.50 0.30 Psicoactivas en Argentina 2004-2010 2010 16-24 0.20 Psicoactivas en Argentina 2004-2010 2010 12-65 0.30 0.40 0.20 ARQ 2011 13, 15 and 17 0.70 1.00 0.40 Quinta Encuesta Nacional a Estudiantes de Ensehanza Media 2011 2011 15-16 0.60 Quinta Encuesta Nacional a Estudiantes de Ensehanza Media 2011 2011 16-65 0.30 0.40 0.20 ARQ 2014 15-16 0.50 0.70 0.30 Sexto Estudio Nacional Sobre Consumo de Sustancias Psicoactivas en Estudiantes de Ensehanza Media 2014 Bolivia 2012 University students 0.25 0.01 II Estudio Epidemiológico Andino en la Población Universitaria Brazil 2005 15-16 0.20 0.30 0.10 ARQ Chile 2014 15-64 0.02 0.03 0.01 0.00 0.01 0.00 Décimo Primer Estudio Nacional de Drogas en Población General 2014 Colombia 2013 12-65 0.18 Estudio Nacional de Consumo de Sustancias Psicoactivas en Colombia 2013 2012 University students 0.26 0.09 0.02 ARQ Ecuador 2009 .. 0.01 0.00 0.00 ARQ 2012 University students 0.05 0.01 II Estudio Epidemiológico Andino en la Población Universitaria Peru 2006 0.01 0.02 0.00 ARQ 2010 12.65 0.01 0.02 0.00 Informe ejecutivo: IV Encuesta Nacional de consumo de drogas en la población general del Perú 2010 DEVIDA 2012 University students 0.12 0.01 II Estudio Epidemiológico Andino en la Población Universitaria Uruguay 2006 15-64 0.30 0.40 0.20 ARQ 2011 15-65 0.60 0.80 0.50 ARQ 2014 13-17 0.10 0.10 0.10 VI Encuesta Nacional de Consumo de Drogas en Estudiantes de Enseñanza Media 2014 2014 15-65 0.60 0.90 0.30 VI Encuesta Nacional en Hogares sobre consumo de drogas 2014 2015 University students 1.08 1.38 0.87 0.34 0.55 0.18 0.17 0.24 0.12 I Pilot Study on Drug Use among University Students in Uruguay Asia East and South-East Asia China, Hong Kong SAR 2007 11-99 0.6 0.03 ARQ, Central Registry of Drug Abuse 2007 11-20 0.27 0.16 ARQ, Central Registry of Drug Abuse 2008 11-99 0.08 0.04 ARQ, Central Registry of Drug Abuse 2008 11-20 0.34 0.21 ARQ, Central Registry of Drug Abuse 2009 11-99 0.08 0.04 ARQ, Central Registry of Drug Abuse 2009 11-20 0.55 0.56 0.33 0.30 ARQ, Central Registry of Drug Abuse 2011 15-64 0.05 0.09 0.02 ARQ, Central Registry of Drug Abuse 2011 15-16 0.18 0.25 0.11 ARQ, Central Registry of Drug Abuse 2012 15-64 0.05 0.08 0.02 ARQ, Central Registry of Drug Abuse 2012 15-16 0.13 0.18 0.07 ARQ, Central Registry of Drug Abuse 2014 11-20 0.05 0.08 0.03 ARQ, Central Registry of Drug Abuse 2014 11 and above 0.03 0.05 0.02 ARQ, Central Registry of Drug Abuse China, Macao SAR 2006 15-25 2.00 ARQ Indonesia 2009 11-19 0.30 0.20 0.10 ARQ Thailand 2007 12-65 0.70 ARQ Near and Middle East Israel 2005 18-40 0.40 0.10 0.05 ARQ 2005 18-24 0.20 Illegal use of drugs and alcohol in Israel 2009: Seventh national epidemiologial survey 2008 18-40 0.90 0.00 0.00 0.12 0.22 0.03 0.05 0.00 0.00 ARQ 2008 18-24 0.23 Illegal use of drugs and alcohol in Israel 2009: Seventh national epidemiologial survey 2009 18-40 0.90 0.12 0.22 0.03 0.05 ARQ Europe Eastern Europe Ukraine 2011 15-17 0.80 1.50 0.20 ARQ South-Eastern Europe Romania 2010 .. 0.10 0.10 0.10 ARQ 2013 15-64 0.40 0.50 0.20 Studiul national in populatia generala privind consumul de tutun, alcool si droguri GPS - 2013 Western & Central Europe Germany 2009 .. 0.80 1.10 0.40 ARQ France 2003 .. 0.30 0.20 ARQ Spain 2010 14-18 1.10 0.80 0.40 Government 2011 15-64 1.00 0.20 0.00 0.10 0.00 Government 2012 14-18 1.10 0.70 0.70 0.40 Government 2013 15-64 0.80 0.10 0.00 Government United Kingdom England
2006-07 16-59 1.30 0.30 0.10 ARQ 2011 11-15 0.50 0.50 0.50 SDD Survey 2012 11-15 0.50 0.50 0.50 SDD Survey 2013 11-15 0.40 0.50 0.30 SDD Survey 2014 11-15 0.40 0.60 0.20 SDD Survey 2008-09 16-59 1.80 0.70 0.60 0.25 0.20 National report to EMCDDA 2009-10 15-64 4.0 0.50 0.80 0.20 0.20 ARQ United Kingdom (England and Wales)
2006-07 16-24 2.30 0.80 0.30 2010/11 British Crime Survey 2007-08 16-59 1.30 0.40 0.20 2010/11 British Crime Survey 2007-08 16-24 2.20 0.90 0.30 2010/11 British Crime Survey 2008-09 16-24 3.50 1.90 0.80 2010/11 British Crime Survey 2009-10 16-59 2.00 0.50 0.20 Drug Misuse: Findings from the 2010 to 2011 British Crime Survey 2009-10 16-24 4.00 1.70 0.90 Drug Misuse: Findings from the 2010 to 2011 British Crime Survey 2010-11 16-59 2.20 0.60 0.80 0.40 0.30 Drug Misuse: Findings from the 2010 to 2011 British Crime Survey 2010-11 16-24 4.30 2.00 0.90 Drug Misuse: Findings from the 2010 to 2011 British Crime Survey 2011-12 16.59 2.50 0.60 Drug Misuse: Findings from the 2010 to 2012 British Crime Survey 2011-12 16-24 4.00 1.80 Drug Misuse: Findings from the 2010 to 2012 British Crime Survey 2012-13 16-59 2.20 0.40 Drug Misuse: Findings from the 2012 to 2013 British Crime Survey 2012-13 16-24 3.30 0.80 Drug Misuse: Findings from the 2012 to 2013 British Crime Survey 2013-14 16-59 2.70 3.90 1.50 0.60 Drug Misuse: Findings from the 2013 to 2014 British Crime Survey 2013-14 16-24 4.70 1.80 Drug Misuse: Findings from the 2013 to 2014 British Crime Survey 2014-15 16-59 2.60 0.50 0.10 Drug Misuse: Findings from the 2014 to 2015 British Crime Survey 2014-15 16-24 4.00 1.60 0.20 Drug Misuse: Findings from the 2014 to 2015 British Crime Survey Oceania Oceania Australia 2007 15-64 1.30 0.70 0.20 0.10 ARQ 2007 12-17 0.00 0.00 0.00 0.00 ARQ 2010 14 and older 1.40 1.80 0.90 0.21 0.30 0.20 ARQ 2010 15-16 0.10 0.00 ARQ 2010 18-24 2.50 2010 National Drug Strategy Household Surbey Report 2013 14 and older 1.70 2.30 1.20 0.30 0.40 0.20 ARQ New Zealand 2008 16-64 1.20 1.7 0.7 0.30 0.4 0.1 2007/08 New Zealand Alcohol and Drug Use Survey Note: For the purposes of this report, NPS include ketamine, which differs from other NPS in that it is widely used in human and veterinary medicine, while most NPS have little or no history of medical use. Two dots indicate that data are not available.
Prevalence of use of Synthetic Cannabinoids* in the general and youth population (per cent)
LIFE-TIME PREVALENCE PAST-YEAR PREVALENCE PAST MONTH REGION SUB-REGION COUNTRY SURVEY YEAR AGE OF POPULATION GROUP ALL MALE FEMALE ALL MALE FEMALE ALL MALE FEMALE SOURCE Americas North America United States of America 2011 19-30 6.50 9.60 4.50 Monitoring the Future 2011 2011 12th Grade 11.40 Monitoring the Future 2011 2012 12th Grade 11.30 Monitoring the Future 2013 Overview: Key Findings on Adolescent Drug Use 2013 12 th Grade 7.90 Monitoring the Future 2013 Overview: Key Findings on Adolescent Drug Use 2014 12 th Grade 5.80 2.70 Monitoring the Future 2014 South America Chile 2014 15-64 1.59 1.82 1.37 0.56 0.75 0.7 Décimo primer Estudio Nacional de Drogas en Población General 2014 Europe South-Eastern Europe Croatia 2010-11 .. 1.10 1.10 2012 National Report to the EMCDDA Western and Central Europe Latvia 2011 15-64 2.50 3.70 1.40 2012 National Report to the EMCDDA 2011 15-24 6.10 2012 National Report to the EMCDDA 2011 15-16 10.60 15.60 6.30 ARQ 2013 15-16 13.20 14.09 12.26 ESPAD methodological survey Germany 2009 18-64 0.80 1.10 0.40 ARQ 2012 18-64 0.60 0.90 0.30 ARQ 2010 15-64 0.30 0.50 0.10 0.10 0.20 0.10 0.20 0.00 ARQ 2010 15-19 4.10 2011 National Report to the EMCDDA Spain 2010 14-18 1.10 0.80 0.50 Government 2011 15-64 0.80 0.10 0.10 Government 2012 14-18 1.40 1.00 0.60 Government 2013 15.64 0.50 0.10 0.00 Government Sweden 2012 15-16 2.40 2.00 ARQ United Kingdom (England and Wales) 2010-11 16-59 0.20 Drug Misuse: Findings from the 2010 to 2011 British Crime Survey 2010-11 16-24 0.40 Drug Misuse: Findings from the 2010 to 2011 British Crime Survey 2011-12 16-59 0.10 Drug Misuse: Findings from the 2011 to 2012 British Crime Survey Oceania Oceania Australia 2013 14 and older 1.30 ARQ New Zealand 2013 15+ 1.70 2012/13 New Zealand Health Survey: Drug Module * Following their international control in 2015, the synthetic cannabinoids JWH-018 and AM-2201 no longer belong to the category of new psychoactive substances. However, in the context of prevalence of use surveys, it is not possible to differentiate between the synthetic cannabinoids which are and those which are not under international control.
Prevalence of use of miscellaneous new psychoactive substances* in the general and youth populations (per cent)
LIFE-TIME PREVALENCE PAST-YEAR PREVALENCE PAST MONTH REGION SUB-REGION COUNTRY SUBSTANCE SURVEY YEAR AGE OF POPULATION GROUP ALL MALE FEMALE ALL MALE FEMALE ALL MALE FEMALE SOURCE Americas North America Canada Salvia Divinorum 2011 15-64 1.60 2.2 1.1 ARQ, estimated Salvia Divinorum 2010-11 15-16 2.90 8.50 5.80 3.80 5.50 2.00 ARQ United States of America Salvia Divinorum 2011 19-30 2.30 3.50 1.50 Monitoring the Future 2011 Salvia Divinorum 2014 12th Grade 1.80 Monitoring the Future 2014 Salvia Divinorum 2013 12th Grade 3.40 Monitoring the Future 2013 Overview: Key Findings on Adolescent Drug Use Salvia Divinorum 2012 12th Grade 4.40 Monitoring the Future 2013 Overview: Key Findings on Adolescent Drug Use Salvia Divinorum 2011 12th Grade 5.90 Monitoring the Future 2011 Salvia Divinorum 2010 12th Grade 5.50 Monitoring the Future 2011 Salvia Divinorum 2009 12th Grade 5.70 Monitoring the Future 2011 Asia Near and Middle East Israel Khat 2008 18-40 1.84 Illegal use of drugs and alcohol in Israel 2009: Seventh national epidemiological survey Khat 2008 12-18 6.65 Illegal use of drugs and alcohol in Israel 2009: Seventh national epidemiological survey Yemen Khat 2006 12 and above 52.30 72.00 32.60 Towards Qat Demand Reduction (World Bank) Europe SouthEastern Europe Croatia Mephedrone 2010-11 .. 0.30 1.50 2012 National Report to the EMCDDA Western and Central Europe Hungary Mephedrone 2011 16 6.00 5.80 6.30 ARQ Ireland and Northern Ireland Mephedrone 2010/11 15-64 2.00 3.10 0.90 1.10 1.90 0.30 0.10 0.10 0.00 Drug Prevalence Survey 2010/11: Regional Drug Task Force (Ireland) and Health & Social Care Trust (Northern Ireland) Results Mephedrone 2010/11 15-34 4.30 2.20 0.10 Drug Prevalence Survey 2010/11: Regional Drug Task Force (Ireland) and Health & Social Care Trust (Northern Ireland) Results Latvia Salvia Divinorum 2011 15-16 4.40 6.40 2.10 ARQ Malta Mephedrone 2011 15-16 3.50 5.00 2.00 ARQ Ketamine 2009 .. 0.80 1.10 0.40 ARQ Finland MDPV 2010 15-69 0.10 ARQ Slovakia Mephedrone 2010 15-64 0.00 0.10 0.00 ARQ Mephedrone 2010 15-19 1.70 2011 National Report to the EMCDDA Spain Piperazines 2010 14-18 0.40 0.30 0.20 Government Piperazines 2011 15-64 0.10 0.00 0.00 Government Piperazines 2012 14-18 0.40 0.30 0.20 Government Piperazines 2013 15-64 0.00 0.00 0.00 Government Mephedrone 2010 14-18 0.40 0.30 0.20 Government Mephedrone 2012 14-18 0.50 0.30 0.20 Government Mephedrone 2013 15-64 0.10 0.00 0.00 Government Salvia Divinorum 2010 14-18 Government Salvia Divinorum 2011 15-64 0.90 0.20 0.10 Government Salvia Divinorum 2012 14-18 0.80 0.50 0.30 Government Salvia Divinorum 2013 15-64 0.50 0.10 0.00 Government United Kingdom (England and Wales) BZP 2010-11 16-59 0.10 Drug Misuse: Findings from the 2010 to 2011 British Crime Survey BZP 2010-11 16-24 0.20 Drug Misuse: Findings from the 2010 to 2011 British Crime Survey Khat 2010-11 16-59 0.20 Drug Misuse: Findings from the 2010 to 2011 British Crime Survey Mephedrone 2011-12 16-59 1.00 1.50 0.70 Drug Misuse: Findings from the 2011 to 2012 British Crime Survey Mephedrone 2011-12 16-24 3.30 Drug Misuse: Findings from the 2011 to 2012 British Crime Survey Mephedrone 2012-13 16-59 1.90 0.50 Drug Misuse: Findings from the 2012 to 2013 British Crime Survey Mephedrone 2012-13 16-24 4.50 1.60 Drug Misuse: Findings from the 2012 to 2013 British Crime Survey Mephedrone 2013-14 16-59 2.30 3.20 1.40 0.60 Drug Misuse: Findings from the 2013 to 2014 British Crime Survey Mephedrone 2013-14 16-24 6.30 1.90 Drug Misuse: Findings from the 2013 to 2014 British Crime Survey Mephedrone 2014-15 16-59 2.20 0.50 0.20 Drug Misuse: Findings from the 2014 to 2015 British Crime Survey Mephedrone 2014-15 16-24 5.30 1.90 0.50 Drug Misuse: Findings from the 2014 to 2015 British Crime Survey BZP 2011-12 16-59 0.10 Drug Misuse: Findings from the 2011 to 2012 British Crime Survey Salvia Divinorum 2012-13 16-59 0.30 Drug Misuse: Findings from the 2012 to 2013 British Crime Survey Salvia Divinorum 2012-13 16-24 1.10 Drug Misuse: Findings from the 2012 to 2013 British Crime Survey Salvia Divinorum 2013-14 16-59 0.50 Drug Misuse: Findings from the 2013 to 2014 British Crime Survey Salvia Divinorum 2013-14 16-24 1.80 Drug Misuse: Findings from the 2013 to 2014 British Crime Survey Oceania Oceania New Zealand BZP 2008 16-64 13.5 15.70 11.40 5.60 6.40 4.90 2007/08 New Zealand Alcohol and Drug Use Survey BZP 2008 16-17 19.9 15.50 24.30 13.40 9.50 17.30 2007/08 New Zealand Alcohol and Drug Use Survey * Following their international control in 2015, mephedrone, MDPV and BZP no longer belong to the category of new psychoactive substances. However, as the data presented here refers to a time when these substances were not yet controlled internationally, information available on their prevalence of use was included in this table. Two dots indicate that data are not available.
Regulations for legal cannabis in five United States jurisdictions and Uruguay
Alaska Colorado Oregon Washington Washington, D.C. Uruguay Legal process Voter initiative, state statute Voter initiative, amendment to state constitution Voter initiative, state statute Voter initiative, state statute Voter initiative Government initiative, national law Title Ballot Measure 2 Amendment 64 Measure 91 Initiative 502 Initiative 71 Law No. 19.172 Date passed November 2014 November 2012 November 2014 November 2012 November 2014 December 2013 Date implemented February 2015: Personal possession, consumption, cultivation
Late-2016 (expected): Retail salesDecember 2012: Personal possession, consumption, cultivation
January 2014: Retail salesJuly 2015: Personal possession, consumption, cultivation
Oct. 1 2015: Retail sales through medical dispensaries
Late-2016 (expected): retail sales through licensed retailersDecember 2012: Personal possession, consumption
July 2014: Retail salesFebruary 2015: Personal possession, consumption, cultivation August 2014: Personal cultivation
October 2014: Grower clubs
Mid-2016: Pharmacy salesRegulatory authority Marijuana Control Board (Alcoholic Beverage Control Board) Marijuana Enforcement Division (Department of Revenue) Oregon Liquor Control Commission Liquor and Cannabis Board (formerly the Liquor Control Board) Not applicable Instituto de Regulación y Control del Cannabis (IRCCA) Minimum age 21 21 21 21 21 18 Residency requirement None None None None None Uruguayan citizenship or permanent Uruguayan residency required Personal possession quantity 28.5 g 28.5 g In public: 28.5 g 28.5 g 57 g 40 g per month Home cultivation 6 plants, 3 of which can be flowering 6 plants, 3 of which can be flowering 4 plants in flower Not allowed 6 plants per person 12 plants per household, 3 of which can be flowering 6 plants in flower Interpersonal sharing 28.5 g 28.5 g 28.5 g Not allowed 28.5 g Allowed within the home Retail transaction limit 28.5 g Residents: 28.5 g Non-residents: 7 g 7 g 28.5 g Not applicable 40 g per month, 10 g per week (sale through pharmacies to registered users) Retail pricing structure Market Market Market Market Market Government price controls Average retail price per gram after tax No retail stores currently $11.50 $10 $10.00 Not applicable Projected at $1.20-$1.30 (final price will be determined before the product is dispensed) Maximum THC content No maximum No maximum No maximum No maximum No maximum 15% maximum THC content (suggested criterion, not fixed by law) Registration requirements None None None None None Yes, with IRCCA for any mode of access. Commercial production Licensed marijuana producers Licensed marijuana cultivation facilities Licensed marijuana producers Licensed marijuana producers None Licensed marijuana producers Commercial distribution Licensed retail marijuana stores Licensed retail marijuana stores Licensed retail marijuana stores Licensed retailers None Licensed pharmacies Advertising Final advertising regulations to be determined by the Alaska Department of Health and Social Services Division of Public Health Restricted to media with no more than 30 per cent of the audience under the age of 21 Entry sign required on exterior of dispensaries; Oregon Liquor Control Commission has authority to further regulate or prohibit advertising
Limited to one sign for retailers at business location Not applicable, no commercial market Prohibited Taxation $50 excise tax per ounce on sales or transfers from cultivation facility to retail store or product manufacturer 15% excise tax on cultivation; 10% retail marijuana sales tax; 2.9% state sales tax; local sales taxes No tax on retail sales from Oct. 2015-Dec. 2015; 25% sales tax after Jan. 5, 2016 July 2014-June 2014: 25% tax at each stage (production, processing, retail) July 2015: 37% sales tax
Not applicable, no commercial market Tax is deferred, though IRCCA can impose tax in the future. Cannabis clubs Not explicitly allowed or prohibited; ban on in-store consumption repealed in Nov. 2015 Not allowed Not allowed Not allowed Not allowed; currently under investigation by city task force. Clubs with 15-45 members allowed to cultivate up to 99 plants, maximum 480 g of dried product per member per year Medical cannabis 2000: Patient registry, possession, home cultivation 2000: Patient registry, possession, consumption 2010: Commercial production and sales 1999: Patient registry, possession, home cultivation 1999: Possession 2012: Home cultivation 2011: Patient registry 2014: Passed, but not yet effective
Identified substances in waste-water, selected cities, 2011-2014 (milligram /1000 people/per day)*
Country/city/year Benzoylecgonine
(COCAINE metabolite)AMPHETAMINE METHAMPHETAMINE THC-COOH
(CANNABIS metabolite)min max mean min max mean min max mean min max mean Australia Canberra 2014 35.24 97.86 61.07 20.23 27.38 24.54 99.45 120.46 109.10 - - Toowoomba 2014 0.60 8.19 2.32 16.52 21.60 17.59 76.42 124.33 98.22 1.92 5.06 2.42 Belgium Antwerp D. 2012 256.28 353.69 315.63 76.53 134.98 101.99 3.58 6.23 5.01 32.80 82.55 57.30 2013 329.26 683.98 442.72 90.16 157.75 117.96 5.19 10.32 6.64 60.01 134.39 79.53 2014 265.06 564.83 363.77 91.23 170.18 120.16 1.72 3.83 2.34 46.56 108.31 62.67 Antwerp Z. 2011 589.73 919.91 721.18 211.52 318.89 277.18 3.79 6.50 5.46 - - 2012 577.36 865.23 742.05 131.10 188.63 159.47 4.16 8.93 6.33 90.72 140.75 124.70 2013 712.15 1,053.75 836.79 166.19 202.24 185.11 3.63 7.66 5.76 118.57 142.90 129.62 2014 439.30 859.27 632.69 144.14 304.38 212.95 12.59 30.38 23.11 81.80 176.00 126.11 Brussels 2011 115.82 244.04 184.32 22.18 57.57 35.39 - - - - 2012 138.08 253.17 187.19 27.36 52.36 38.85 1.71 2.56 2.09 61.68 89.51 73.11 2013 179.39 276.49 223.81 16.89 34.58 24.80 0.98 2.63 1.71 63.39 117.17 89.47 Geraardsbergen 2013 13.30 31.61 22.88 0.47 1.32 0.82 - - 3.72 9.92 6.59 Koksijde 2013 25.47 70.44 51.68 21.56 31.11 26.48 - - 18.63 42.68 30.42 Ninove 2013 71.28 140.09 106.20 78.41 185.48 111.94 - - 25.95 67.67 39.95 2014 75.66 152.43 114.17 98.39 192.64 129.40 0.23 0.67 0.49 24.92 105.92 45.84 Bosnia and Herzegovina Sarajevo 2013 18.31 44.62 30.58 26.15 80.77 52.42 - - 33.08 46.15 39.77 Canada Granby 2014 64.74 137.17 94.52 14.82 27.66 22.87 - - - - Montreal 2014 115.78 177.79 150.16 7.05 12.55 9.63 - - 36.37 60.46 48.72 Croatia Zagreb 2011 33.99 66.84 49.95 11.00 20.64 14.60 - - 25.15 34.21 30.59 2012 53.52 103.36 69.80 7.25 20.35 12.13 - - 40.31 49.16 44.71 2013 63.07 112.05 80.03 4.06 15.83 10.00 0.76 1.40 1.06 53.47 69.61 63.01 2014 59.26 106.05 77.13 9.48 23.62 15.65 0.62 1.51 0.77 66.85 89.66 78.45 Cyprus Limassol 2013 11.73 18.79 13.92 1.12 2.22 1.69 2.68 4.88 3.48 - - Nicosia 2013 39.24 81.44 61.00 2.73 4.03 3.34 1.12 2.02 1.50 - - Czech Republic Budweis 2011 3.30 10.68 6.82 20.20 37.43 28.51 145.98 205.73 175.49 38.50 69.67 50.37 2012 3.16 6.89 5.25 7.46 25.52 20.13 59.24 146.33 106.45 30.66 72.77 56.36 2013 2.15 3.30 2.58 18.66 23.00 20.61 184.77 252.87 215.29 52.72 83.69 73.28 Prague 2012 35.35 68.85 48.34 29.38 38.35 32.41 172.54 199.58 186.72 57.30 67.32 61.70 2013 36.06 85.50 51.45 34.08 40.41 36.25 308.91 350.64 326.60 73.46 87.53 79.63 Denmark Copenhagen 2013 166.96 322.89 218.55 25.44 37.22 30.64 8.41 10.70 9.78 - - 2014 258.65 495.45 341.80 - - - - - - Finland Espoo 2014 4.39 7.52 6.23 41.53 60.07 48.63 2.75 4.73 3.52 - - Helsinki 2011** 4.67 8.95 6.49 - - - - - - 2012 4.78 19.96 9.27 30.21 59.08 43.73 16.81 35.79 23.74 - - 2013** 6.68 14.95 9.80 66.78 127.34 94.52 - - - - 2014 6.85 14.63 9.40 57.59 89.38 68.53 3.48 4.02 3.70 - - Joensuu 2014 0.13 0.82 0.35 11.60 28.77 21.02 0.95 2.64 1.59 - - Jyäskylä 2014 0.14 0.34 0.25 45.77 54.91 49.87 1.32 1.77 1.49 - - Kotka 2014 1.64 8.71 4.25 90.71 114.26 104.99 1.59 2.30 1.90 - - Kuopio 2014 2.08 6.39 4.30 25.90 72.71 43.27 4.38 7.63 6.15 - - Lahti 2014 7.34 13.89 11.03 110.66 166.96 139.62 2.21 61.64 12.78 - - Lappeenranta 2014 0.37 3.38 1.74 18.79 29.79 22.88 0.67 1.29 0.93 - - Oulu 2014 0.12 0.41 0.28 21.49 27.19 24.86 0.99 1.62 1.27 - - Rovaniemi 2014 0.14 0.81 0.39 29.93 61.71 46.39 1.89 2.68 2.24 - - Savonlinna 2014 0.33 0.90 0.55 12.42 28.62 19.63 10.13 52.66 31.56 - - Tampere 2014 0.72 1.86 1.00 34.66 53.52 41.87 1.20 2.49 1.52 - - Turku 2011** 2.39 3.60 2.97 - - - - - - 2012 - - 24.22 58.09 43.61 33.94 174.68 85.10 - - 2013** 0.74 2.05 1.31 49.49 86.86 63.99 2014 1.19 1.87 1.49 47.58 86.62 62.39 3.04 4.81 3.66 - - Vaasa 2014 0.41 1.27 0.85 30.48 57.25 42.60 1.74 4.71 3.79 - - France Fort-de-France D 2014 804.63 1,869.12 1,094.83 - - - - 294.04 403.31 345.84 Fort-de-France P 2014 224.76 380.37 293.33 - - - - 178.33 266.31 208.80 Paris 2011 167.77 263.28 206.30 - - - - 36.68 259.23 123.59 2012 122.40 356.31 215.42 - - - - 104.32 140.77 117.46 2013 155.46 359.59 242.66 - - 3.32 4.89 4.00 118.79 178.45 151.03 2014 171.92 318.70 233.96 - - - - 102.39 147.11 121.36 Germany Berlin 2014 133.43 266.61 198.29 80.11 146.55 115.27 5.59 10.57 7.91 46.80 70.53 58.30 Dortmund 2013 274.55 407.08 324.14 80.78 119.61 92.23 - - 74.94 100.46 84.53 2014 150.62 310.79 243.26 85.25 181.30 138.29 - - 42.63 92.77 74.52 Dresden 2013 3.02 8.49 6.00 - - 106.24 171.49 136.61 27.22 34.48 29.93 2014 6.79 9.98 8.39 9.64 33.00 22.01 114.98 159.80 133.02 24.84 45.73 31.32 Dülmen 2013 26.18 93.38 48.43 50.16 91.00 62.85 - - 38.27 84.64 59.79 2014 12.02 60.92 31.85 48.63 100.74 67.63 - - 27.08 41.59 34.52 Munich 2014 5.33 130.13 79.46 13.32 38.52 22.19 - - 7.99 47.29 34.42 Greece Athens 2013 47.08 75.26 59.21 12.03 18.92 16.05 3.90 5.65 4.76 25.13 230.02 103.56 2014 63.24 113.85 80.06 9.41 25.00 16.84 3.90 6.28 5.30 23.70 124.30 67.45 Italy Milan 2011 199.89 314.56 238.85 4.43 15.47 11.05 41.37 63.47 48.68 24.60 41.55 27.61 2012 193.50 286.37 241.75 - - 8.61 12.12 10.11 17.83 36.14 24.25 2013 177.79 288.68 233.17 - - 4.13 8.38 5.93 18.49 37.02 24.91 2014 196.68 224.73 208.05 - - 4.99 6.07 5.37 19.53 31.69 23.86 Netherlands Amsterdam 2011 612.06 676.18 644.10 70.73 181.64 123.57 - - 155.64 227.57 191.77 2012 429.58 951.28 650.49 17.15 35.57 27.59 3.69 10.82 6.41 138.31 219.61 178.95 2013 296.58 603.69 393.00 33.34 157.06 70.81 3.13 11.66 5.24 - - 2014 626.72 830.81 716.38 23.82 155.41 89.94 1.31 5.08 2.96 273.45 1,016.30 469.37 Bendern 2014 112.16 175.40 140.04 12.71 122.68 55.74 - - - - Eidhoven 2011 335.00 612.00 437.42 135.82 9,372.00 3,039.78 - - 76.45 116.63 102.77 2012 213.57 465.02 349.83 167.92 863.53 146.75 - - 60.58 102.36 84.42 2013 187.32 918.06 426.62 177.09 2,459.90 1,129.51 - - - - 2014 302.05 503.15 380.83 141.37 324.03 203.73 - - 70.52 125.00 92.55 Utrecht 2011 253.67 468.92 356.34 54.04 103.67 83.46 - - 85.75 128.67 109.17 2012 274.72 456.43 344.77 38.51 60.42 46.67 0.82 2.45 1.40 119.15 169.13 133.29 2013 102.79 324.48 199.16 29.80 76.41 46.52 - - - - 2014 184.65 258.01 220.20 42.07 268.21 111.06 - - 47.67 159.19 93.99 Norway Oslo 2011 39.26 76.80 52.59 10.49 16.95 12.31 186.16 302.46 244.79 - - 2012 55.22 149.98 96.35 55.86 128.58 88.58 118.64 221.81 168.75 66.98 113.46 86.31 2013 35.38 131.11 69.88 46.60 77.15 63.99 69.31 139.32 107.90 - - 2014 163.84 393.68 270.93 - - 199.80 292.23 237.40 - - Portugal Almada 2014 38.91 71.23 54.49 0.38 2.69 1.06 0.38 1.59 0.65 26.52 54.98 45.05 Lisbon 2013 85.61 135.10 106.82 - - - - - - Serbia Belgrade 2013 19.95 87.80 40.69 9.44 20.71 16.70 - - 12.45 21.47 16.92 Novi Sad 2013 10.04 21.46 15.78 20.08 42.92 25.67 - - Slovakia Bratislava 2013 16.99 50.92 37.56 12.92 19.41 16.58 127.92 192.05 163.77 29.91 51.35 41.45 Piestany 2013 2.37 6.38 3.23 11.86 18.96 13.99 108.20 163.44 123.80 15.66 25.97 20.92 Spain Barcelona 2011 249.14 560.93 421.68 7.40 25.29 15.41 6.43 10.66 8.43 58.17 136.98 108.63 2012 338.01 472.60 400.59 10.59 16.72 13.37 22.28 34.73 26.55 56.52 92.31 78.52 2013 366.92 722.27 537.99 16.22 27.99 21.11 24.83 28.48 26.52 105.23 148.03 126.09 2014 402.79 541.81 461.10 20.89 43.56 29.79 14.41 34.65 22.15 119.83 204.56 165.74 Castellon 2011 226.85 565.54 371.57 - - - - 28.61 139.29 101.73 2012 155.14 376.59 262.96 - - - - 96.54 170.67 117.35 2013 112.30 300.83 174.51 4.45 10.42 8.60 - - 40.00 73.94 55.74 2014 57.84 430.13 206.28 - - - - 41.74 88.32 60.22 Santiago 2011 115.20 319.67 211.22 22.29 41.20 33.84 - - 36.57 138.20 78.79 2012 99.01 390.46 239.98 - - - - 57.85 193.61 116.95 2013 84.01 216.24 130.21 - - - - 38.16 76.38 56.72 2014 144.39 216.84 165.17 - - - - 60.06 96.44 78.27 Valencia 2011** 248.49 884.57 497.70 9.76 21.86 16.29 8.21 15.91 12.26 10.45 20.44 14.25 2013 312.99 582.1 1 401.50 5.31 11.64 7.96 0.96 1.47 1.16 56.30 92.18 67.72 2014 179.50 643.10 378.16 7.44 22.56 14.73 0.97 1.34 1.19 31.80 149.53 67.27 Sweden Gothenburg 2012 16.86 42.75 25.30 75.15 124.98 87.14 36.58 62.57 50.04 - - 2013 21.95 53.73 30.58 134.70 266.44 215.33 - - - - Stockholm 2011 31.11 83.23 48.82 23.32 46.46 32.80 6.31 15.06 9.44 - - Umeå 2011 0.51 4.87 2.63 7.22 22.16 13.82 1.29 4.37 2.93 - - 2012 - - - - 0.65 1.34 0.94 - - 2013 2.58 7.44 5.07 13.22 48.85 29.99 - - - - Switzerland Basel 2012 221.15 352.94 281.22 - - - - - - 2013 359.43 536.12 436.64 14.77 56.55 33.89 2.23 18.85 12.83 - - 2014 404.31 609.73 453.47 10.18 32.56 16.56 12.63 16.22 14.13 - - Berne 2012 224.03 323.60 265.50 26.41 45.19 33.05 3.79 24.69 19.55 - - 2013 187.90 418.27 264.34 14.11 28.43 19.06 13.33 18.78 16.01 - - 2014 335.50 393.30 365.08 16.03 21.32 18.12 5.34 13.92 10.23 - - Biel 2014 170.38 316.51 239.59 12.39 26.02 19.31 3.89 29.57 19.07 - - Chur 2014 101.24 210.57 130.65 1.09 14.08 8.47 1.09 5.55 2.14 57.24 104.82 78.38 Geneva 2012 272.61 502.62 341.15 14.88 70.98 38.96 - - - - 2013 281.92 664.09 373.45 - - - - - - Lausanne 2014 242.43 460.52 311.89 4.80 13.41 7.26 2.21 6.41 3.81 73.62 215.27 116.80 Lugano 2014 185.86 299.1 1 240.60 - - - - 35.84 79.26 58.74 Luzern 2014 240.78 593.17 337.36 17.03 42.70 25.18 7.76 14.60 10.20 77.27 137.60 93.40 Neuchatel 2014 74.47 146.38 105.81 7.37 14.35 10.53 22.39 46.05 33.38 103.44 173.43 125.38 Sion 2014 60.41 93.04 71.09 - - 1.27 3.31 1.63 69.96 114.30 86.37 St. Gallen 2012 186.59 275.16 225.32 - - - - - - 2013 293.21 470.28 380.47 - - 7.76 41.39 16.55 - - 2014 252.59 492.31 350.99 12.09 172.55 65.13 2.09 9.07 5.05 - - Winterthur 2014 266.59 508.27 329.85 14.03 26.58 19.85 2.63 11.07 7.92 - - Zurich 2012 368.17 552.99 436.86 - - - - - - 2013 526.12 877.20 678.79 13.15 65.13 42.65 2.63 21.26 16.65 - - 2014 445.62 834.48 598.27 13.33 53.27 25.65 17.38 25.39 21.79 - - United Kingdom Bristol 2014 183.79 369.63 248.30 70.91 92.42 82.99 1.52 2.78 2.05 - - London 2011 335.15 532.41 392.71 26.31 46.20 37.60 6.54 13.72 8.18 - - 2013 421.04 978.90 710.65 - - 2.01 17.09 8.94 - - 2014 660.29 852.05 737.33 - - - - - - Source: Sewage Analysis CORE Group Europe (SCORE).
* Note: population normalized loads found over a one week period in waste-water. **Results could not be validated by the SCORE project because of no interlab data or failing interlab test.
This report uses a number of regional and subregional designations. These are not official designations, and are defined as follows:
- East Africa: Burundi, Comoros, Djibouti, Eritrea, Ethiopia, Kenya, Madagascar, Mauritius, Rwanda, Seychelles, Somalia, Uganda and United Republic of Tanzania
- North Africa: Algeria, Egypt, Libya, Morocco, South Sudan, Sudan and Tunisia
- Southern Africa: Angola, Botswana, Lesotho, Malawi, Mozambique, Namibia, South Africa, Swaziland, Zambia and Zimbabwe
- West and Central Africa: Benin, Burkina Faso, Cameroon, Cabo Verde, Central African Republic, Chad, Congo, Côte d'Ivoire, Democratic Republic of the Congo, Equatorial Guinea, Gabon, Gambia, Ghana, Guinea, Guinea-Bissau, Liberia, Mali, Mauritania, Niger, Nigeria, Sao Tome and Principe, Senegal, Sierra Leone and Togo
- Caribbean: Antigua and Barbuda, Bahamas, Barbados, Bermuda, Cuba, Dominica, Dominican Republic, Grenada, Haiti, Jamaica, Saint Kitts and Nevis, Saint Lucia, Saint Vincent and the Grenadines and Trinidad and Tobago
- Central America: Belize, Costa Rica, El Salvador, Guatemala, Honduras, Nicaragua and Panama
- North America: Canada, Mexico and United States of America
- South America: Argentina, Bolivia (Plurinational State of), Brazil, Chile, Colombia, Ecuador, Guyana, Paraguay, Peru, Suriname, Uruguay and Venezuela (Bolivarian Republic of)
- Central Asia and Transcaucasia: Armenia, Azerbaijan, Georgia, Kazakhstan, Kyrgyzstan, Tajikistan, Turkmenistan and Uzbekistan
- East and South-East Asia: Brunei Darussalam, Cambodia, China, Democratic People's Republic of Korea, Indonesia, Japan, Lao People's Democratic Republic, Malaysia, Mongolia, Myanmar, Philippines, Republic of Korea, Singapore, Thailand, Timor-Leste and Viet Nam
- South-West Asia: Afghanistan, Iran (Islamic Republic of) and Pakistan
- Near and Middle East: Bahrain, Iraq, Israel, Jordan, Kuwait, Lebanon, Oman, Qatar, Saudi Arabia, State of Palestine, Syrian Arab Republic, United Arab Emirates and Yemen
- South Asia: Bangladesh, Bhutan, India, Maldives, Nepal and Sri Lanka
- Eastern Europe: Belarus, Republic of Moldova, Russian Federation and Ukraine
- South-Eastern Europe: Albania, Bosnia and Herzegovina, Bulgaria, Croatia, Montenegro, Romania, Serbia, the former Yugoslav Republic of Macedonia and Turkey
- Western and Central Europe: Andorra, Austria, Belgium, Cyprus, Czech Republic, Denmark, Estonia, Finland, France, Germany, Greece, Hungary, Iceland, Ireland, Italy, Latvia, Liechtenstein, Lithuania, Luxembourg, Malta, Monaco, Netherlands, Norway, Poland, Portugal, San Marino, Slovakia, Slovenia, Spain, Sweden, Switzerland and United Kingdom of Great Britain and Northern Ireland
- Oceania: Australia, Fiji, Kiribati, Marshall Islands, Micronesia (Federated States of), Nauru, New Zealand, Palau, Papua New Guinea, Samoa, Solomon Islands, Tonga, Tuvalu, Vanuatu and small island territories
- amphetamine-type stimulants — a group of substances composed of synthetic stimulants that were placed under international control in the Convention on Psychotropic Substances of 1971 and are from the group of substances called amphetamines, which includes amphetamine, meth-amphetamine, methcathinone and the "ecstasy"-group substances (3,4-methylenedioxymethamphetamine (MDMA) and its analogues)
- amphetamines — a group of amphetamine-type stimulants that includes amphetamine and methamphetamine
- annual prevalence — the total number of people of a given age range who have used a given drug at least once in the past year, divided by the number of people of the given age range, and expressed as a percentage
- coca paste (or coca base) — an extract of the leaves of the coca bush. Purification of coca paste yields cocaine (base and hydrochloride)
- "crack" cocaine — cocaine base obtained from cocaine hydrochloride through conversion processes to make it suitable for smoking
- cocaine salt — cocaine hydrochloride
- new psychoactive substances — substances of abuse, either in a pure form or a preparation, that are not controlled under the Single Convention on Narcotic Drugs of 1961 or the 1971 Convention, but that may pose a public health threat. In this context, the term "new" does not necessarily refer to new inventions but to substances that have recently become available opiates — a subset of opioids comprising the various products derived from the opium poppy plant, including opium, morphine and heroin
- opioids — a generic term applied to alkaloids from opium poppy (opiates), their synthetic analogues (mainly prescription or pharmaceutical opioids) and compounds synthesized in the body
- poppy straw — all parts (except the seeds) of the opium poppy, after mowing
- problem drug users — people who engage in the high-risk consumption of drugs, for example people who inject drugs, people who use drugs on a daily basis and/or people diagnosed with drug use disorders (harmful use or drug dependence), based on clinical criteria as contained in the Diagnostic and Statistical Manual of Mental Disorders (fifth edition) of the American Psychiatric Association, or the International Classification of Diseases (tenth revision) of the World Health Organization
- people who suffer from drug use disorders/people with drug use disorders — a subset of people who use drugs. People with drug use disorders need treatment, health and social care and rehabilitation. Dependence is a drug use disorder
- prevention of drug use and treatment of drug use disorders — the aim of "prevention of drug use" is to prevent or delay the initiation of drug use, as well as the transition to drug use disorders. Once there is a drug use disorder, treatment, care and rehabilitation are needed
Notes to chapter 1:
1. Wouter Vanderplasschen and others, Poly Substance Use and Mental Health Among Individuals Presenting for Substance Abuse Treatment, Science and Society Series (Gent, Belgium, Academia Press, 2012). [Back]
2. European Monitoring Centre for Drugs and Drug Addiction (EMCDDA), "Polydrug use: patterns and response" (Lisbon, November 2009). [Back]
3. World Health Organization (WHO), Lexicon of Alcohol and Drug Terms (Geneva, 1994). [Back]
4. EMCDDA (see footnote 2). [Back]
5. Danielle Horyniak and others, "How do drug market changes affect characteristic of injecting initiation and subsequent patterns of drug use? Findings from a cohort of regular heroin and methamphetamine injectors in Melbourne, Australia", International Journal of Drug Policy, vol. 26, No. 1 (2015), pp. 43-50. [Back]
6. Nancy M. Petry and Warren K. Bicket, "Poly drug use in heroin addicts: a behavioral economic analysis", Addiction, vol. 93, No. 3 (1998), pp. 321-335. [Back]
7. Mim J. Landry, Understanding Drugs of Abuse: The Processes of Addiction, Treatment and Recovery (Arlington, Virginia, American Psychiatric Publishing, 1994). [Back]
8. WHO, Neuroscience of Psychoactive Substance Use and Dependence (Geneva, 2004). [Back]
9. WHO, The ICD 10, Classification of Mental and Behavioural Disorders: Clinical Descriptions and Diagnostic Guidelines (Geneva, 1992). [Back]
10. Neuroscience of Psychoactive Substance Use (see footnote 8). [Back]
11. Mim J. Landry (see footnote 7). [Back]
12. Charles P. O'Brien, "Benzodiazepine use, abuse and dependence", Journal of Clinical Psychiatry, vol. 66, Suppl. 2 (2005), pp. 28-33. [Back]
13. Vanderplasschen and others, "Poly substance use and mental health" (see footnote 1). [Back]
14. "Polydrug use" (see footnote 2). [Back]
15. Francesco Leri, Jule Bruneau and Jane Stewart, "Understanding polydrug use: review of heroin and cocaine co-use" Addiction, vol. 98, No. 1 (2003), pp. 7-22. [Back]
16. Jenny Chalmers, Deborah Bradford and Craig Jones, "The effect of methamphetamine and heroin price on polydrug use: a behavioural economics analysis in Sydney, Australia", International Journal of Drug Policy, vol. 21, No. 5 (2010), pp. 381-389. [Back]
17. Horyniak and others, "How do drug market changes affect characteristics of injecting initiation and subsequent patterns of drug use?" (see footnote 5). [Back]
18. World Drug Report 2014 (United Nations publication, Sales No. E.14.X1.7). [Back]
19. Jonathan P. Caulkins and Peter H. Reuter, "The meaning and utility of drug prices", Addiction, vol. 91, No. 9 (1996), pp. 1261-1264. [Back]
20. Petry and Bicket, "Poly drug use in heroin addicts: a behavioral economic analysis", (see footnote 6). [Back]
21. Chalmers and others, "The effect of methamphetamine and heroin price on poly drug use" (see footnote 16). [Back]
22. Wilson M. Compton, Christopher M. Jones and Grant T. Baldwin, "Relationship between nonmedical prescription-opioid use and heroin use", New England Journal of Medicine, vol. 374, No. 2 (2016), pp. 154-163. [Back]
23. United States, Center for Behavioral Health Statistics and Quality, Behavioral Health Trends in the United States: Results from the 2014 National Survey on Drug Use and Health, HHS Publication No. SMA 15-4927, NSDUH Series H-50 (Rockville, Maryland, 2015). [Back]
24. Christopher M. Jones, "Heroin use and heroin use risk behaviors among nonmedical users of prescription opioid pain relievers: United States, 2002-2004 and 2008-2010", Drug and Alcohol Dependence, vol. 132, Nos. 1 and 2 (2013), pp. 95-100. [Back]
26. Compton and others, "Relationship between nonmedical prescription" (see footnote 22). [Back]
27. It is recognized that households surveys do not capture the full extent of heroin use and are an underestimation. Nevertheless, in the absence of other trend data, this is used to inform the trends in heroin use. [Back]
28. Jones, "Heroin use and heroin use risk behaviors" (see footnote 24). [Back]
29. World Drug Report 2014 (see footnote 18). [Back]
30. Many of the heroin-related deaths in the United States have also been attributed to the presence of fentanyl in certain parts of the country (United States, Drug Enforcement Administration, National Drug Threat Assessment Summary (October 2015). [Back]
32. Christopher M. Jones and others, "Vital signs: demographic and substance use trends among heroin users — United States, 2002-2013", Morbidity and Mortality Weekly Report, vol. 64, No. 26 (2015). [Back]
33. Jones, "Heroin use and heroin use risk behaviors" (see footnote 24). [Back]
34. Compton and others, "Relationship between nonmedical prescription opioids use" (see footnote 22). [Back]
35. EMCDDA, "Perspectives on drugs: injection of synthetic cathinones", 28 May 2015. [Back]
36. Anna Peterfi and others, "Changes in patterns of injecting drug use in Hungary: a shift to synthetic cathinones", Drug Test and Analysis, vol. 6, Nos. 7 and 8 (2014), pp. 825-831. [Back]
38. Horyniak and others, "How do drug market changes affect characteristics of injecting initiation and subsequent patterns of drug use?" (see footnote 5). [Back]
39. Louisa Dagenhardt and others, "Effects of a sustained heroin shortage in three Australian States", Addiction, vol. 100, No. 7 (2005), pp. 908-920. [Back]
40. Louisa Dagehhardt and others, "The epidemiology of methamphetamine use and harm in Australia", Drug and Alcohol Review, vol. 27, No. 3 (2008), pp. 243-252. [Back]
41. Horyniak and others, "How do drug market changes affect characteristics of injecting initiation and subsequent patterns of drug use?" (see footnote 5). [Back]
43. Brendan Quinn and others, "Methamphetamine use in Melbourne, Australia: baseline characteristics of a prospective methamphetamine-using cohort and correlates of methamphetamine dependence", Journal of Substance Use, vol. 18, No. 5 (2013), pp. 349-362. [Back]
44. EMCDDA, "Perspectives on drugs: health and social responses for methamphetamine users In Europe", 27 May 2014. [Back]
45. EMCDDA, 2014 National Report to the EMCDDA (2013 Data) by the Reitox Greek National Focal Point: Greece — New Developments, Trends (Athens, 2014). [Back]
46. Zahra A. Mehrjerdi, Alasdair M. Barr and Alireza Noroozi, "Methamphetamine-associated psychosis: a new health challenge in Iran", DARU Journal of Pharmaceutical Sciences (2013). [Back]
47. Zahra A. Mehrjerdi, "Crystal in Iran: methamphetamine or heroin kerack", DARU Journal of Pharmaceutical Sciences, 2013. [Back]
48. Zahra Alam-Mehrjerdi, Azarakhsh Mokri and Kate Dolan, "Methamphetamine use and treatment in Iran: a systematic review from the most populated Persian Gulf country", Asian Journal of Psychiatry, vol. 16, 2015, pp. 17-25. [Back]
49. Nasrindokht Sadir and others, "Outcome evaluation of therapeutic community model in Iran", International Journal of Health Policy and Management, vol. 1, No. 2 (2013), pp. 131-135. [Back]
50. Schwann Shariatirad, Masoomeh Maarefvand and Hamed Ekhiari, "Methamphetamine use and methadone maintenance treatment: an emerging problem in the drug addiction treatment network in Iran", International Journal of Drug Policy, vol. 24, No. 6 (2013), pp. e115 and e116. [Back]
51. Darshan Singh and others, "Substance abuse and HIV situation in Malaysia", Journal of Food and Drug Analysis, vol. 21, Suppl. No. 4 (2013), pp. S46—S51. [Back]
52. Joseph Gfroerer and others, "Substance abuse treatment need among older adults in 2020: the impact of the aging baby-boom cohort", Drug and Alcohol Dependence, vol. 69, No. 2 (2003), pp. 127-135. [Back]
53. Wayne Hall, Maria Renstrom and Vladimir Poznyak, eds., The Health and Social Effects of Nonmedical Cannabis Use (Geneva, WHO, 2016). [Back]
54. Jan Copeland, Amie Frewen and Kathryn Elkins, Management of Cannabis Use Disorder and Related Issues: A Clinician's Guide (Sydney, National Cannabis Prevention and Information Centre, University of New South Wales, 2009); Divya Ramesh and Margaret Haney, "Treatment of cannabis use disorders", in Textbook of Addiction Treatment: International Perspectives, N. El-Guebaly, G. Carra and M. Galanter, eds. (Milan, Italy, Springer, 2015); and Alan J. Budney and others, "Marijuana dependence and its treatment", Addiction Science and Clinical Practice, vol. 4, No. 1 (2004), pp. 4-16. [Back]
55. Nora D. Volkow and others, "Adverse health effects of marijuana use", New England Journal of Medicine, vol. 370, No. 23 (2014), pp. 2219-2227. [Back]
56. David Nutt and others, "Development of a rational scale to assess the harm of drugs of potential misuse", The Lancet, vol. 369, No. 9566 (2007), pp. 1047-1053. [Back]
57. Dirk W. Lachenmeier and Jürgen Rehm, "Comparative risk assessment of alcohol, tobacco, cannabis and other illicit drugs using the margin of exposure approach", Scientific Reports, vol. 5, No. 8126 (2015). [Back]
58. Wayne Hall, "The adverse health effects of cannabis use: what are they, and what are their implications for policy?", International Journal of Drug Policy, vol. 20, No. 6 (2009), pp. 458-466; Robin Room and others, Cannabis Policy: Moving Beyond Stalemate (Oxford, Oxford University Press, 2010); and Dan I. Lubman, Ali Cheetham and Murat Yucel, "Cannabis and adolescent brain development", Pharmacology and Therapeutics, vol. 148 (2015), pp. 1-16. [Back]
59. Wayne Hall, "What has research over the past two decades revealed about the adverse health effects of recreational cannabis use?", Addiction, vol. 114, No. 1 (2015), pp. 19-35; and Wayne Hall and Louisa Degenhardt, "Adverse health effects of non-medical cannabis use", The Lancet, vol. 374, No. 9698 (October 2009),pp. 1383-1391. [Back]
60. World Drug Report 2014, footnotes 180 and 181, p. 44. [Back]
61. Wayne Hall and others, The Health and Social Effects of Nonmedical Cannabis Use (see footnote 53). [Back]
62. James C. Anthony, Lynn A. Warner and Ronald C. Kessler, "Comparative epidemiology of dependence on tobacco, alcohol, controlled substances, and inhalants: basic findings from the National Comorbidity Survey", Experimental and Clinical Psychopharmacology, vol. 2, No. 3 (1994), pp. 244-268. [Back]
63. Behavioral Health Trends in the United States: Results from the 2014 National Survey on Drug Use and Health (see footnote 23). [Back]
64. C. Lopez-Quintero and others, "Probability and predictors of transition from first use to dependence on nicotine, alcohol, cannabis, and cocaine: results of the National Epidemiologic Survey on Alcohol and Related Conditions (NESARC)", Drug and Alcohol Dependence, vol. 115, Nos. 1 and 2 (2011), pp. 120-130. [Back]
65. James C. Anthony, "The epidemiology of cannabis dependence", in Cannabis Dependence: Its Nature, Consequences and Treatment, Roger A. Roffman and Robert S. Stephens, eds. (Cambridge, Cambridge University Press, 2006), pp. 58-105. [Back]
66. Wayne Hall and Rosalie L. Pacula, Cannabis Use and Dependence: Public Health and Public Policy (Cambridge, Cambridge University Press, 2003). [Back]
67. EMCDDA, Prevalence of Daily Cannabis Use in the European Union and Norway (Luxembourg: Publications Office of the European Union, 2012). [Back]
68. In the context of this section of the present report, cannabis treatment refers to the situation where cannabis was the primary drug of concern. People in treatment when other drugs were the primary drug of concern might be treated for their cannabis use at the same time. Therefore, the total number of people receiving who use cannabis is actually far greater than the number presented here, especially since the use of cannabis is frequent among users of other drugs. [Back]
69. Prevalence of Daily Cannabis Use (see footnote 67). [Back]
70. United States, Department of Health and Human Services, Substance Abuse and Mental Health Services Administration (SAMHSA), Center for Behavioral Health Statistics and Quality, Treatment Episode Data Set: Admissions (TEDS-A) Concatenated, 1992 to 2012, ICPSR 25221 (Ann Arbor, Michigan, Inter-univer-sity Consortium for Political and Social Research, 2015). [Back]
71. EMCDDA, Statistical Bulletin, various years. [Back]
72. For more details, see World Drug Report 2015 ((United Nations publication, Sales No. E.15.XI.6), pp. 62-64). [Back]
73. James R. Burgdorf, Beau Kilmer and Rosalie L. Pacula, "Heteroge-neity in the composition of marijuana seized in California", Drug and Alcohol Dependence, vol. 117, No. 1 (2011), pp. 59-61. [Back]
74. Tom P. Freeman and others, "Just say 'know': how do cannabinoid concentrations influence users' estimates of cannabis potency and the amount they roll in joints?", Addiction, vol. 109, No. 10 (2014), pp. 1686-1694. [Back]
75. Peggy van der Pol and others, "Cross-sectional and prospective relation of cannabis potency, dosing and smoking behaviour with cannabis dependence: an ecological study", Addiction, vol. 109, No. 7 (2014), pp. 1101-1109. [Back]
76. Treatment Episode Data Set: Admissions (TEDS-A) - Concatenated, 1992 to 2012 (see footnote 70). [Back]
77. Median of 21 per cent from 26 reporting countries using data for 2013 or the most recent year available. [Back]
78. EMCDDA, Data and statistics, Statistical Bulletin 2015, table TDI-0291. Available at www.emcdda.europa.eu/. [Back]
79. Peter Gates and others, "Barriers and facilitators to cannabis treatment", Drug and Alcohol Review, vol. 31, No. 3 (2012), pp. 311-319. [Back]
80. Richard A. Miech and others, Monitoring the Future National Survey Results on Drug Use: 1975-2014, vol. 1, Secondary school students (Ann Arbor, Michigan, University of Michigan Institute for Social Research, 2015), chap. 2. [Back]
81. Bjorn Hibell and others, The 2011 ESPAD Report: Substance Use among Students in 36 European Countries; The 2007 ESPAD Report: Substance Use Among Students in 35 European Countries; and The 2003 ESPAD Report: Alcohol and other Drug Use among Students in 35 European Countries (Stockholm, Swedish Council for Informa-tion on Alcohol and Other Drugs, 2012, 2009 and 2004). [Back]
82. Prevalence of Daily Cannabis Use (see footnote 67). [Back]
83. Hall and Pacula, "Cannabis use and dependence" (see footnote 66). [Back]
84. Prevalence of Daily Cannabis Use (see footnote 67). [Back]
86. Sharon R. Sznitman, "Cannabis treatment in Europe: a survey of services", in A Cannabis Reader: Global Issues and Local Experiences — Perspectives on Cannabis Controversies, Treatment and Regulation in Europe, vol. 2, S. R. Sznitman, B. Olsson and R. Room, eds., EMCDDA Monograph Series No. 8, (EMCDDA, Lisbon, 2008). [Back]
87. J. Schettino and others, Treatment of Cannabis-related Disorders in Europe, EMCDDA Insights Series (Lisbon, EMCDDA, 2015). [Back]
88. Eva Hoch and others, "CANDIS treatment program for cannabis use disorders: findings from a randomized multi-site translational trial", Drug and Alcohol Dependence, vol. 134 (2014), pp. 185-193. [Back]
89. Treatment of Cannabis-related Disorders in Europe (see footnote 87). [Back]
90. See World Drug Report 2015. [Back]
91. Michelle L. van Etten and James C. Anthony, "Male-female differences in transitions from first drug opportunity to first use: searching for subgroup variation by age, race, region, and urban status", Journal of Women's Health and Gender-based Medicine, vol. 10, No. 8 (2001). [Back]
92. Michelle L. van Etten, Yehuda D. Neumark and James C. Anthony, "Male-female differences in the earliest stages of drug involvement", Addiction, vol. 94, No. 9 (1999), pp. 1413-1419. [Back]
93. Jessica H. Cotto and others, "Gender effects on drug use, abuse, and dependence: a special analysis of results from the National Survey on Drug Use and Health", Gender Medicine, vol. 7, No. 5 (2010), pp. 402-413. [Back]
94. The 2011 ESPAD Report; and the unweighted average of the prevalence of past-year drug use for European Union member States reported by EMCDDA. [Back]
95. Christopher M. Jones and others, "Vital signs: demographic and substance use trends among heroin users — United States, 2002-2013, Morbidity and Mortality Weekly Report, vol. 64, No. 26 (2015), pp. 719-725. [Back]
96. United Kingdom, Home Office, Drug Misuse: Findings for the 2013/14 Crime Survey for England and Wales (July 2014). [Back]
97. Mathers M. Bradley and others, "Mortality among people who inject drugs: a systematic review and meta-analysis", Bulletin of the World Health Organization, vol. 91, No. 2 (2013), pp. 102-123. [Back]
98. Joint United Nations Programme on HIV/AIDS (UNAIDS), The GAP Report 2014 (Geneva, 2014). [Back]
100. Isabel Tavitian-Exley and others, "Influence of different drugs on HIV risk in people who inject: systematic review and meta-analysis", Addiction, vol. 110, No. 4, pp. 572-584. [Back]
102. Lydia N. Drumright and others, "Unprotected anal intercourse and substance use among men who have sex with men with recent HIV infection", Journal of Acquired Immune Deficiency Syndromes, vol. 43, No. 3 (2006), pp. 344-350. [Back]
103. Nga Thi Thu Vu, Lisa Maher, and Iryna Zablotska, "Amphetamine-type stimulants and HIV infection among men who have sex with men: implications on HIV research and prevention from a systematic review and meta-analysis", Journal of the International AIDS Society, vol. 18, No. 1 (2015). [Back]
104. Francisco I. Bastos and Neilane Bertoni, Pesquisa Nacional sobre o uso de crack: quem são os usuários de crack e/ou similares do Brasil? Quantos são nas capitais brasileiras? (Rio de Janeiro, ICICT/ FIOCRUZ, 2014). [Back]
105. Tavitian-Exley and others, "Influence of different drugs on HIV risk in people who inject" (see footnote 100). [Back]
106. John S. Atkinson and others, "Multiple sexual partnerships in a sample of African-American crack smokers", AIDS and Behavior, vol. 14, No. 1 (2010), pp. 48-58; and J. A. Inciardi and others, "The effect of serostatus on HIV risk behaviour change among women sex workers in Miami, Florida", AIDS Care: Psychological and Socio-Medical Aspects of AIDS/HIV, vol. 17, Suppl. No. 1 (2005), pp. S88-S101. [Back]
107. Marie C. Van Hout and Tim Bingham, "A costly turn on": patterns of use and perceived consequences of mephedrone based head shop products amongst Irish injectors", International Journal of Drug Policy, vol. 23, No. 3 (2012), pp. 188-197. [Back]
108. United Kingdom, Public Health England, Health Protection Scot-land, Public Health Wales, and Public Health Agency Northern Ireland, "Shooting up: infections among people who inject drugs in the United Kingdom" (London, November 2015). [Back]
109. Louisa Degenhardt and others, "Meth/amphetamine use and associated HIV: implications for global policy and public health", International Journal of Drug Policy, vol. 21, No. 5 (2010), pp. 347-358. [Back]
110. Tavitian-Exley and others, "Influence of different drugs on HIV risk in people who inject" (see footnote 100). [Back]
111. For the purpose of the present report, harm reduction is understood to refer to the set of the measures defined by WHO, UNODC and UNAIDS to prevent HIV and other blood-borne infections among people who inject drugs (also referred to in the Commission for Narcotic Drugs resolution 56/6) for the provision of comprehensive HIV prevention, treatment and care services among people who inject drugs'. See also the discussion in WHO "Community management of opioid overdose" 2014. [Back]
112. EMCDDA, "HIV outbreak among injecting drug users in Greece" (Lisbon, November 2012). [Back]
113. Andrei Botescu and others, "HIV/AIDS among injecting drug users 117 in Romania: report of a recent outbreak and initial response policies" (Lisbon, EMCDDA, 2012). [Back]
114. The definition of drug-related deaths varies between Member States 118 but includes some or all of the following: fatal drug overdoses; deaths due to HIV acquired through injecting drug use; suicide; and unintentional deaths and trauma due to drug use. [Back]
115. Louisa Degenhardt and others, "Illicit drug use", in Comparative Quantification of Health Risks: Global and Regional Burden of Disease Attributable to Selected Major Risk Factors, vol. 1, M. Ezzati and others, eds. (Geneva, WHO, 2004). [Back]
116. EMCDDA, Mortality related to Drug Use in Europe: Public Health Implications (Luxembourg, Publications Office of the European Union, 2011). [Back]
117. Rose A. Rudd and others, "Increases in drug and opioid overdose deaths: United States, 2000-2014", Morbidity and Mortality Weekly Report, vol. 64, No. 50 (2016), pp. 1378-1382. [Back]
118. EMCDDA, "Fentanyl drug profile". Available at www.emcdda.europa.eu/publications/drug-profiles/fentanyl. [Back]
119. EMCDDA, European Drug Report 2014: Trends and Developments (Luxembourg, Publications Office of the European Union, 2014). [Back]
120. Jane Mounteney and others, "Fentanyls: are we missing the signs? Highly potent and on the rise in Europe", International Journal on Drug Policy, vol. 26, No. 7 (2015), pp. 626-631. [Back]
121. Canadian Centre on Substance Abuse, "Canadian Community Epidemiology Network on Drug Use (CCENDU) Bulletin: deaths involving fentanyl in Canada, 2009-2014" (August 2015). [Back]
122. 2015 National Drug Threat Assessment Summary. [Back]
123. WHO, Multi-city study on drug injecting and risk of HIV infection: a report prepared on behalf of the WHO International Collaborative Group (WHO/PSA/94.4); Chris Beyrer and others, "Drug use, increasing incarceration rates, and prison-associated HIV risks in Thailand", AIDS and Behavior, vol. 7, No. 2 (2003), pp. 153-161; and Sheila M. Gore and others, "Drug injection and HIV prevalence in inmates of Glenochil prison", British Medical Journal, vol. 310, No. 6975 (1995), pp. 293-296. [Back]
124. Rhidian Hughes and Meg Huby, "Life in prison: perspectives of drug injectors", Deviant Behavior, vol. 21, No. 5 (2000), pp. 451-479; and S. Chu and K. Peddle, Under the Skin: A People's Case for Prison Needle and Syringe Programs (Toronto, Canadian HIV/AIDS Legal Network, 2010). [Back]
125. Anne Marie DiCenso, Giselle Dias and Jacqueline Gahagan, Unlocking Our Futures: A National Study on Women, Prisons HIV, and Hepatitis C (Toronto, Prisoners'HIV/AIDS Support Action Network (PASAN), 2003); Ruth E. Martin and others, "Drug use and risk of bloodborne infections: a survey of female prisoners in British Columbia", Canadian Journal of Public Health, vol. 96, No. 2 (2005), pp. 97-101; and Kate Dolan and others, "People who inject drugs in prison: HIV prevalence, transmission and prevention", International Journal of Drug Policy, vol. 26, Suppl. No. 1 (2015), pp. S12-S15; Chloé Carpentier and others, "Ten Years of Monitoring Illicit Drug Use in Prison Populations in Europe: Issues and Challenges", The Howard Journal of Criminal Justice, 51: 37-66. doi: 10.1111/j.1468-2311.2011.00677.x (2012). [Back]
126. The Gap Report, 2014 (see footnote 98). [Back]
127. Iacopo Baussano and others, "Tuberculosis incidence in prisons: a systematic review", PLoSMedicine, vol. 7, No. 12 (2010). [Back]
128. Sarah Larney and others, "Incidence and prevalence of hepatitis C in prisons and other closed settings: results of a systematic review and meta-analysis", Hepatology, vol. 58, No. 4 (2013), pp. 1215-1224. [Back]
129. UNODC/ILO/UNDP/WHO/UNAIDS policy brief entitled "HIV prevention, treatment and care in prisons and other closed settings: a comprehensive package of interventions" (2013). [Back]
130. UNAIDS, UNAIDS 2016-2021 Strategy: On the Fast-Track to End AIDS (2015). [Back]
131. Thomas Kerr and others, "Harm reduction in prisons: a 'rights based analysis'", Critical Public Health, vol. 14, No. 4 (2004), pp. 4-16. [Back]
132. Harm Reduction International, The Global State of Harm Reduction 2014, Katie Stone, ed. (London, 2014). [Back]
133. WHO, Preventing Overdose Deaths in the Criminal Justice System (Copenhagen, 2014). [Back]
134. Elizabeth L. C. Merrall and others, "Meta-analysis of drug-related deaths soon after release from prison", Addiction, vol. 105, No. 9 (2010), pp. 1545-1554. [Back]
135. Preventing Overdose Deaths (see footnote 133). [Back]
136. Based on reports from countries on the cultivation, eradication and seizure of cannabis, opium poppy and coca plants, the main source of the seizures being domestic drug production. [Back]
137. World Drug Report 2009 (United Nations publication Sales No. E.09.XI.12). [Back]
138. United Nations International Drug Control Programme, Research Section, "Cannabis as an illicit narcotic crop: a review of the global situation of cannabis consumption, trafficking and production", Bulletin on Narcotics, vol. XLIX, Nos. 1 and 2 (1997), and vol. L, Nos. 1 and 2 (1998) (United Nations publication), pp. 45-83. [Back]
139. Based on the findings of an international conference on joint investigations to combat drug trafficking via the virtual market ("dark net") in the European Union, Bad Erlach, Austria, 10-12 November 2015. [Back]
140. Global Drug Survey 2015 findings (www.globaldrugsurvey.com). [Back]
142. International conference on joint investigations to combat drug trafficking via the virtual market ("dark net") in the European Union, Bad Erlach, Austria, 10-12 November 2015. [Back]
143. Global Drug Survey 2015 (see footnote 140). [Back]
144. Data for 2015 are preliminary, as information from a number of smaller opium-producing countries is still missing. For the purposes of the present report, it is assumed that global opium poppy cultivation and opium production remained unchanged from 2014 to 2015. [Back]
145. EMCDDA and Europol, EU Drug Markets Report, In-depth Analysis, Lisbon and The Hague 2016, pp. 73-94. [Back]
146. Office for National Statistics, Statistical Bulletin: Deaths Related to Drug Poisoning in England and Wales: 2014 registrations, 3 September 2015. [Back]
147. National Records of Scotland, Drug-related deaths in Scotland in 2014, revised 15 March 2016. [Back]
148. UNODC, Drug Money: the illicit proceeds of opiates trafficked on the Balkan route (Vienna, 2015), p. 72. [Back]
149. UNODC, Afghan Opiate Trafficking through the Southern Route (Vienna, June 2015). [Back]
150. China, National Narcotics Control Commission, Annual Report on Drug Control in China 2011 and previous years; UNODC, Transnational Organized Crime in East Asia and the Pacific: A Threat Assessment (2013); and Afghan Opiate Trafficking. [Back]
151. Australian Crime Commission, Annual Report 2013-2014 (Canberra, 2014). [Back]
152. 2015 National Drug Threat Assessment Summary, U.S. Department of Justice. Drug Enforcement Administration. [Back]
153. See the online methodology section of the present report. [Back]
154. Doris Buddenberg and William A. Byrd, eds., Afghanistan's Drug Industry: Structure, Functioning, Dynamics, and Implications for Counter-Narcotics Policy (UNODC and World Bank, 2006); William A. Byrd, "Responding to Afghanistan's opium economy challenge: lessons and policy implications from a development perspective", Policy Research Working Paper No. 4545 (Washington, D.C, World Bank, March 2008). [Back]
155. The Opium Economy in Afghanistan: An International Problem (United Nations publication, Sales No. E.03.X.6); William A. Byrd and Christopher Ward, Drugs and Development in Afghanistan, World Bank Social Development Papers, Paper No. 18, December 2004; Afghanistan's Drug Industry; "Responding to Afghanistan's opium economy challenge"; UNODC and Ministry of Counter Narcotics of Afghanistan, Afghanistan: Opium Winter Rapid Assessment Survey (February, 2008); World Drug Report 2010 (United Nations publication, Sales No. E.10.XI.13); Addiction, Crime and Insurgency: The Transnational Threat of Afghan Opium (United Nations publication, Sales No. E.09.IV. 15); The Global Afghan Opium Trade: A Threat Assessment (United Nations publication, Sales No. E. 11.XI. 11); and World Drug Report 2014. [Back]
156. Afghanistan's Drug Industry, pp. 86-87 (see previous footnote). [Back]
157. The same patterns are found when the comparisons are based on an average of several years. The average annual area under coca bush cultivation fell by 12 per cent when comparing the periods 1990-1997 and 1998-2008 and by 19 per cent when comparing the peri-ods 1998-2008 and 2009-2014. [Back]
158. UNODC and Government of Colombia, Colombia: Coca Cultivation Survey 2014 (Bogotá, July 2015), p 13. [Back]
159. World Drug Report 2015, chapter II. [Back]
160. See also chapter II on violence. [Back]
161. 2015 National Drug Threat Assessment Summary (see footnote 30). [Back]
164. For the data used in the analysis and details of the calculations, see the online methodology section of the present report. [Back]
165. The UNODC Regional Office for West and Central Africa reported the following in February 2016: in two operations close to Cabo Verde in 2015, the Spanish authorities seized some 3 tons of cocaine; in March 2015, the Bolivian authorities arrested two West Africans and seized 5.9 tons of cocaine en route to countries in West Africa (mainly Ghana and Burkina Faso); at the beginning of 2016, more than 1.4 tons of cocaine were seized in Mauritania; in January 2016, the Bolivian authorities reported the seizure of 8 tons of cocaine (concealed among 80 tons of barium sulphate), destined for West Africa (Côte d'Ivoire), that had been shipped via Argentina and Uruguay; and in 2015 shipments of less than a ton of cocaine - mostly departing from Brazil and organized by Nigerian criminal groups — were seized in Benin (almost 0.3 ton), the Gambia (0.2 ton) and Guinea (81 kg). [Back]
166. Such levels are similar to the findings of previous UNODC research. A study on the value of the illicit drug market, based on data from the period 2002-2003, arrived at an average per capita consumption level of 37 grams of pure cocaine per user at the global level (World Drug Report 2005, Volume 1: Analysis (United Nations publication, Sales No. E.05.XI.10), table 3, p. 131). UNODC has suggested a decline of per capita consumption levels to 30 grams per user at the global level (World Drug Report 2010 (United Nations publication, Sales No. E.10.XI.13), table 8, p. 71). [Back]
167. World Drug Report 2005, table 3, p. 131. [Back]
168. Beau Kilmer and others, What America's Users Spend on Illegal Drugs: 2000-2010, Research Reports Series, document No. RR-534-ONDCP (Santa Monica, California, Rand Corporation, 2014), p. 5. [Back]
169. United States, SAMHSA, Center for Behavioral Health Statistics and Quality, Results from the 2014 National Survey on Drug Use and Health: Detailed Tables (Rockville, Maryland, 2015), table 7.2A. [Back]
170. United States, Executive Office of the President, The National Drug Control Strategy: 1996 (Washington, D.C., Office of National Drug Control Policy, 1996), p. 25, and previous years. [Back]
171. What America's Users Spend on Illegal Drugs (see footnote 168). [Back]
173. For a discussion, see World Drug Report 2015, box entitled "Interpreting drug seizures", p. 37. [Back]
174. The Eurobarometer survey also shows a slight increase in the use of cannabis between 2011 and 2014 among young people in the European Union (past-month use increased from 6.2 to 7.0 per cent over that period (Gallup Organization, Youth Attitudes on Drugs: Analytical Report, Flash Eurobarometer series No. 330 (European Commission, July 2011); and European Commission, Young People and Drugs, Flash Eurobarometer series No. 401 (August 2014)). [Back]
175. Rosalie L. Pacula and others, "Assessing the effects of medical marijuana laws on marijuana use: the devil is in the details", Journal of Policy Analysis and Management, vol. 34, No. 1 (2015), pp. 7-31. [Back]
177. Bryce Pardo, "Cannabis policy reforms in the Americas: a comparative analysis of Colorado, Washington, and Uruguay", International Journal of Drug Policy, vol. 25, No. 4 (2014), pp. 727-735. [Back]
178. Becky Bohrer, "Alaska regulators are 1st to OK marijuana use at pot shops", Big Story (Juneau, Alaska), 20 November 2015. [Back]
179. Pardo, "Cannabis policy reforms in the Americas" (see footnote 177). [Back]
180. Maria F. Boidi and others, "Marijuana legalization in Uruguay and beyond" (Miami, United States, Florida International University, Latin American and Caribbean Centre, Latin American Marijuana Research Initiative, 2015). [Back]
181. John Walsh and Geoff Ramsey, "Uruguay's drug policy: major innovations, major challenges" (Washington, D.C., Brookings Institute, 2015). [Back]
182. Uruguay, Junta Nacional de Drogas, "Regulacion controlada del mercado de marihuana: una alternativa al control penal y a la criminalizacion de los usuarios". Available at www.infodrogas.gub.uy. [Back]
183. Maria F. Boidi, Rosario Queirolo and Jose M. Cruz, "Marijuana consumption patterns among frequent consumers in Montevideo", paper presented at the ninth Conference of the International Society for the Study of Drug Policy, Ghent, Belgium, 19-22 May 2015. [Back]
184. Daniela Kreher, "Uruguay: a dos años de la aprobación de la ley que regula el cannabis" (Montevideo, IEPES, 2016). Available at esiglesia.org/. [Back]
185. Clinton W. Saloga, "The effect of legalized retail marijuana on the demand for medical marijuana in Colorado", paper prepared for the ninth Conference of the International Society for the Study of Drug Policy, Ghent, Belgium, 19-22 May 2015. [Back]
186. Eric L. Sevigny, Rosalie L. Pacula and Paul Heaton, "The effects of medical marijuana laws on potency", International Journal of Drug Policy, vol. 25, No. 2 (2014), pp. 308-319. [Back]
187. Zlatko Mehmedic and others, "Potency trends of Δ9-THC and other cannabinoids in confiscated cannabis preparations from 1993 to 2008", Journal of Forensic Sciences, vol. 55, No. 5 (2010), pp. 1209-1217. [Back]
188. Inés Acosta and Emilio Godoy, Marihuana, de las sombras a los laboratorios", Inter Press Service, 24 September 2013. [Back]
189. Adam Orens and others, "Marijuana equivalency in portion and dosage: an assessment of physical and pharmacokinetic relationships in marijuana production and consumption in Colorado" (Boulder, Colorado, Marijuana Policy Group, University of Colorado Boulder, Leeds School of Business, 2015). [Back]
190. Mark A. R. Kleiman, "Legal commercial cannabis sales in Colorado and Washington: what can we learn?" (Washington, D.C., Brookings Institute, 2015). [Back]
191. United States, Oregon, Office of the Secretary of State, Oregon Administrative Rules (Salem, Oregon Health Authority, Public Health Division, 2015), chap. 333, division 7. [Back]
192. United States, Government Accountability Office, State Marijuana Legalization: DOJ Should Document Its Approach to Monitoring the Effects of Legalization, GAO report GAO-16-1 (Washington, D.C., December 2015). [Back]
193. Oregon Liquor Control Commission, Recreational marijuana, Packaging and labeling pre-approval. Available at www.oregon.gov/olcc/.www.oregon.gov/olcc/marijuana/Pages/PackagingLabelingPre-Approval.aspx. [Back]
194. Robert J. MacCoun and Michelle M. Mello, "Half-baked: the retail promotion of marijuana edibles", New England Journal of Medicine, vol. 372, No. 11 (2015), pp. 989-991. [Back]
195. United States, Rocky Mountain High Intensity Drug Trafficking Area, Legalization of Marijuana in Colorado: The Impact, vol. 3 (September 2015). [Back]
197. Richard P. Compton and Amy Berning, "Drug and alcohol crash risk", report No. DOT HS 812117 (Washington, D.C., United States Department of Transportation, National Highway Traffic Safety Administration, Office of Behavioral Safety Research, February 2015). [Back]
198. Rebecca L. Hartman and others, "Cannabis effects on driving lateral control with and without alcohol", Drug and Alcohol Dependence, vol. 154 (2015), pp. 25-37. [Back]
199. Johannes G. Ramaekers, Hindrik W. J. Robbe and James F. O'Hanlon, "Marijuana, alcohol and actual driving performance", Human Psychopharmacology: Clinical and Experimental, vol. 15, No. 7 (2000), pp. 551-558. [Back]
200. Mark A. R. Kleiman and others, "Estimating the size of the medical cannabis market in Washington State" (Los Angeles, California, BOTEC Analysis Corporation, 2015). [Back]
201. Jonathan P. Caulkins, "Estimated cost of production for legalized cannabis",Working Paper No. WR-764-RC (Santa Monica, California, RAND Corportation, 2010). [Back]
202. B. Smith, Washington State Liquor and Cannabis Board, "Data on LCB prices", e-mail correspondence, 2016. [Back]
203. Jessica Rabe, "Marijuana store survey and industry outlook Q4 2015",18 December 2015. Available at www.convergex.com/. [Back]
204. "Cannabis llega a farmacias en 8 meses; tres porros, US$ 1,20", El País (Montevideo), 2 October 2015. Available at http://www.elpais.com.uy/informacion/cannabis-llega-farmacias-meses-tres.html. [Back]
205. United States, Colorado Department of Revenue, 2014 Annual Report, (2015). [Back]
206. Larson Silbuagh, "Distribution of marijuana tax revenue", Issue Brief No. 15-10 (Denver, Colorado Legislative Council Staff, 2015). [Back]
207. Washington State Liquor and Cannabis Board, "Weekly marijuana report", 6 April 2016. Available at www.lcb.wa.gov/. [Back]
208. Washington State Department of Revenue, Research and Fiscal Analysis Division, "Tax statistics 2015", December 2015. Available at www.dor.wa.gov/. [Back]
209. Jonathan P. Caulkins and others, Considering Marijuana Legalization: Insights for Vermont and other Jurisdictions (Santa Monica, California, RAND Corporation, 2015), p. 150. [Back]
210. Uruguay, Junta Nacional de Drogas, Observatorio Uruguayo de Drogas, "Indicadores de control de la oferta" (May 2012). [Back]
211. Caulkins and others, Considering Marijuana Legalization, p. 4 (see footnote 209). [Back]
212. "Preocupa a la región el proyecto de legalización de la marihuana", El País (Montevideo), 9 December 2013. [Back]
213. Legalization of Marijuana in Colorado (see footnote 195). [Back]
214. "Policía: a pesar de regular, no varía comercio clandestino de marihuana", El País (Montevideo), 28 January 2016. [Back]
215. UNODC, The Challenge of Synthetic Drugs in East and South-East Asia: Trends and Patterns of Amphetamine-type Stimulants and New Psychoactive Substances (Vienna, 2015). [Back]
216. According to responses to the annual report questionnaire sent by the Philippines for 2014 and expert perceptions of the use of main drugs of concern reflected in the Drug Abuse Information Network for Asia and the Pacific. [Back]
217. Australia, Department of the Prime Minister and Cabinet, Final Report of the National Ice Taskforce 2015 (Canberra, 2015). [Back]
218. UNODC, Global SMART Update 2014, vol. 12 (September 2014). [Back]
219. Captagon was originally the trade name for a pharmaceutical preparation containing fenetylline, a synthetic stimulant. In the past few years, most tablets seized as "Captagon" essentially contained amphetamine, typically in combination with caffeine and sometimes with other adulterants (World Drug Report 2010, p. 114). [Back]
220. UNODC early warning advisory on new psychoactive substances. "February 2015 — United Kingdom: high dose PMMA sold as "ecstasy" possibly still available" Available at www.unodc.org/. [Back]
221. Terminology and Information on Drugs (United Nations publication, Sales No. E.16.XI.8). [Back]
222. EMCDDA, European Drug Report: Trends and Developments 2015 (Luxembourg, Publications Office of the European Union, 2015). [Back]
224. Multiple responses were possible (Natasha Sindicich and Lucy Burns, An Overview of the 2014 Ecstasy and Related Drugs Reporting System (Sydney, University of New South Wales, National Drug and Alcohol Research Centre, October 2015)). [Back]
225. "Ketamine (INN): update review report", presented to the WHO Expert Committee on Drug Dependence at its thirty-seventh meeting, Geneva, 16-20 November 2015. [Back]
226. Stephen E. Lankenau and Michael C. Clatts, "Ketamine injection among high risk youth: preliminary findings from New York", Journal of Drug Issues, vol. 32, No. 3 (2000), pp. 893-905; and Stephen E. Lankenau and others, "The first injection event: differences among heroin, methamphetamine, cocaine, and ketamine initiates", Journal of Drug Issues, vol. 40, No. 2 (2010), pp. 241-261. [Back]
227. JWH-018, mephedrone and methylone have been under international control since 2015. [Back]
228. Seizures of synthetic NPS refer to synthetic NPS and do not include seizures of plant-based substances and ketamine. [Back]
229. Seizures are usually associated with control measures; therefore, an increase in seizures of NPS may reflect the fact that a larger number of substances were placed under national control. [Back]
230. AM-2201 has been placed under international control since 2015. [Back]
231. UNODC survey on new psychoactive substances, 2014. [Back]
233. For more information, see UNODC, The Challenge of New Psychoactive Substances (Vienna, March 2013). [Back]
234. The analysis covered the pharmacological effects of 621 synthetic NPS registered in the early warning advisory up to December 2015. Plant-based substances were excluded from the analysis, as they usually contain a large number of different substances, some of which may not even be known or may have effects and interactions that are not fully understood. The pharmacological effects of the remaining substances could not be determined with certainty on the basis of the available scientific data. [Back]
235. Some authors have reported an increase in NPS use among persons aged 12-34 years in the United States between 2009 and 2013 but also highlighted the risk of underreporting NPS use (see, for example, Joseph J. Palamar and others, "Self-reported use of novel psychoactive substances in a US nationally representative survey: prevalence, correlates, and a call for new survey methods to prevent underreporting", Drug and Alcohol Dependence, vol. 156, pp. 112-119). [Back]
236. Lloyd D. Johnston, and others, Monitoring the Future National Survey Results on Drug Use: 1975-2015 - Overview, Key Findings on Adolescent Drug Use (Ann Arbor, Institute for Social Research, Uni-versity of Michigan, 2016). [Back]
237. American Association of Poison Control Centers, "Synthetic cannabinoid data", updated 31 March 2016. [Back]
238. Deborah Lader, ed., Drug Misuse: Findings from the 2014/15 Crime Survey for England and Wales, 2nd ed., (London, Home Office, July 2015). [Back]
239. Public Health England, Adult Substance Misuse Statistics from the National Drug Treatment Monitoring System (NDTMS): 1 April 2014 to 31 March 2015 (London, 2015). [Back]
240. Deborah Lader, ed., Drug Misuse: Findings from the 2014/15 Crime Survey for England and Wales, 2nd ed., (London, Home Office, July 2015). [Back]
241. Chile, Ministerio del Interior y Seguridad Publica, "Décimo Primer Estudio Nacional de Drogas en Población General: Resultados Principales" (Santiago de Chile, Observatorio Chileno de Drogas, July 2014). [Back]
242. United Kingdom, Her Majesty's Inspectorate of Prisons, Changing Patterns of Substance Misuse in Adult Prisons and Service Responses (London, 2015). [Back]
243. United Kingdom, Her Majesty's Chief Inspector of Prisons for England and Wales: Annual Report 2013-14 (London, The Stationery Office, 2014). [Back]
244. United Kingdom, Her Majesty's Chief Inspector of Prisons for England and Wales: Annual Report 2014-15 (London, The Stationery Office, 2015). [Back]
245. United Kingdom, Prisons and Probation Ombudsman for England and Wales, "Learning lessons bulletin: fatal incidents investigations issue No. 9 - new psychoactive substances" (London, July 2015). [Back]
246. Chris Wilkins and others, New Zealand Arrestee Drug Use Monitoring 2010-2014 (Auckland, SHORE and Whariki Research Centre, Massey University, 2015). [Back]
247. MDPV has been under international control since 2015. [Back]
248. Jázsef Rácz, V. Anna Gyarmathy and Robert Csak, "New cases of HIV among people who injects drugs in Hungary: false alarm or early warning?", International Journal of Drug Policy, vol. 27, pp. 13-16. [Back]
249. Coralie Giese and others, "Injection of new psychoactive substance snow blow associated with recently acquired HIV infections among homeless people who inject drugs in Dublin, Ireland, 2015", Euro Surveillance, vol. 20, No. 40 (2015). [Back]
250. United Kingdom, Public Health England, Shooting Up Infections among People who Inject Drugs in the UK, 2014 (London, 2015). [Back]
251. Adam Bourne and others, The Chemsex Study: Drug Use in Sexual Settings Among Gay and Bisexual Men in Lambeth, Southwark and Lewisham (London, Sigma Research, London School of Hygiene and Tropical Medicine, 2014); Victoria L. Gilbart and others, "High-risk drug practices in men who have sex with men", The Lancet, vol. 381, No. 9875 (2013), pp. 1358-1359; and David Stuart, "Sexualised drug use by MSM: background, current status and response", HIV Nursing, vol. 13, No. 1 (2013), pp. 6-10. [Back]
Notes to chapter 2:
1. See General Assembly resolution 70/1. [Back]
2. The figure for all drugs, including the category "Other drug use disorders", was 18 million years of life lost. [Back]
3. Christopher J. L. Murray and others, "Global, regional, and national disability-adjusted life years (DALYs) for 306 diseases and injuries and healthy life expectancy (HALE) for 188 countries, 1990-2013: quantifying the epidemiological transition", The Lancet, vol. 386, No. 10009 (2015), pp. 2145-2191. [Back]
4. UNAIDS, "AIDS by the numbers" (Geneva, 2013). [Back]
5. UNAIDS, The Gap Report: People Who Inject Drugs (Geneva, 2014). [Back]
6. World Drug Report 2015 (United Nations publication, Sales No. E.15.XI.6), p. 6. [Back]
7. Pragna Patel and others, "Estimating per-act HIV transmission risk: a systematic review", AIDS, vol. 28, No. 10 (2014), pp. 1509-1519. [Back]
8. Rebecca F. Baggaley and others, "Risk of HIV-1 transmission for parenteral exposure and blood transfusion: a systematic review and meta-analysis", AIDS, vol. 20, No. 6 (2006). [Back]
9. Institute for Health Metrics and Evaluation, GBD Compare. Available at www.healthdata.org/. [Back]
10. Steffanie A. Strathdee and Susan G. Sherman, "The role of sexual transmission of HIV infection among injection and non-injection drug users", Journal of Urban Health, vol. 80, No. 4, Suppl. 3 (2003), pp. iii7-iii14. [Back]
11. Redefining AIDS in Asia: Crafting an Effective Response — Report of the Commission on AIDS in Asia (New Delhi, Oxford University Press, 2008). [Back]
12. F. Molitor and others, "Association of methamphetamine use during sex with risky sexual behaviors and HIV infection among non-in-jection drug users", Western Journal of Medicine, vol. 168, 1998, pp. 93-97. [Back]
13. World Drug Report 2015, p. 17. [Back]
14. Tasnim Azim, Irene Bontell and Steffanie A. Strathdee, "Women, drugs and HIV", International Journal of Drug Policy, vol. 26, Suppl. 1 (2015), pp. S16-S21. [Back]
16. UNODC Regional Office for South Asia, Women and Substance Use in India: Women, Substance Use and Vulnerability, Pratima Murthy, ed. (New Delhi, 2008). [Back]
17. UNODC, Impacts of Drug Use on Users and Their Families in Afghanistan (Vienna, 2014). [Back]
18. P. Murthy, Women and Drug Abuse: The Problem in India (India, Ministry of Social Justice and Empowerment and United Nations International Drug Control Programme, Regional Office for South Asia, 2002). [Back]
19. Tammy L. Anderson, "Drug use and gender", in Self-destructive Behavior and Disvalued Identity, vol. 4, Encyclopedia of Criminology and Deviant Behavior, Charles E. Faupel and Paul M. Roman, eds. (Philadelphia, Brunner-Routledge, 2001), pp. 285-289. [Back]
20. Nabila El-Bassel and others, "Relationship between drug abuse and intimate partner violence: a longitudinal study among women receiving methadone", American Journal of Public Health, vol. 95, No. 3 (2005), pp. 465-470. [Back]
21. Azim, Bontell and Strathdee, "Women, drugs and HIV" (see footnote 14). [Back]
22. Wording proposed by the Open Working Group on Sustainable Development Goals [Back]
23. Kenneth J. Gruber and Melissa F. Taylor, "A family perspective for substance abuse: implications from the literature", Journal of Social Work Practice in the Addictions, vol. 6, Nos. 1 and 2 (2006), pp.1-29. [Back]
24. Impacts of Drug Use on Users and Their families in Afghanistan. [Back]
25. Marina Barnard, Drug Addiction and Families (London, Jessica Kingsley Publishers, 2006). [Back]
26. Marija G. Dunn and others, "Origins and consequences of child neglect in substance abuse families", Clinical Psychology Review, vol. 22, No. 7 (2002), pp.1063-1090. [Back]
27. Diane M. Hogan, "The impact of opiate dependence on parenting processes: contextual, physiological and psychological factors", Addiction Research and Theory, vol. 15, No. 6 (2007), pp. 617-635. [Back]
28. Charlie Lloyd, "Risk factors for problem drug use: identifying vulnerable groups", Drugs: Education, Prevention and Policy, vol. 5, No. 3 (1998), pp. 217-232. [Back]
29. See World Drug Report 2015, chap. II. [Back]
30. UNODC Country Office for Afghanistan, "Community drug profile No.5: an assessment of problem drug use in Kabul city", (Kabul, 2003), p. 25. [Back]
31. INCB, "Availability of narcotic drugs for medical use". Available at www.incb.org. [Back]
32. https://www.drugabuse.gov/related-topics/trends-statistics/overdose-death-rates. [Back]
33. United States, DEA, 2015 National Drug Threat Assessment Summary (October 2015). [Back]
34. Neil P. McKeganey and others, "Preteen children and illegal drugs" Drugs: Education, Prevention and Policy, vol. 11, No. 4 (2004), pp. 315-327. [Back]
35. Chile, Servicio Nacional para la Prevención y Rehabilitación del Consumo de Drogas y Alcohol, Ministerio del Interior y Seguridad Pública, "Décimo estudio nacional de drogas en población escolar: principales resultados nacionales" (Santiago de Chile, Observatorio Chileno de Drogas, 2014). [Back]
36. Robert MacDonald and Jane Marsh, "Crossing the Rubicon: youth transitions, poverty, drugs and social exclusion", International Journal of Drug Policy, vol.13, No. 1 (2002), pp. 27-38. [Back]
37. Anne M. Gewin and Bobby Hoffman, "Introducing the cultural variables in school-based substance abuse prevention", Drugs: Education, Prevention and Policy, vol. 23, No. 1 (2016), pp. 1-14. [Back]
38. Impacts of Drug Use on Users and Their Families in Afghanistan (see footnote 17). [Back]
39. UNODC, "Drug use in Afghanistan: 2009 survey — executive summary" (2009). [Back]
40. Zachary Steel and others, "Association of torture and other potentially traumatic events with mental health outcomes among populations exposed to mass conflict and displacement: a systematic review and meta analysis", Journal of the American Medical Association, vol. 302, No. 5 (2009), pp. 537-549. [Back]
41. Nadine Ezard and others, "Six rapid assessments of alcohol and other substance use in populations displaced by conflict", Conflict and Health, vol. 5, No. 1 (2011). [Back]
42. Kamaldeep Bhui and Nasir Warfa, "Drug consumption in conflict zones in Somalia", PLoS Medicine, vol. 4, No. 12 (2007). [Back]
43. EMCDDA, Annual Report 2003: The State of the Drugs Problem in the European Union and Norway (Lisbon, 2003). [Back]
45. Margriet van Laar and others, Report to the EMCDDA by the Reitox National Focal Point: The Netherlands Drug Situation 2014 (Lisbon, 2015). [Back]
46. Claire Hickey, Crime and Homelessness 2002 (Dublin, Focus Ireland and PACE, 2002). [Back]
47. Annual Report 2003:The State of the Drugs Problem in the European Union and Norway. [Back]
48. Stephen Holland, "Homeless health data finds heroin and cocaine dependency more prevalent amongst women than men", 5 August 2015. Available at www.homeless.org.uk/. [Back]
49. A "regular user" was defined as a person who had used the substances on 25 days or more in the previous six months. [Back]
50. Brazil, National Drug Policy Secretariat, "Perfil dos usuários de crack e/ou similares no Brasil" (Rio de Janeiro, 2013). [Back]
51. James D. Livingston and others, "The effectiveness of interventions for reducing stigma related to substance use disorders: a systematic review", Addiction, vol. 107, No. 1 (2012), pp. 39-50. [Back]
52. Alejandro Badel and Brian Greaney, "Exploring the link between drug use and job status in the U.S.", Regional Economist, July 2013. Available at www.stlouisfed.org/publications/regional-economist/july-2013/exploring-the-link-between-drug-use-and-job-status-in-the-us. [Back]
53. These data refer to the 28 member States of the European Union, Norway and Turkey. [Back]
54. Fifty per cent corresponds to the proportion of entrants classified as "unemployed/discouraged", among the total of number of entrants with known employment status, excluding students. This total includes persons whose status was classified as "other" as well as "receiving social benefits/pensioners/house-makers/disabled". It is likely that these categories include people who are not in the labour force; if this were taken into account, the proportion of unem-ployed people would be higher. [Back]
55. Impacts of Drug Use on Users and Their Families in Afghanistan. [Back]
56. Peter A. Kemp and Joanne Neale, "Employability and problem drug users", Critical Social Policy, vol. 25, No. 1 (2015), pp. 28-46. [Back]
57. Harry Sumnall and Angelina Brotherhood, Social Reintegration and Employment: Evidence and Interventions for Drug Users in Treatment, EMCDDA Insights No. 13 (Luxembourg, Publications Office of the European Union, 2012). [Back]
58. J. Spencer and others, Getting Problem Drug Users (Back) into Employment (London, United Kingdom Drug Policy Commission, 2008). [Back]
59. Livingston and others, "The effectiveness of interventions for reduc-ing stigma related to substance use disorders". [Back]
60. T. M. Ronzani, J. Higgings-Biddle and E. F. Furtado, "Stigmatization of alcohol and other drug users by primary care providers in Southeast Brazil", Social Science and Medicine, vol. 69, No. 7 (2009), pp. 1080-1084. [Back]
61. Natalie Skinner and others, "Stigma and discrimination in health-care provision to drug users: the role of values, affect, and deservingness judgments", Journal of Applied Social Psychology, vol. 37, No. 1 (2007), pp. 163-186. [Back]
62. Shah E. Habib and Lester V. Adorjany, "Hepatitis C and injecting drug use: the realities of stigmatization and discrimination", Health Education Journal, vol. 62, No. 3 (2003), pp. 256-265. [Back]
63. The Gap Report (see footnote 5). [Back]
64. EMCDDA, Annual Report 2012: The State of the Drugs Problem in Europe (Lisbon, 2012). [Back]
65. "International standards for the treatment of drug use disorders: draft for field testing" (E/CN.7/2016/CRP.4). [Back]
66. See UNODC, International Standards On Drug Use Prevention (Vienna, March 2013). [Back]
67. David P. Wilson and others, "The cost-effectiveness of harm reduction", International Journal of Drug Policy, vol. 26, Suppl. No. 1 (2015), pp. S5-S11. [Back]
68. UNAIDS, Halving HIV transmission among people who inject drugs: Background note, document UNAIDS/PCB (35)/14.27. [Back]
69. WHO, Ensuring Balance in National Policies on Controlled Substances: Guidance for Availability and Accessibility of Controlled Medicines (Geneva, 2011). [Back]
70. Human Rights Watch, "National drug control strategies and access to controlled medicines" (2015). [Back]
71. A. Roberts, B. Mathers and L. Degenhardt, Women Who Inject Drugs: A Review of Their Risks, Experiences and Needs (Sydney, National Drug and Alcohol Research Centre, University of New South Wales, 2010). [Back]
72. In addition to the discussion of poverty in this section, see the discussion of social exclusion in the section entitled "Social development". [Back]
73. B. Kilmer and others, What America's Users Spend on Illegal Drugs: 2000-2010 (Santa Monica, California, Rand Corporation, 2014). [Back]
74. Jonathan P. Caulkins, "Is crack cheaper than (powder) cocaine?", Addiction, vol. 92, No. 11 (1997) , pp. 1437-1443. [Back]
75. Kilmer and others, What America's Users Spend on Illegal Drugs: 2000-2010. [Back]
76. Legleye and others, "Is there a cannabis epidemic model? Evidence from France, Germany and USA". International Journal of Drug Policy, vol. 25, No. 6 (2014), pp. 1103-1112. [Back]
77. A "regular user" was defined as a person who had used the substance on 25 days or more in the previous six months. [Back]
78. "Perfil dos usuarios de crack e/ou similares no Brasil" (see footnote 50). [Back]
79. World Drug Report 2012 (United Nations publication, Sales No. E.12.XI.1), p. 88. [Back]
80. R. Young, From War to Work: Drug Treatment, Social Inclusion and Enterprise (London, Foreign Policy Centre, 2002). [Back]
81. In addition to the discussion of poverty in this section, see the discussion of social exclusion in the section entitled "Social development". [Back]
82. United Nations International Drug Control Programme, World Drug Report 1997 (Oxford, Oxford University Press, 1997). [Back]
83. World Drug Report 2012, p. 67. [Back]
84. Claudia C. Storti and Paul De Grauwe, "Globalization and the price decline of illicit drugs", International Journal of Drug Policy, vol. 20, No. 1 (2009), pp. 48-61. [Back]
85. Horace A. Bartilow and K. Eom, "Free traders and drug smugglers: the effects of trade openness on States' ability to combat drug trafficking", Latin American Politics and Society, vol. 51, No. 2 (2009), pp. 117-145. [Back]
86. UNODC, Southeast Asia Opium Survey 2015: Lao People's Democratic Republic and Myanmar (Bangkok, 2015). [Back]
87. The income was $1,952 per household in non-poppy-growing villages compared with $1,548 per household in poppy-growing villages. [Back]
88. UNODC and Ministry of Counter-Narcotics of Afghanistan, Afghanistan Opium Survey 2014: Socio-economic Analysis (March 2015). [Back]
89. See World Drug Report 2015, pp. 92-97. [Back]
90. David Mansfield, Alcis Ltd and Organization for Sustainable Development and Research, Managing Concurrent and Repeated Risks: Explaining the Reductions in Opium Production in Central Helmand between 2008 and 2011 (Kabul, Afghanistan Research and Evaluation Unit, 2011). [Back]
91. David Mansfield, Examining the Impact of IDEA-NEW on Opium Production. Nangarhar — A Case Study (2015). [Back]
92. David Mansfield, "The devil is in the details: Nangarhar's continued decline into insurgency, violence and widespread drug production", Brief Series (Kabul, Afghanistan Research and Evaluation Unit, 2016). [Back]
93. World Drug Report 2011 (United Nations publication, Sales No. E.11.XI.10). [Back]
94. A discussion of the theories explaining price markup at different stages of the supply chain can be found in Jonathan P. Caulkins and Peter Reuter, "How drug enforcement affects drug prices", in Crime and Justice: A Review of Research, vol. 39, No. 1, Michael Tonry, ed. (Chicago, University of Chicago Press, 2010), pp. 213-272. [Back]
95. UNODC, Afghanistan Opium Survey 2014. [Back]
96. UNODC, Estimating Illicit Financial Flows Resultingfrom Drug Trafficking and other Transnational Organized Crimes (Vienna, 2011). [Back]
97. Doris Buddenberg and William A. Byrd, eds., Afghanistan's Drug Industry: Structure, Functioning, Dynamics and Implications for Counter-Narcotics Policy (UNODC and World Bank, 2006). [Back]
98. World Drug Report 2012, pp. 115-116. [Back]
99. In many cases the studies focus on drug use. [Back]
100. M. Fernandez, "The socioeconomic impact of drug-related crimes in Chile", International Journal of Drug Policy, vol. 23, No. 6 (2012), pp. 465-472. [Back]
101. For a discussion of the different links between drugs and crime, see the subsection on violence. [Back]
102. UNODC, Colombia: Monitoreo de Cultivos de Coca 2014 (Bogotá, 2015). [Back]
103. Based on data from M. C. Hansen and others, "High-resolution global maps of 21st-century forest cover change", Science, vol. 342, No. 6160 (November 2013), pp. 850-853. [Back]
104. UNODC, Análisis Multitemporal de Cultivos de Coca: Período 2001-2006 (Bogota, 2006). [Back]
105. UNODC, Análisis Multitemporal de Cultivos de Coca: Período 2001-2012 (Bogota, 2014). [Back]
106. Maria A. Chadid and others, "A Bayesian spatial model highlights distinct dynamics in deforestation from coca and pastures in an Andean biodiversity hotspot", Forests, vol. 6, No. 11 (2015). [Back]
107. UNODC and Ministerio del Medio Ambiente del Perú, "Analísis económico de las actividades causantes de la deforestación en Pichis-Palcazú" (Lima, 2011). [Back]
108. Iliana Monterroso and Deborah Barry, "Legitimacy of forest rights: the underpinnings of the forest tenure reform in the protected areas of Petén, Guatemala", Conservation and Society, vol. 10, No. 2 (2012), pp. 136-150. [Back]
109. Kendra McSweeney and others, "Drug policy as conservation policy: narco-deforestation", Science, vol. 343, No. 6170 (2014), pp. 489 and 490. [Back]
110. Avrum J. Shriar, "Theory and context in analyzing livelihoods, land use, and land cover: lessons from Petén, Guatemala", Geoforum, vol. 55, 2014, pp. 152-163. [Back]
111. Iliana Monterroso and Deborah Barry, Tenencia de la Tierra, Bosques y Medios de Vida en la Reserva de la Biosfera Maya en Guatemala: Sistema de Concesiones Forestales Comunitarias (Guatemala City, Centro Internacional de Investigaciones Forestales, Facultad Latino-americana de Ciencias Sociales, 2009). [Back]
113. Avrum J. Shriar, "Theory and context in analyzing livelihoods, land use, and land cover" (see footnote 110). [Back]
114. Liza Grandia, "Road mapping: megaprojects and land grabs in the northern Guatemalan lowlands", Development and Change, vol. 44, No. 2 (2013), pp. 233-259. [Back]
115. McSweeney and others, "Drug policy as conservation policy" (see footnote 109). [Back]
116. K. McSweeney and Z. Pearson, "Prying native people from native lands: narco business in Honduras", NACLA Report on the Americas, vol. 46, No. 4 (2013). [Back]
117. EMCDDA and Europol, Methamphetamine: A European Union Perspective in the Global Context (Luxembourg, Office for Official Publications of the European Communities, 2009). [Back]
118. Merrill Singer, "Drugs and development: the global impact of drug use and trafficking on social and economic development", International Journal of Drug Policy, vol. 19, No. 6 (2008), pp. 467-478. [Back]
119. Walter Ego and Aïssata Maïga, "Tallying the hidden environmental costs of drug production", policy brief No. 149 (Stockholm, Institute for Security and Development, 2014). [Back]
120. UNODC, Características Agroculturales de los Cultivos de Coca en Colombia (Bogotá, 2007). [Back]
122. Ray Henkel, "Coca (Erythroxylum coca) cultivation, cocaine production, and biodiversity in the Chapare region of Bolivia", in Biodiversity and Conservation of Neotropical Montane Forests, Steven P Churchill and others, eds. (New York, New York Botanical Garden, 1995), pp. 551-560. [Back]
123. John Weier, "From wetland to wasteland: the destruction of the Hamoun Oasis", NASA Earth Observatory, Available at www.earthobservatory.nasa.gov/Features/hamoun. [Back]
124. Adam Pain, "Water, management, livestock and the opium economy: the spread of opium poppy cultivation in Balkh", Case Study Series (Kabul, Afghanistan Research and Evaluation Unit, 2007). [Back]
125. David Mansfield and Adam Pain, "Opium poppy eradication: how to raise risk when there is nothing to lose?" Briefing Paper Series (Kabul, Afghanistan Research and Evaluation Unit, 2006). [Back]
126. David Mansfield, "Between a rock and a hard place: counter-narcotics efforts and their effects in Nangarhar and Helmand in the 2010-11 growing season", Case Study Series (Kabul, Afghanistan Research and Evaluation Unit, 2011). [Back]
127. Mansfield and Pain, "Opium poppy eradication" (see footnote 125). [Back]
128. Mansfield, "Between a rock and a hard place" (see footnote 126). [Back]
129. David Mansfield, "Helmand on the move: migration as a response to crop failure", Brief Series (Kabul, Afghanistan Research and Evaluation Unit, 2015). [Back]
130. Clinton N. Jenkins, Stuart L. Pimm and Lucas N. Joppa, "Global patterns of terrestrial vertebrate diversity and conservation", Proceedings of the National Academy of Sciences, vol. 110, No. 28 (2013). [Back]
131. Norman Myers and others, "Biodiversity hotspots for conservation priorities", Nature, vol. 403, No. 6772 (2000), pp. 853-858. [Back]
132. Thomas Brooks and others, "Global biodiversity conservation priorities", Science, vol. 313, No. 5783 (2006), pp. 58-61. [Back]
133. David M. Olson and others, "Terrestrial ecoregions of the world: a new map of life on Earth", BioScience, vol. 51, No. 11 (2001), pp. 933-938. [Back]
134. Natalia Ocampo-Peñuela and Stuart L. Pimm, "Elevational ranges of montane birds and deforestation in the western Andes of Colombia", PLoS ONE, vol. 10, No. 12 (2015). [Back]
135. Pasquale Borrelli and others, "The implications of fire management in the Andean Páramo: a preliminary assessment using satellite remote sensing", Remote Sensing, vol. 7, No. 9 (2015), pp. 11061-11082. [Back]
136. Myers and others, "Biodiversity hotspots for conservation priorities" (see footnote 131). [Back]
137. Henkel, "Coca (Erythroxylum coca) cultivation" (see footnote 122). [Back]
138. See World Drug Report 2015, chap. II. [Back]
139. UNODC, San Martín: Análisis Económico del Impacto del Desarrollo Alternativo, en relación a la Deforestación y la Actividad Cocalera (Lima, 2014). [Back]
140. UNODC, Colombia: Monitoreo de Cultivos de Coca 2013 (Bogotá, 2014). [Back]
141. Maria D. Álvarez, "Forests in the time of violence: conservation implications of the Colombian war", Journal of Sustainable Forestry, vol. 16, Nos. 3-4 (2003), pp. 47-68. [Back]
142. Chupinit Kesmanee, "The poisoning effect of a lovers triangle: highlanders, opium and extension crops, a policy overdue for review", in Hill Tribes Today: Problems in Change, John McKinnon and Bernard Vienne, eds. (Bangkok, White Lotus, 1989), pp. 61-102. [Back]
143. Mansfield, "Helmand on the move" (see footnote 129). [Back]
144. Chadid and others, "A Bayesian spatial model highlights distinct dynamics". [Back]
145. Alexander Rincón-Ruiz, Unai Pascual and Suzette Flantua, "Examining spatially varying relationships between coca crops and associated factors in Colombia, using geographically weight regression", Applied Geography, vol. 37 (2013), pp. 23-33. [Back]
146. Timothy J. Killeen and others, "Total historical land-use change in eastern Bolivia: who, where, when, and how much?", Ecology and Society, vol. 13, No. 1, art. 36 (2008). [Back]
147. Ana María Sánchez-Cuervo and others, "Land cover change in Colombia: surprising forest recovery trends between 2001 and 2010", PLOS ONE, vol. 7, No. 8 (2012). [Back]
148. Ricardo Vargas, "Fumigaciones y política de drogas en Colombia: �fin del círculo vicioso o un fracaso estratégico?", in Guerra, Sociedad y Medio Ambiente, Martha Cárdenas and Manuel Rodríguez, eds. (Bogotá, Foro Nacional Ambiental, 2004), pp. 353-395. [Back]
149. References to research undertaken on the environmental impact of spraying in Colombia can be found in the online methodology section of the present report. [Back]
150. A. Durán-Martínez, "To kill and tell? State power, criminal competition, and drug violence", Journal of Conflict Resolution, vol. 59, No. 8 (2015), pp. 1377-1402. [Back]
151. Paul J. Goldstein, "The drugs/violence nexus: a tripartite conceptual framework", Journal of Drug Issues, vol. 15, No. 4 (1985), pp. 493-506. [Back]
152. Paul J. Goldstein, "The relationship between drugs and violence in the United States", in United Nations International Drug Control Programme, World Drug Report 1997, part 3. [Back]
153. Bivariate correlations between homicide rates and each of these categories appear statistically significant in the categories "Country on the main Afghan opiate routes?", "Country on the main cocaine routes?", but not in the "Country with illicit crop cultivation?" category (possibly because only 17 countries are in the latter category). [Back]
154. T. Bennett and K. Holloway, Understanding Drugs, Alcohol and Crime, Crime and Justice Series (Maidenhead, Berkshire, United Kingdom, Open University Press, 2005), pp. 96 and 105. [Back]
155. Larry W. Bennett, "Substance abuse and the domestic assault of women", Social Work, vol. 40, No. 6 (1995), pp. 760-771. [Back]
156. Eduardo A. Gamarra, "Fighting drugs in Bolivia: United States and Bolivian perceptions at odds", in Coca, Cocaine and the Bolivian Reality, M. B. Leóns and H. Sanabria, eds. (Albany, State University of New York Press, 1997), pp. 243-252. [Back]
157. V. Felbab-Brown and H. Trinkunas, "UNGASS 2016 in comparative perspective: improving the prospects for success", Foreign Policy Paper (Washington, D. C., Brookings Institution, 2015). [Back]
158. Global Study on Homicide 2013, p. 43. [Back]
159. UNODC, Transnational Organized Crime in East Asia and the Pacific: A Threat Assessment (Bangkok, 2013). [Back]
160. Svante E. Cornell, "The interaction of narcotics and conflict", Journal of Peace Research, vol. 42, No. 6 (2005), pp. 751-760. [Back]
161. James A. Piazza, "The opium trade and patterns of terrorism in the provinces of Afghanistan: an empirical analysis", Terrorism and Political Violence, vol. 24, No. 2 (2012), pp. 213-234. [Back]
162. V. Asal, H. Brinton Milward and Eric W. Schoon, "When terrorists go bad: analyzing terrorist organizations' involvement in drug smuggling", International Studies Quarterly, vol. 59, No. 1 (2015), pp. 112-123. [Back]
163. This database included only organizations that were at the peak of their power; therefore the findings could be less applicable to organizations at other stages of development. [Back]
164. Vanda Felbab-Brown, Shooting Up: Counterinsurgency and the War on Drugs (Washington, D.C., Brookings Institution Press, 2009). [Back]
165. Mark Kleiman, "Surgical strikes in the drug wars: smarter policies for both sides of the border", Foreign Affairs, vol. 90, No. 5 (September/October 2011), pp. 89-101; and Lessing, "Logics of violence in criminal war". [Back]
166. Pien Metaal and Coletta Youngers, eds., Systems Overload: Drug Laws and Prisons in Latin America (Amsterdam, Transnational Institute, 2011). [Back]
167. Richard H. Friman, "Forging the vacancy chain: law enforcement efforts and mobility in criminal economies", Crime, Law and Social Change, vol. 41, No. 1 (2004), pp. 53-77. [Back]
168. Gabriela Calderón and others, "The beheading of criminal organizations and the dynamics of violence in Mexico", Journal of Conflict Resolution, vol. 59, No. 8 (2015), pp. 1455-1485, p. 1475. [Back]
169. UNODC Homicide Statistics (2016). [Back]
170. See McSweeney and others, "Drug policy as conservation policy"; and Friman, "Forging the vacancy chain". [Back]
171. José M. Cruz, "Criminal violence and democratization in Central America: the survival of the violent State", Latin American Politics and Society, vol. 53, No. 4 (2011), pp. 1-33. [Back]
172. Juan Carlos Garzón, "Tough on the weak, weak on the tough: drug laws and policing" (Washington, D. C., Woodrow Wilson International Center for Scholars, 2015). [Back]
173. UNDP, Addressing the Development Dimensions of Drug Policy (New York, 2015). [Back]
174. "Making drug control 'fit for purpose': building on the UNGASS decade", report by the Executive Director of the United Nations Office on Drugs and Crime as a contribution to the review of the twentieth special session of the General Assembly" (E/CN.7/2008/CRP.17). [Back]
175. Report by the Special Rapporteur on extrajudicial, summary or arbitrary executions, document A/HRC/14/24/Add.6. [Back]
176. Peter Reuter and Mark A. R. Kleiman, "Risks and prices: an economic analysis of drug enforcement", Crime and Justice: A Review of Research, vol. 7 (1986), pp. 289-340. [Back]
177. Caulkins and Reuter, "How drug enforcement affects drug prices" (see footnote 94). [Back]
178. Michael Grossman, "Individual behaviors and substance use: the role of price", in Substance Use: Individual Behavior, Social Interactions, Markets, and Politics, vol. 16, Bjorn Lindgren and Michael Grossman, eds., Advances in Health Economics and Health Services Research Series (Bingley, United Kingdom, Emerald Group Publishing Limited Amsterdam, 2005). [Back]
179. Jason M. Lindo and M. Padilla-Romo, "Kingpin approaches to fighting crime and community violence: evidence from Mexico's drug war", discussion paper No. 9067 (Bonn, Institute for the Study of Labor (IZA), May 2015). [Back]
180. Peter Reuter, "The mobility of drug trafficking", in Ending the Drug Wars: Report of the LSE Expert Group on the Economics of Drug Policy, John Collins, ed. (London School of Economics and Political Science, 2014). [Back]
181. Juan C. Garzón and John Bailey "Displacement effects of supply-reduction policies in Latin America: a tipping point in cocaine trafficking, 2006-2008", in The Handbook of Drugs and Society, Henry H. Brownstein, ed., Wiley Handbooks in Criminology and Criminal Justice Series (West Sussex, United Kingdom, John Wiley and Sons, 2016). [Back]
182. Barry D. Crane, A. Rex Rivolo and Gary C. Comfort, An Empirical Examination of Counterdrug Interdiction Program Effectiveness, IDA paper P-3219 (Alexandria, Virginia, Institute for Defense Analysis, 1997). [Back]
183. Durán-Martínez, "To kill and tell?" (see footnote 150). [Back]
184. UNODC, "From coercion to cohesion: treating drug dependence through health care, not punishment", discussion paper, 2010. [Back]
185. Ralf Jurgens and Glenn Betteridge, "Prisoners who inject drugs: public health and human rights imperatives", Health and Human Rights, vol. 8, No. 2 (2005), pp. 46-74. [Back]
186. "From coercion to cohesion" (see footnote 184). [Back]
187. World Drug Report 2015, p. 6. [Back]
188. See the report of the independent expert for the United Nations study on violence against children (A/61/299, para. 61); see also the thematic report by the Special Representative of the Secretary-General on Violence against Children (Promoting Restorative Justice for Children (New York, 2013), pp. 7 and 29). [Back]
189. Convention on the Rights of the Child, article 37; see also rules 1 and 2 of the United Nations Rules for the Protection of Juveniles Deprived of their Liberty (General Assembly resolution 45/113, annex). [Back]
190. Based on data for 145 countries. [Back]
191. Based on data from 74 countries, classifying convictions with multiple offences according to the most serious one. [Back]
192. Each of the above-mentioned estimates has been calculated on the basis of the corresponding available data set and presented on the assumption that the data set is representative of the global population. However, the exact coverage, and hence the level of uncertainty, differs according to the specific indicator. [Back]
193. Note by the Secretariat on world crime trends and emerging issues and responses in the field of crime prevention and criminal justice (E/CN.15/2016/10). [Back]
194. Joseph J. Amon and others, "Compulsory drug detention in East and Southeast Asia: evolving government, UN and donor responses", International Journal of Drug Policy, vol. 25, No. 1 (2014), pp. 13-20. [Back]
195. See article 3, paragraph 4, of the United Nations Convention against Illicit Traffic in Narcotic Drugs and Psychotropic Substances of 1988, article 36, paragraph 1(b), of the Single Convention on Narcotic Drugs of 1961 as amended by the 1972 Protocol and article 22, paragraph 1(b), of the Convention on Psychotropic Substances of 1971. [Back]
196. See article 36, paragraph 1 (a), of the 1961 Convention as amended by the 1972 Protocol, article 22, paragraph 1 (a), of the 1971 Convention and article 4 (a) of the 1988 Convention. [Back]
197. See article 38 of the 1961 Convention as amended by the 1972 Protocol and article 20 of the 1971 Convention. [Back]
198. See Commission on Narcotic Drugs resolution 55/12; see also UNODC, Introductory Handbook on the Prevention of Recidivism and the Social Reintegration of Offenders, Criminal Justice Handbook Series (Vienna, 2012), p. 43. [Back]
199. "From coercion to cohesion" (see footnote 184). [Back]
200. EMCDDA, Drug Policy Profiles: Portugal (Luxembourg, Publica-tions Office of the European Union, 2011). [Back]
201. Graham D. Willis, "Antagonistic authorities and the civil police in Sao Paulo, Brazil", Latin American Research Review, vol. 49, No. 1 (2014), pp. 3-22. [Back]
202. Letizia Paoli, "Italian organised crime: Mafia associations and criminal enterprises", Global Crime, vol. 6, No. 1 (2004), pp. 19-31. [Back]
203. United States of America, Government Accountability Office, Border Security: Additional Actions Needed to Strengthen CBP Efforts to Mitigate Risk of Employee Corruption and Misconduct, GAO-13-59 (Washington, D.C., 2012). [Back]
204. Benjamin Lessing, "Logics of violence in criminal war", Journal of Conflict Resolution, vol. 59, No. 8 (2015), pp.1486-1516. [Back]
205. R. Snyder and A. Durán-Martínez, "Drugs, Violence, and State-sponsored protection rackets in Mexico and Colombia", Colombia Internacional, No. 70 (July/December 2009), pp. 61-91. [Back]
206. Durán-Martínez, "To kill and tell?" (see footnote 150). [Back]
207. UNODC, Transnational Organized Crime in West Africa: A Threat Assessment (Vienna, 2013). [Back]
208. UNODC, Drug Money: the illicit proceeds of opiates trafficked on the Balkan route (Vienna, 2015). [Back]
209. West Africa Commission on Drugs, Not Just in Transit: Drugs, the State and Society in West Africa (2014). [Back]
210. Financial Action Task Force, Financial Flows Linked to the Production and Trafficking of Afghan Opiates (Paris, 2014). [Back]
211. United States v. HSBC Bank USA, N.A., No. 12-CR-763, 2013 WL 3306161, at 13-14 (E.D.N.Y. July 1, 2013). [Back]
212. Press Release, Department of Justice, HSBC Holdings Plc. and HSBC Bank USA N.A. Admit to Anti-Money Laundering and Sanctions Violations, Forfeit $ 1.256 Billion in Deferred Prose-cution Agreement, Dec. 11, 2012, http://www.justice.gov/opa/pr/hsbc-holdings-plc-and-hsbc-bank-usa-na-admit-anti-money-laundering-and-sanctions-violations, archived at http://perma.cc/NNX2-PCLJ. Statement by Lanny A. Breuer, Assistant Attorney General, to the HSBC Press Conference, New York, 11 December 2012. Available at www.justice.gov/. [Back]
213. General Assembly resolution S-30/1, annex. [Back]
214. See the online methodology section of the present report. [Back]
215. See previous footnote. [Back]
216. See previous footnote. [Back]
217. See previous footnote. [Back]
218. See the purpose codes of the OECD Creditor Reporting System Aid Activities database (valid for reporting up to and including 2014 flows), available at www.oecd.org. [Back]
219. Report of the Executive Director of UNODC on action taken by Member States to implement the Political Declaration and Plan of Action on International Cooperation towards an Integrated and Balanced Strategy to Counter the World Drug Problem (E/CN.7/2016/6). [Back]
Corruption and organized crime
 | This document has been published on 07Dec16 by the Equipo Nizkor and Derechos Human Rights. In accordance with Title 17 U.S.C. Section 107, this material is distributed without profit to those who have expressed a prior interest in receiving the included information for research and educational purposes. |