| Information |  | |
Derechos | Equipo Nizkor
| ||
| Information | | |
Derechos | Equipo Nizkor
| ||
May15
World Drug Report 2015
Back to topCONTENTS
PREFACE
EXPLANATORY NOTES
EXECUTIVE SUMMARY1. STATUS AND TREND ANALYSIS OF ILLICIT DRUG MARKETS
A. Extent of drug use
B. Health impact of drug use
C. Gender, drug use and health consequences
D. Drug use prevention
E. Treatment of drug use
F. Extent of drug supply
G. Market analysis by drug typeOpiates
H. Conclusions
Cocaine
Cannabis
Synthetic drugs: amphetamine-type stimulants and new psychoactive substancesA. Introduction
B. Setting the scene
C. Analysis of national alternative development strategies
D. Challenging context of alternative development
E. Drivers of illicit cultivation
F. Strategic elements of alternative development programmes
G. Measuring the success of alternative development
H. Points of future interest
I. ConclusionsANNEX I
Tables on drug cultivation, production and eradication and prevalence
UNODC is pleased to present the findings of the World Drug Report 2015, based on the best available data and our longstanding research expertise in the many complex facets of drugs and crime.
Member States are engaged in intensive discussions on the way forward to address the world drug problem, with the General Assembly special session on this topic to take place next year. This report is aimed at providing needed research input and informing collective responses to the challenges posed by the production, trafficking and use of illicit drugs.
The continuing discussions leading to the special session of the General Assembly have recognized the need for drug control policies that are balanced, comprehensive and integrated, with a focus on health and carried out with respect for human rights.
Numerous Security Council and General Assembly resolutions have emphasized the fact that the harm caused by illicit drugs has a significant impact on peace, security and development.
The ongoing debate on the post-2015 development agenda has further underscored the importance of promoting justice and the rule of law, and of addressing the threats that undermine them, including drugs, violence and organized crime.
Risk factors and circumstances that can render people more vulnerable to illicit drugs, as well as facilitate the establishment and expansion of illegal markets, are often related to issues of development, rule of law and governance. Policies can never be pursued in isolation, and drug control is no exception.
The need for such integrated responses, encompassing robust criminal justice action to disrupt organized criminal networks, measures to ensure access to controlled medications for medical purposes, and evidence- and health-based approaches to prevention and treatment, is more evident than ever.
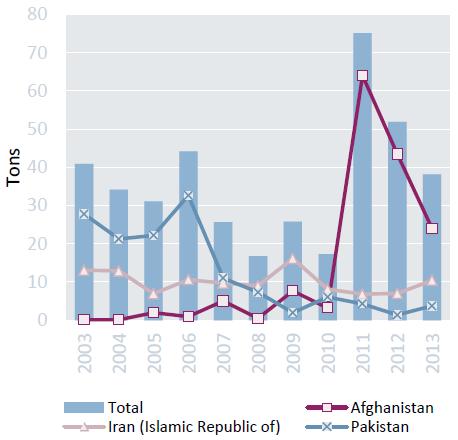
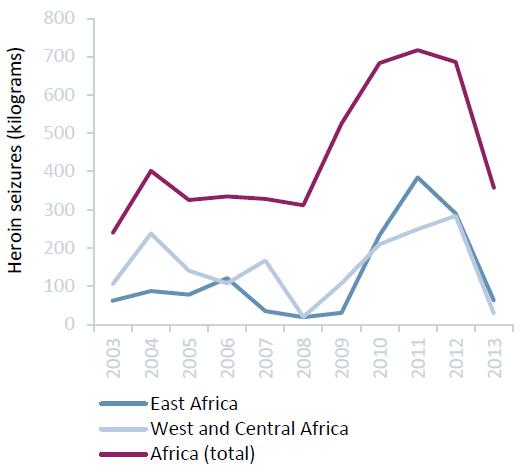
The vulnerability of Africa to drugs and crime remains a grave concern, with increasing seizures of heroin indicating the region's role as a key transit area for global drug trafficking routes. These illicit flows bring with them other forms of organized crime, and undermine security, health and development in an already-fragile region.
The nexus between organized crime and terrorism — in which illicit drug trafficking appears to play a role — poses a serious threat, as emphasized by recent Security Council resolutions calling for redoubled efforts to prevent terrorists from benefiting from transnational organized crime.
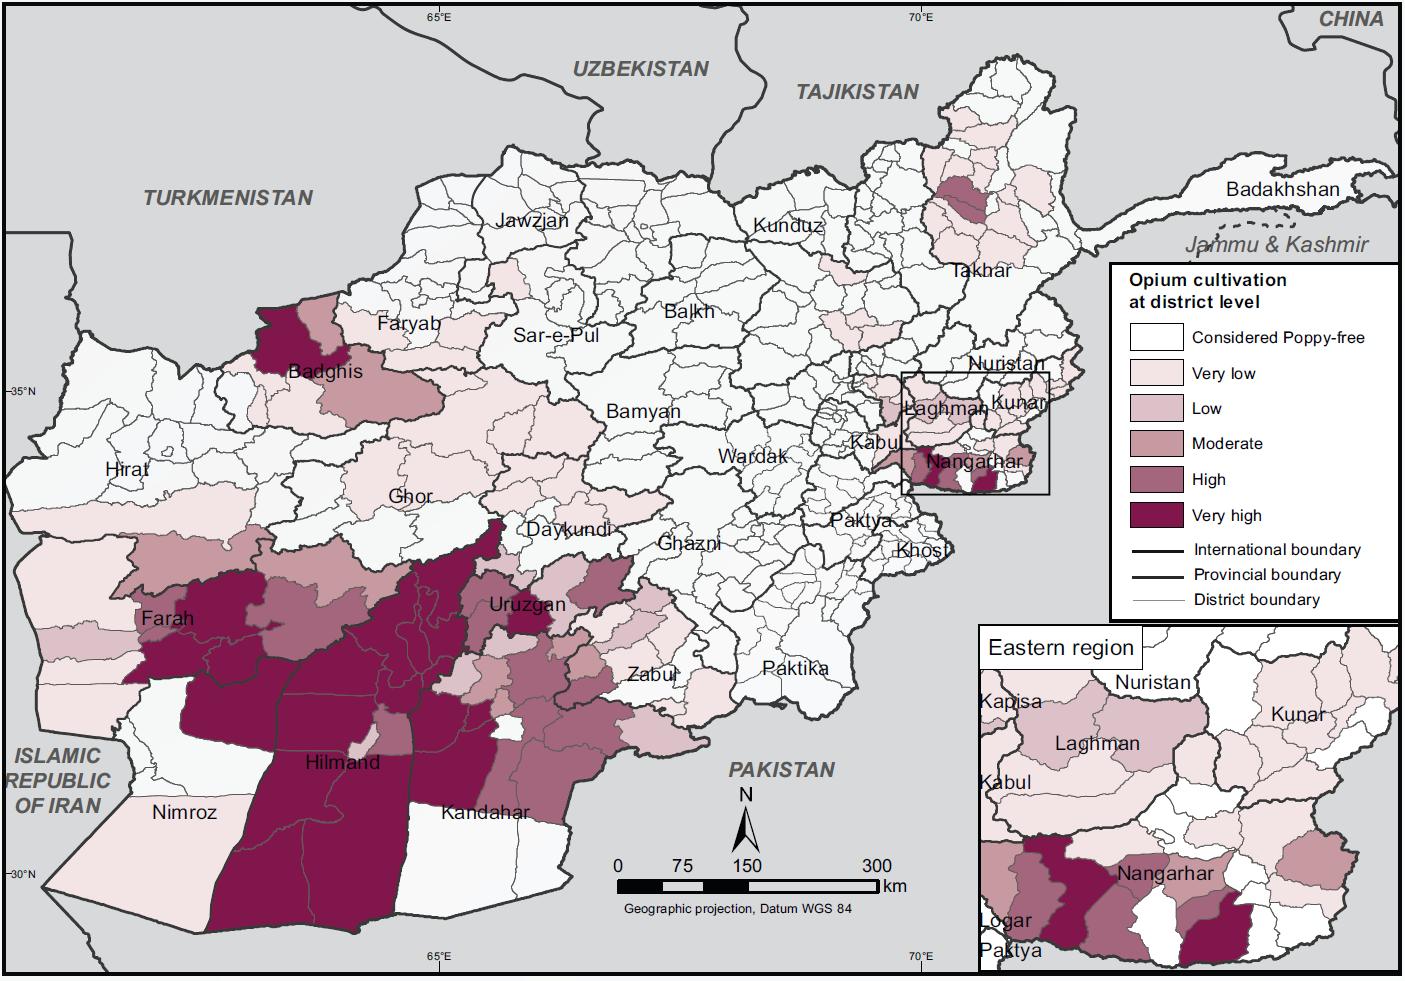
Record opium poppy cultivation in Afghanistan continues to present formidable challenges for the country and the international community.
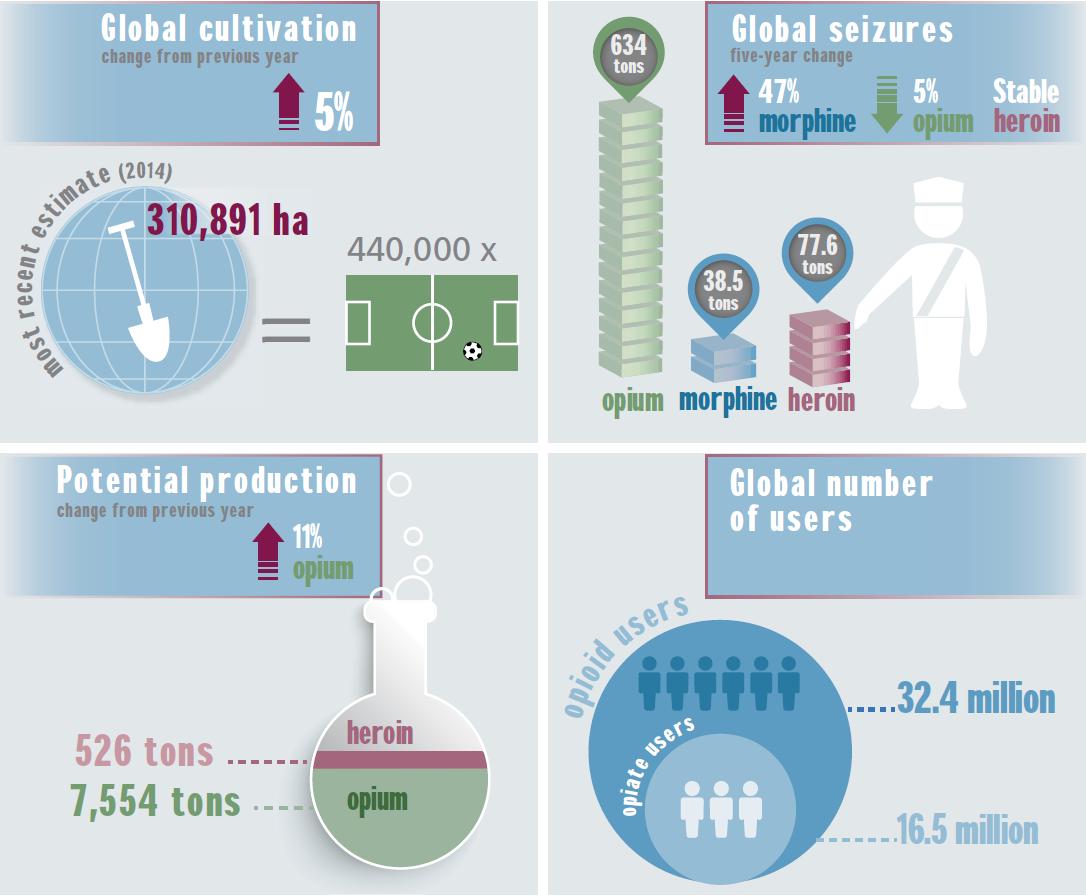
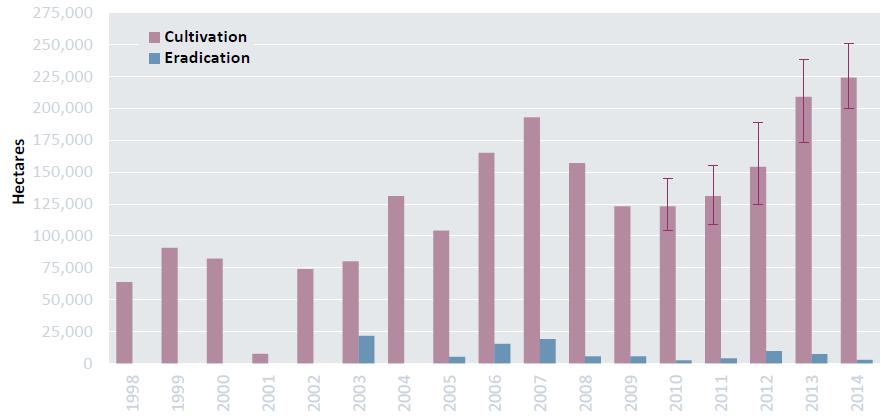
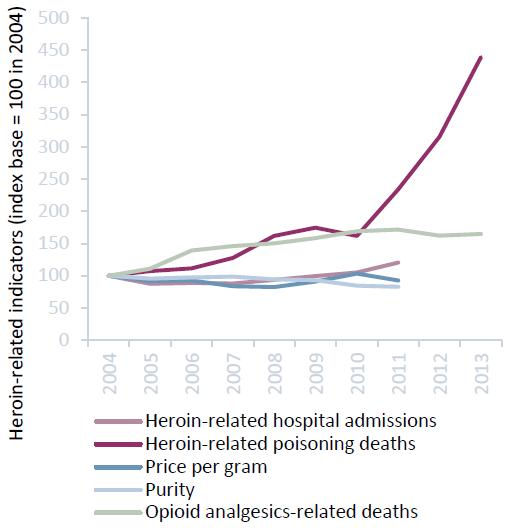
Global opium poppy cultivation in 2014 reached its highest level since the late 1930s. The increase in estimated opium and heroin production has not yet been reflected in an increase in heroin supply in most regions. But in some countries there have been signs of increases in heroin-related indicators such as mortality and health emergencies, and in others indications of increased purity and lower prices.
An unacceptable number of drug users worldwide continue to lose their lives prematurely, with an estimated 187,100 drug-related deaths in 2013.
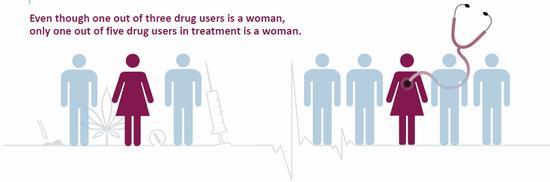
Only one out of six problem drug users globally has access to treatment. Women in particular appear to face barriers to treatment — while one out of three drug users globally is a woman, only one out of five drug users in treatment is a woman.
Clearly more work needs to be done to promote the importance of understanding and addressing drug dependence as a chronic health condition requiring, like HIV/AIDS, long-term, sustained treatment and care.
UNODC remains committed to working with Member States, as well as our United Nations and other partners, to further these efforts.
The thematic chapter of this year's report focuses on alternative development.
Alternative development presents many challenges, with programmes often undertaken in marginalized, isolated areas with limited government control, unclear land rights and lack of infrastructure, where few other development actors may be operating.
Nevertheless, the decades-long experience of UNODC has made it clear that alternative development can work, when initiatives are informed by a long-term vision, sustained with adequate funding and political support, and integrated into a broader development and governance agenda.
Approached holistically, alternative development has the potential to break the vicious cycle trapping poor farmers and to act as a catalyst for viable livelihoods that do not depend on illicit cultivation.
The World Drug Report 2015 chapter on alternative development, based on reviews of successful projects, highlights factors that have contributed to fostering a sustainable licit economy, including transfer of skills and access to land, credit and infrastructure, as well as marketing support and access to markets.
The chapter further underlines the potential of alternative development to contribute to environmental protection, empower women and support communities affected by other forms of crime, including illegal mining or wildlife and forest crime.
Unfortunately, the report also shows that widespread political support for alternative development has not been matched by funding.
Member States have repeatedly endorsed alternative development. There is also a welcome trend towards South-South cooperation, with the exchange of best practices and local experiences, as well as increased financial investments and technical support from countries such as Bolivia (Plurina-tional State of), Colombia, Peru and Thailand.
Nevertheless, overall gross disbursements of alternative development funds from countries of the Organization for Economic Cooperation and Development accounted for just 0.1 per cent of global development assistance in 2013.
The post-2015 development agenda and the process towards the special session of the General Assembly on the world drug problem to be held in 2016 can provide an important impetus for alternative development efforts, as well as for broader interventions addressing supply and demand.
Impoverished farmers growing coca and opium poppy to eke out an unsustainable living; fragile regions and communities reeling from the harm caused by the transit of illicit drugs, on their way to richer markets; women, men and children struggling with drug dependence, with nowhere to turn. Illicit drugs hurt so many people, in so many places, and they need our help. The international community must respond with determination and compassion, and I hope the World Drug Report 2015 will help to reinforce this message.
I would like to take this opportunity to thank Member States for their help in producing this report, which relies on the willingness to share data, promote transparency and provide assistance. That is to say, it relies on the very spirit of openness and shared responsibility needed to address the multidimensional challenges posed by illicit drugs, and we count on your continued support.
Yury Fedotov
Executive Director
United Nations Office on Drugs and Crime
The boundaries and names shown and the designations used on maps do not imply official endorsement or acceptance by the United Nations. A dotted line represents approximately the line of control in Jammu and Kashmir agreed upon by India and Pakistan. The final status of Jammu and Kashmir has not yet been agreed upon by the parties. Disputed boundaries (China/India) are represented by cross-hatch owing to the difficulty of showing sufficient detail.
The designations employed and the presentation of the material in this publication do not imply the expression of any opinion whatsoever on the part of the Secretariat of the United Nations concerning the legal status of any country, territory, city or area, or of its authorities or concerning the delimitation of its frontiers or boundaries.
Countries and areas are referred to by the names that were in official use at the time the relevant data were collected.
All references to Kosovo in the present publication should be understood to be in compliance with Security Council resolution 1244 (1999).
Since there is some scientific and legal ambiguity about the distinctions between "drug use", "drug misuse" and "drug abuse", the neutral terms "drug use" and "drug consumption" are used in the present report.
All analysis contained in this report is based on the official data submitted by member States to the United Nations Office on Drugs and Crime through the annual report questionnaire unless indicated otherwise.
The data on population used in the present report are from: United Nations, Department of Economic and Social Affairs, Population Division, World Population Prospects: The 2012 Revision.
References to dollars ($) are to United States dollars, unless otherwise stated.
References to tons are to metric tons, unless otherwise stated.
The following abbreviations have been used in the present report:
ADHD attention deficit hyperactivity disorder ATS amphetamine-type stimulants CBD cannabidiol CICAD Inter-American Drug Abuse Control Commission (Organization of American States) DEA Drug Enforcement Administration EMCDDA European Monitoring Centre for Drugs and Drug Addiction Europol European Police Office FAO Food and Agriculture Organization of the United Nations FWID females who inject drugs GDP gross domestic product GIZ German Agency for International Cooperation INCB International Narcotics Control Board INCSR International Narcotics Control Strategy Report, of the United States State Department LSD lysergic acid diethylamide MDA 3,4-methylenedioxyamphetamine MDMA 3,4-methylenedioxymethamphetamine MWID males who inject drugs 3,4-MDP-2-P 3,4-methylenedioxyphenyl-2-propanone 4-MEC mythylethcathinone NPS new psychoactive substances OECD Organization for Economic Cooperation and Development PWID people who inject drugs SAMHSA Substance Abuse and Mental Health Service Administration (United States) THC Δ9-tetrahydrocannabinol UNAIDS Joint United Nations Programme on HIV/AIDS USAID United States Agency for International Development UNFDAC United Nations Fund for Drug Abuse Control UNDCP United Nations International Drug Control Programme UNODC United Nations Office on Drugs and Crime WHO World Health Organization WTO World Trade Organization
The World Drug Report presents a comprehensive annual overview of the latest developments in the world's illicit drug markets by focusing on the production of, trafficking in and consumption of the main illicit drug types and their related health consequences. Chapter 1 of the World Drug Report 2015 provides a global overview of the supply of and demand for opiates, cocaine, cannabis, amphetamine-type stimulants (ATS) and new psychoactive substances (NPS), as well as their impact on health, and reviews the scientific evidence on approaches to drug use prevention and addresses general principles for effective responses to treatment for drug use. Chapter 2 focuses on how alternative development, within the broader context of the development agenda, aims to break the vicious cycle of illicit crop cultivation by providing farmers with alternative livelihoods.
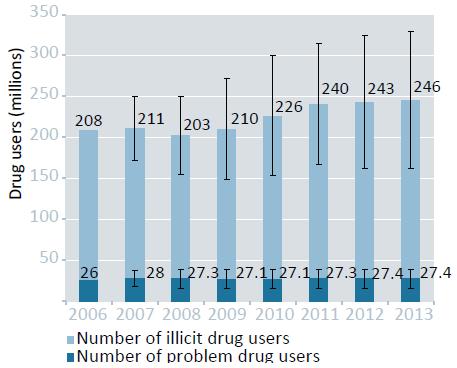
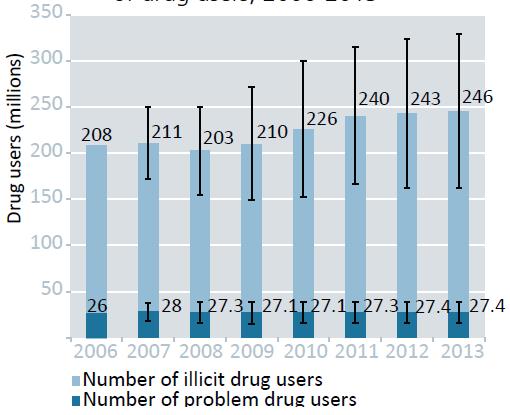
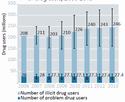
Global trends in the estimated number of drug users, 2006-2013
Click to enlargeSource: UNODC, responses to annual report questionnaire.
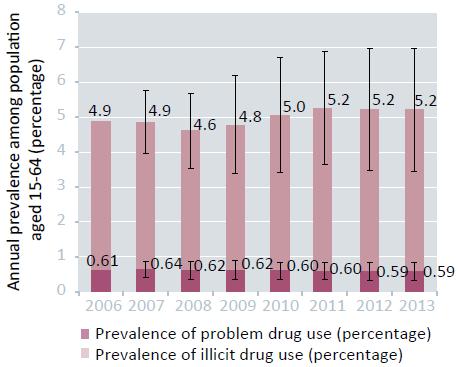
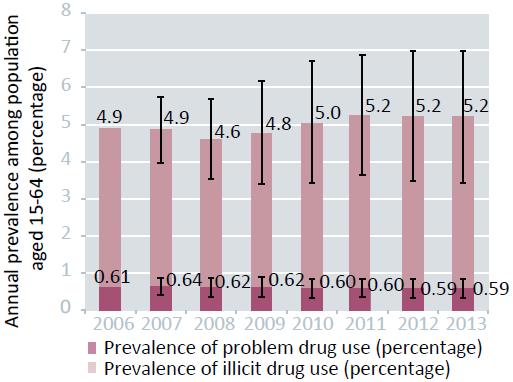
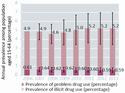
Note: Estimated percentage of adults (aged 15-64) who have used drugs in the past year.Global trends in the estimated prevalence of drug use, 2006-2013
Click to enlargeSource: UNODC, responses to annual report questionnaire.
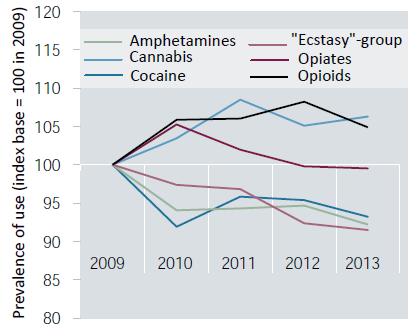
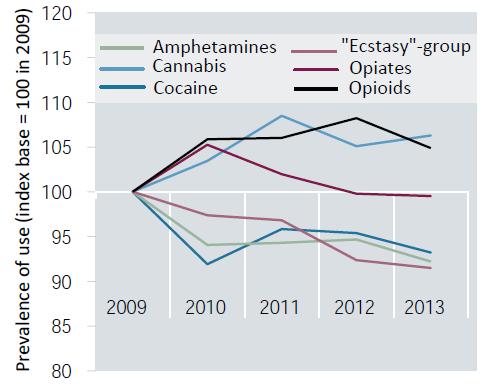
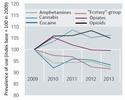
Note: Estimates are for adults (aged 15-64), based on past-year use.Global trends in the prevalence of use of various drugs, 2009-2013
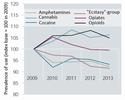
Click to enlargeSource: UNODC, responses to annual report questionnaire.
Note: Based on the estimated percentage of adults (aged 15-64) who have used the substance in the past year.According to the most recent data available, there has been little change in the overall global situation regarding the production, use and health consequences of illicit drugs. The health consequences of illicit drug use continue to be a matter of global concern, as the vast majority of problem drug users continue to have no access to treatment. Furthermore, the increase in global opium poppy cultivation and opium production to record levels has yet to have major repercussions on the global market for opiates. This raises concerns about the size of the challenge to law enforcement posed by increasingly sophisticated and versatile organized criminal groups.
Drug use and its health consequences
It is estimated that a total of 246 million people, or 1 out of 20 people between the ages of 15 and 64 years, used an illicit drug in 2013. That represents an increase of 3 million over the previous year but, because of the increase in the global population, illicit drug use has in fact remained stable.
The magnitude of the world drug problem becomes more apparent when considering that more than 1 out of 10 drug users is a problem drug user, suffering from drug use disorders or drug dependence. In other words, some 27 million people, or almost the entire population of a country the size of Malaysia, are problem drug users. Almost half (12.19 million) of those problem drug users inject drugs, and an estimated 1.65 million of those who inject drugs were living with HIV in 2013.
This places a heavy burden on public health systems in terms of the prevention, treatment and care of drug use disorders and their health consequences. Only one out of every six problem drug users in the world has access to treatment, as many countries have a large shortfall in the provision of services. The annual number of drug-related deaths (estimated at 187,100 in 2013) has remained relatively unchanged. An unacceptable number of drug users continue to lose their lives prematurely, often as a result of overdose, even though overdose-related deaths are preventable.
Notwithstanding national and regional variations in trends in drug use, the limited data available indicate that the use of opiates (heroin and opium) has remained stable at the global level. Mainly as a result of trends in the Americas and Europe, cocaine use has declined overall, while the use of cannabis and the non-medical use of pharmaceutical opioids have continued to rise. Trends in ATS use vary from region to region, and some subregions such as South-East Asia have reported an increase in methamphetamine use.
There are also indications that the number of people requiring treatment for cannabis use is increasing in most regions. The evidence suggests that more drug users are suffering from cannabis use disorders, and there is growing evidence that cannabis may be becoming more harmful. This is reflected in the high proportion of persons entering treatment for the first time for cannabis use disorders in Europe, North America and Oceania. According to the limited information available, cannabis ranks first among the drug types for which people in Africa enter treatment for drug use.
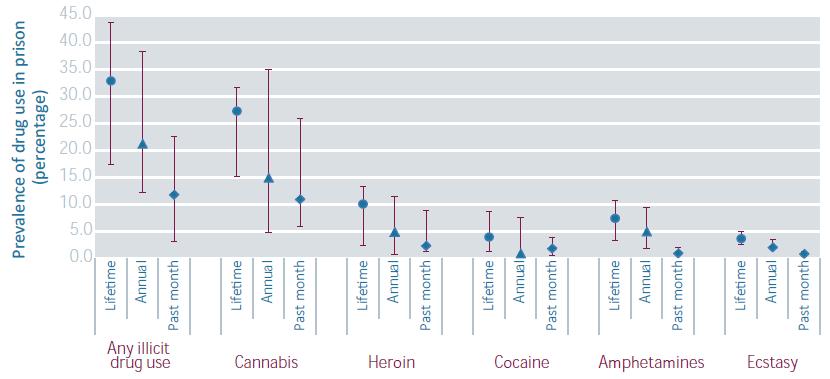
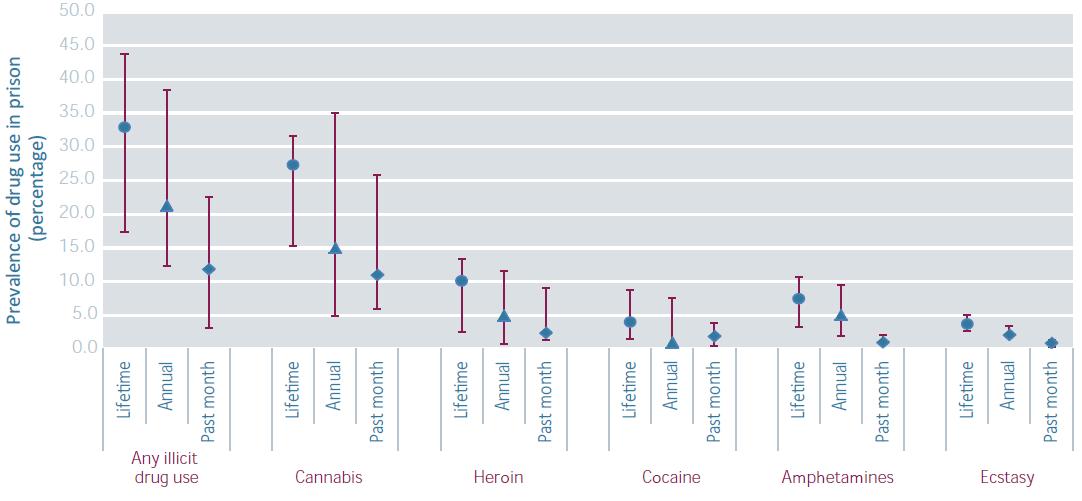
Lifetime, annual and past-month prevalence of drug use in prisons (based on 62 studies from 43 countries over the period 2000-2013)
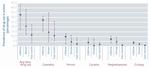
Click to enlargeSource: UNODC, responses to annual report questionnaire; and C. Carpentier, L. Royuela and L. Montanari, "The global epidemiology of drug use in prison" (2015).
Note: Symbols represent median prevalence with vertical lines depicting inter-quartile range. Data on lifetime, annual and past-month use are not consistent across studies (this explains why the annual prevalence of cocaine use has a median value lower than the past-month use).Cannabis is by far the most frequently used drug in prisons. Though data on the subject are limited, there are indications that one third of prisoners have used a drug at least once while incarcerated. Lifetime and recent (past-month) use of heroin in prisons is much higher than that of cocaine, amphetamines or "ecstasy". Prison is a high-risk, controlled environment where drug use, including injecting drug use, often takes place in particularly unsafe conditions. This may explain why the prison environment can be characterized by high levels of infectious diseases, particularly HIV but also hepatitis C and tuberculosis, and by limited access to prevention and treatment, which increases the risk of contracting blood-borne viruses.
The number of people requiring treatment for ATS use is also increasing globally. This is probably attributable to the sheer weight of numbers, as the prevalence of ATS use is relatively high in Asia, where there is high demand for treatment but the expertise in treating ATS use disorders is not at the same level of sophistication as the expertise in treating opiate use disorders.
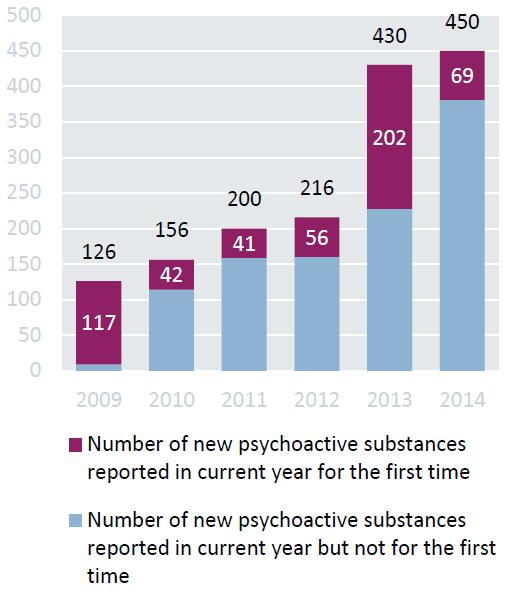
NPS are marketed as alternatives to internationally controlled drugs and are purported to produce effects similar to those of their "traditional" counterparts. They have the potential to pose serious risks to public health and safety. Information and research on the potential harm caused by NPS are limited, but the proliferation of the estimated 500 NPS, including mephedrone, poses a health threat to drug users and has increased demand for treatment for drug use.
Even though one out of three drug users is a woman, only one out of five drug users in treatment is a woman.
Cocaine remains the primary drug of concern in Latin America and the Caribbean, whereas the use of opiates remains the most problematic form of drug use globally. This can be attributed to the relationship between the use of opiates and injecting drug use, HIV, AIDS and overdose deaths and to the fact that the use of opiates accounts for the majority of treatment admissions for drug use in Asia and Europe.
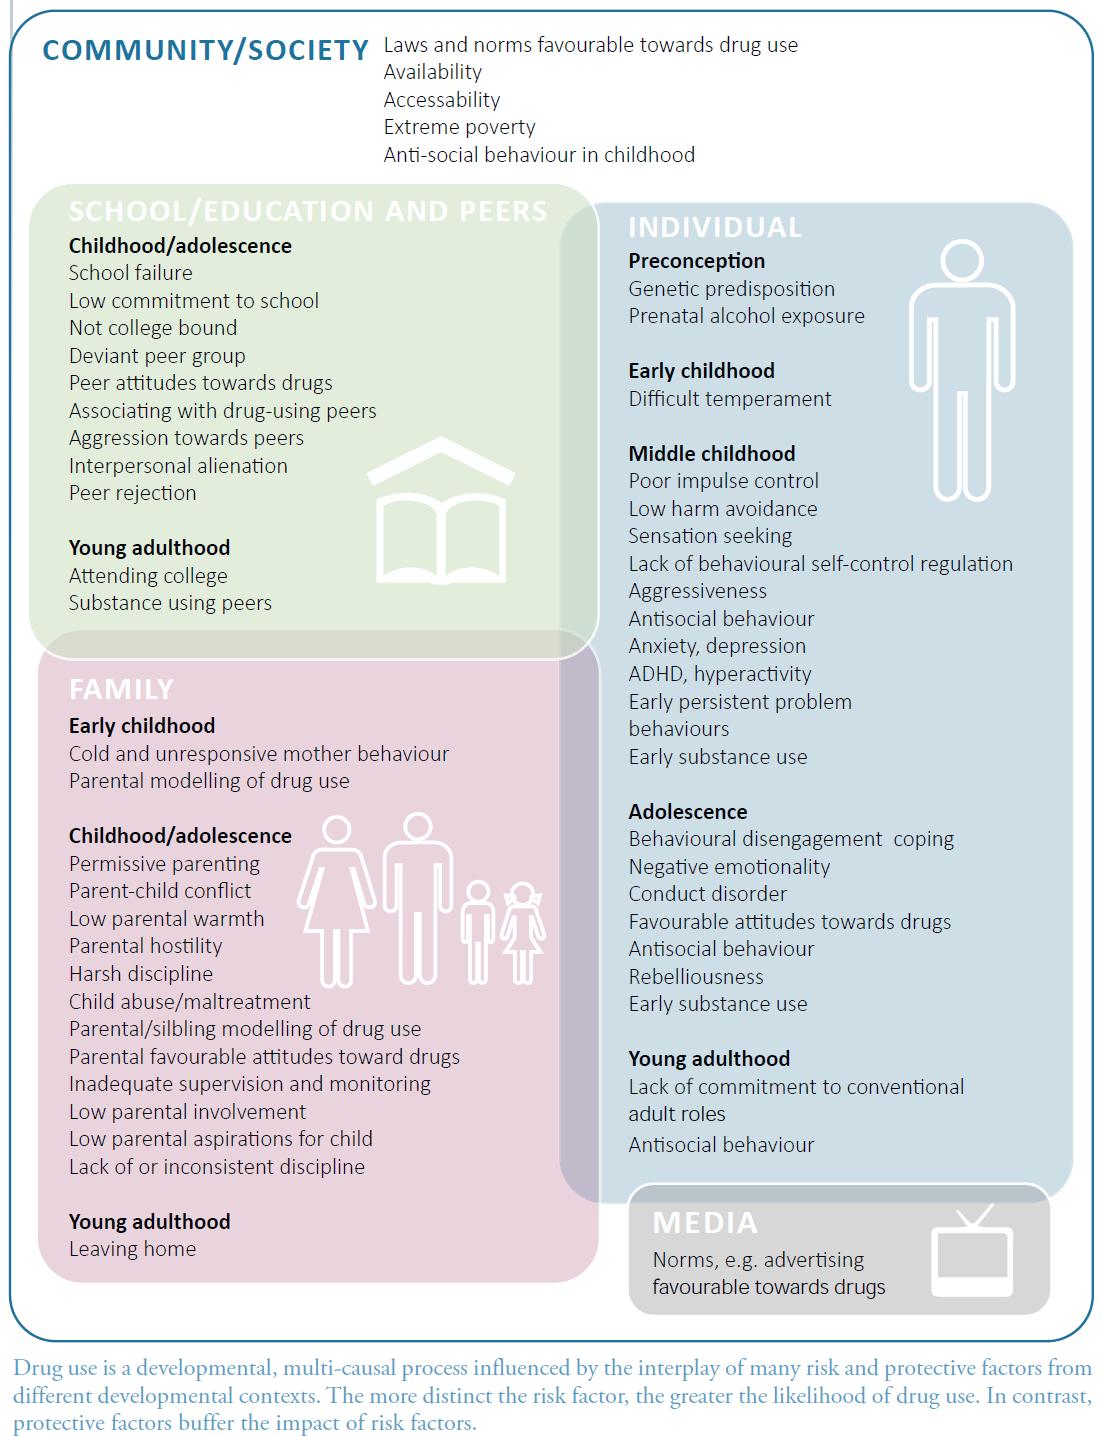
Public perceptions about the rehabilitation of drug-dependent persons tend to oversimplify the magnitude of drug dependence. There is no quick and simple remedy for drug dependence. It is a chronic health condition and, as with other chronic conditions, the affected persons remain vulnerable for a lifetime and require long-term and continued treatment. There is a growing body of research showing that many interventions aimed at preventing the initiation of drug use (or the potential transition to drug use disorders) can be effective if they address the different personal and environmental vulnerabilities of children and young people — factors that are largely beyond a person's control.
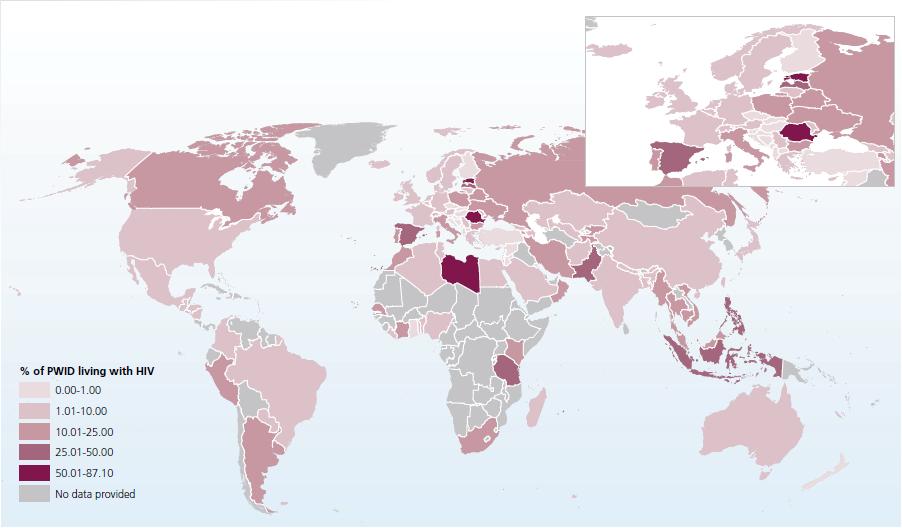
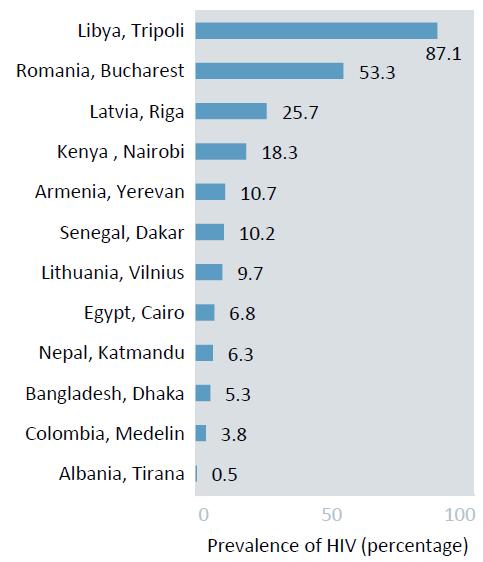
Prevalence of HIV among people who inject drugs, 2013 or latest year available
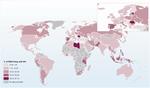
Click to enlargeNote: The boundaries shown on this map do not imply official endorsement or acceptance by the United Nations. Dashed lines represent undetermined boundaries. The dotted line represents approximately the Line of Control in Jammu and Kashmir agreed upon by India and Pakistan. The final status of Jammu and Kashmir has not yet been agreed upon by the parties. The final boundary between the Sudan and South Sudan has not yet been determined. A dispute exists between the Governments of Argentina and the United Kingdom of Great Britain and Northern Ireland concerning sovereignty over the Falkland Islands (Malvinas).
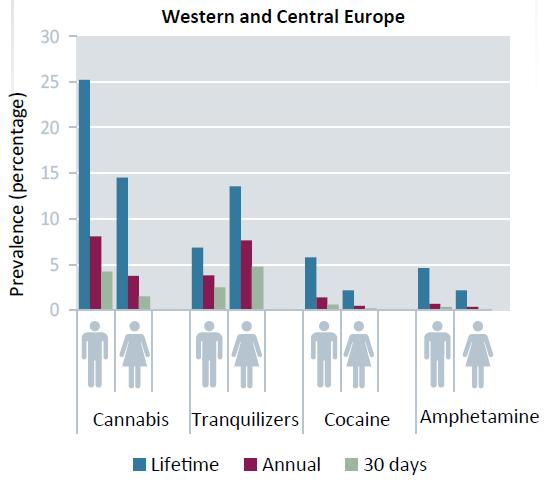
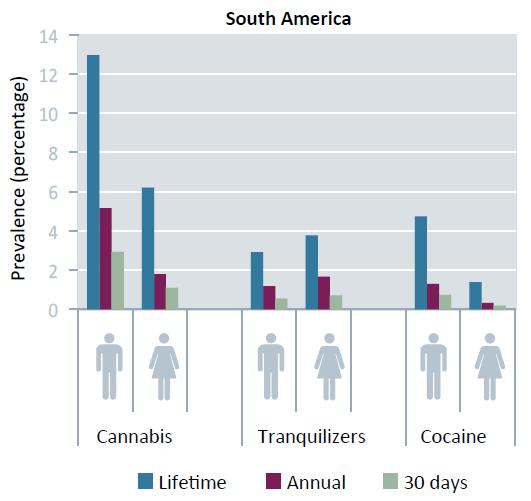
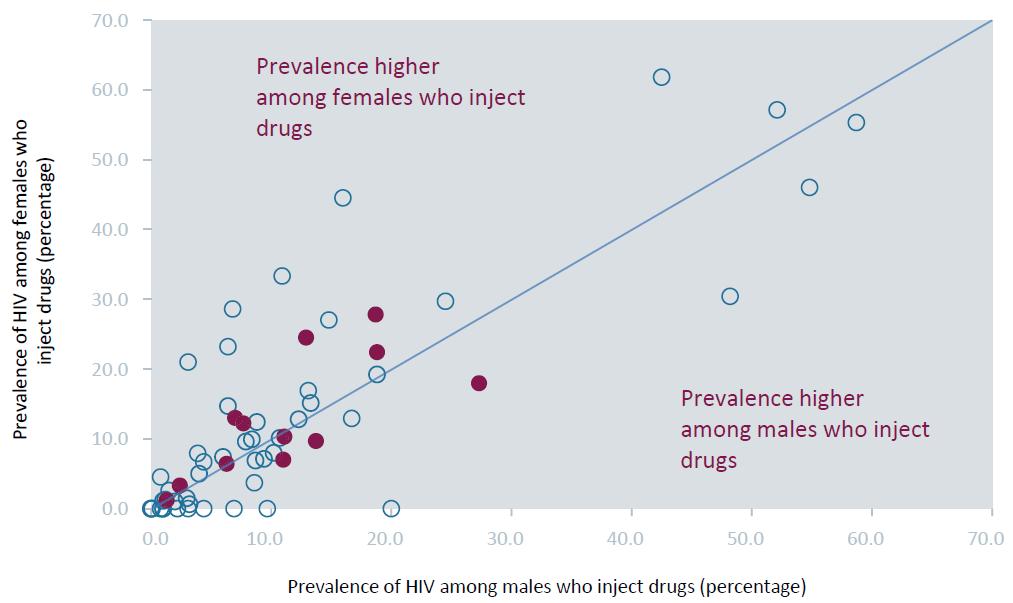
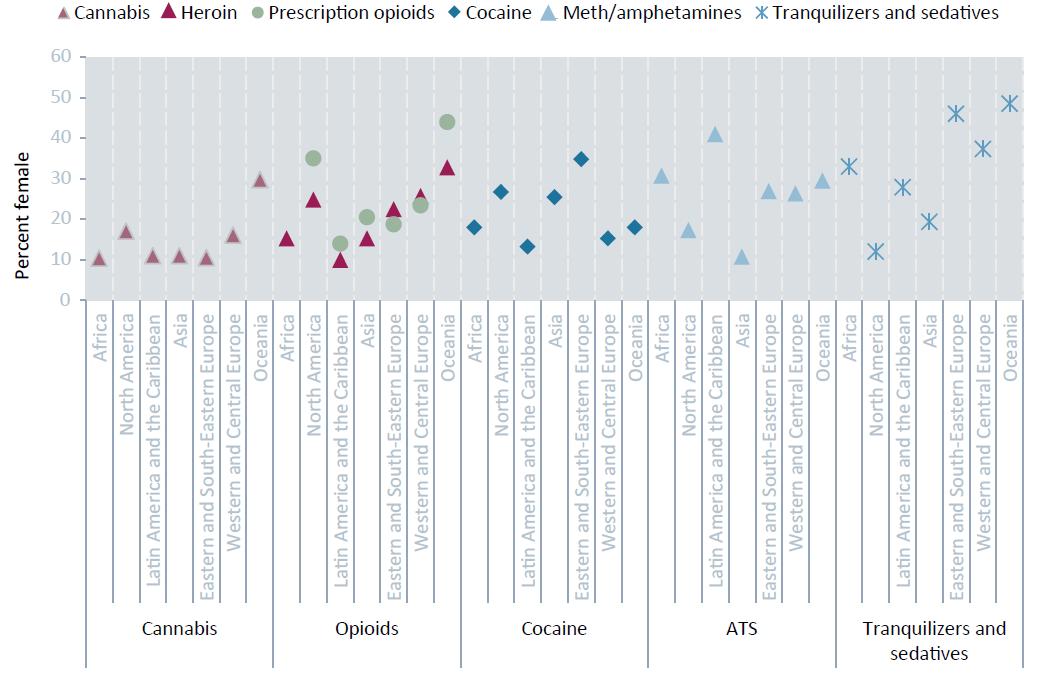
A number of social and structural barriers clearly continue to hinder the access of women to treatment for drug use: globally, only one out of five drug users in treatment is a woman even though one out of three drug users is a woman. A large body of evidence has shown that social and biological factors relating to initiation of substance use, continued substance use and the development of problems related to substance use vary considerably between men and women. Men are three times more likely than women to use cannabis, cocaine and amphetamines, whereas women are more likely than men to misuse prescription opioids and tranquillizers. As the likelihood that initiation of the misuse of tranquillizers and prescription opioids may lead to regular or current use is relatively high compared with other drugs, this remains an area of particular concern for women. Available data on HIV prevalence among people who inject drugs show that, in many countries, women who inject drugs are more vulnerable to HIV infection than their male counterparts and that the prevalence of HIV is higher among women who inject drugs than among their male counterparts.
Some progress has been made towards achieving the target set in the 2011 Political Declaration on HIV and AIDS of reducing by 50 per cent HIV transmission among people who inject drugs by 2015. |1| Although the number of newly diagnosed cases of HIV among people who inject drugs declined by roughly 10 per cent, from an estimated 110,000 in 2010 to 98,000 in 2013, this target is unlikely to be met.
The transmission of infectious diseases such as HIV and hepatitis C and the occurrence of drug overdoses are only some of the risk factors that lead to the level of mortality among people who inject drugs being nearly 15 times higher than would normally be expected among people of comparable age and gender in the general population.
Not all drug overdoses are fatal; different studies have estimated that only 1 out of 20-25 overdose cases is fatal.
Non-fatal overdoses are underreported and are a common experience among drug users; however, the cumulative risk of death increases with each successive overdose.
DRUG SUPPLY AND MARKETS
The production of cannabis resin continues to be confined to a few countries in North Africa, the Middle East and South-West Asia, whereas cannabis herb is produced in most of the countries in the world. South America continues to account for practically all global cultivation of coca bush, and South-West Asia (Afghanistan) and SouthEast Asia (mainly the Lao People's Democratic Republic and Myanmar) continue to account for the vast majority of illicit opium poppy cultivation. Although the manufacture of ATS is difficult to assess, there are reports of ATS manufacture in all regions worldwide.
There may have been no major change in the regions in which illicit crop cultivation and drug manufacture take place, but the illicit drug markets and the routes along which drugs are smuggled continue to be in a state of flux. The "dark net", the anonymous online marketplace used for the illegal sale of a wide range of products, including drugs, is a prime example of the constantly changing situation, and it has profound implications for both law enforcement and drug trafficking.
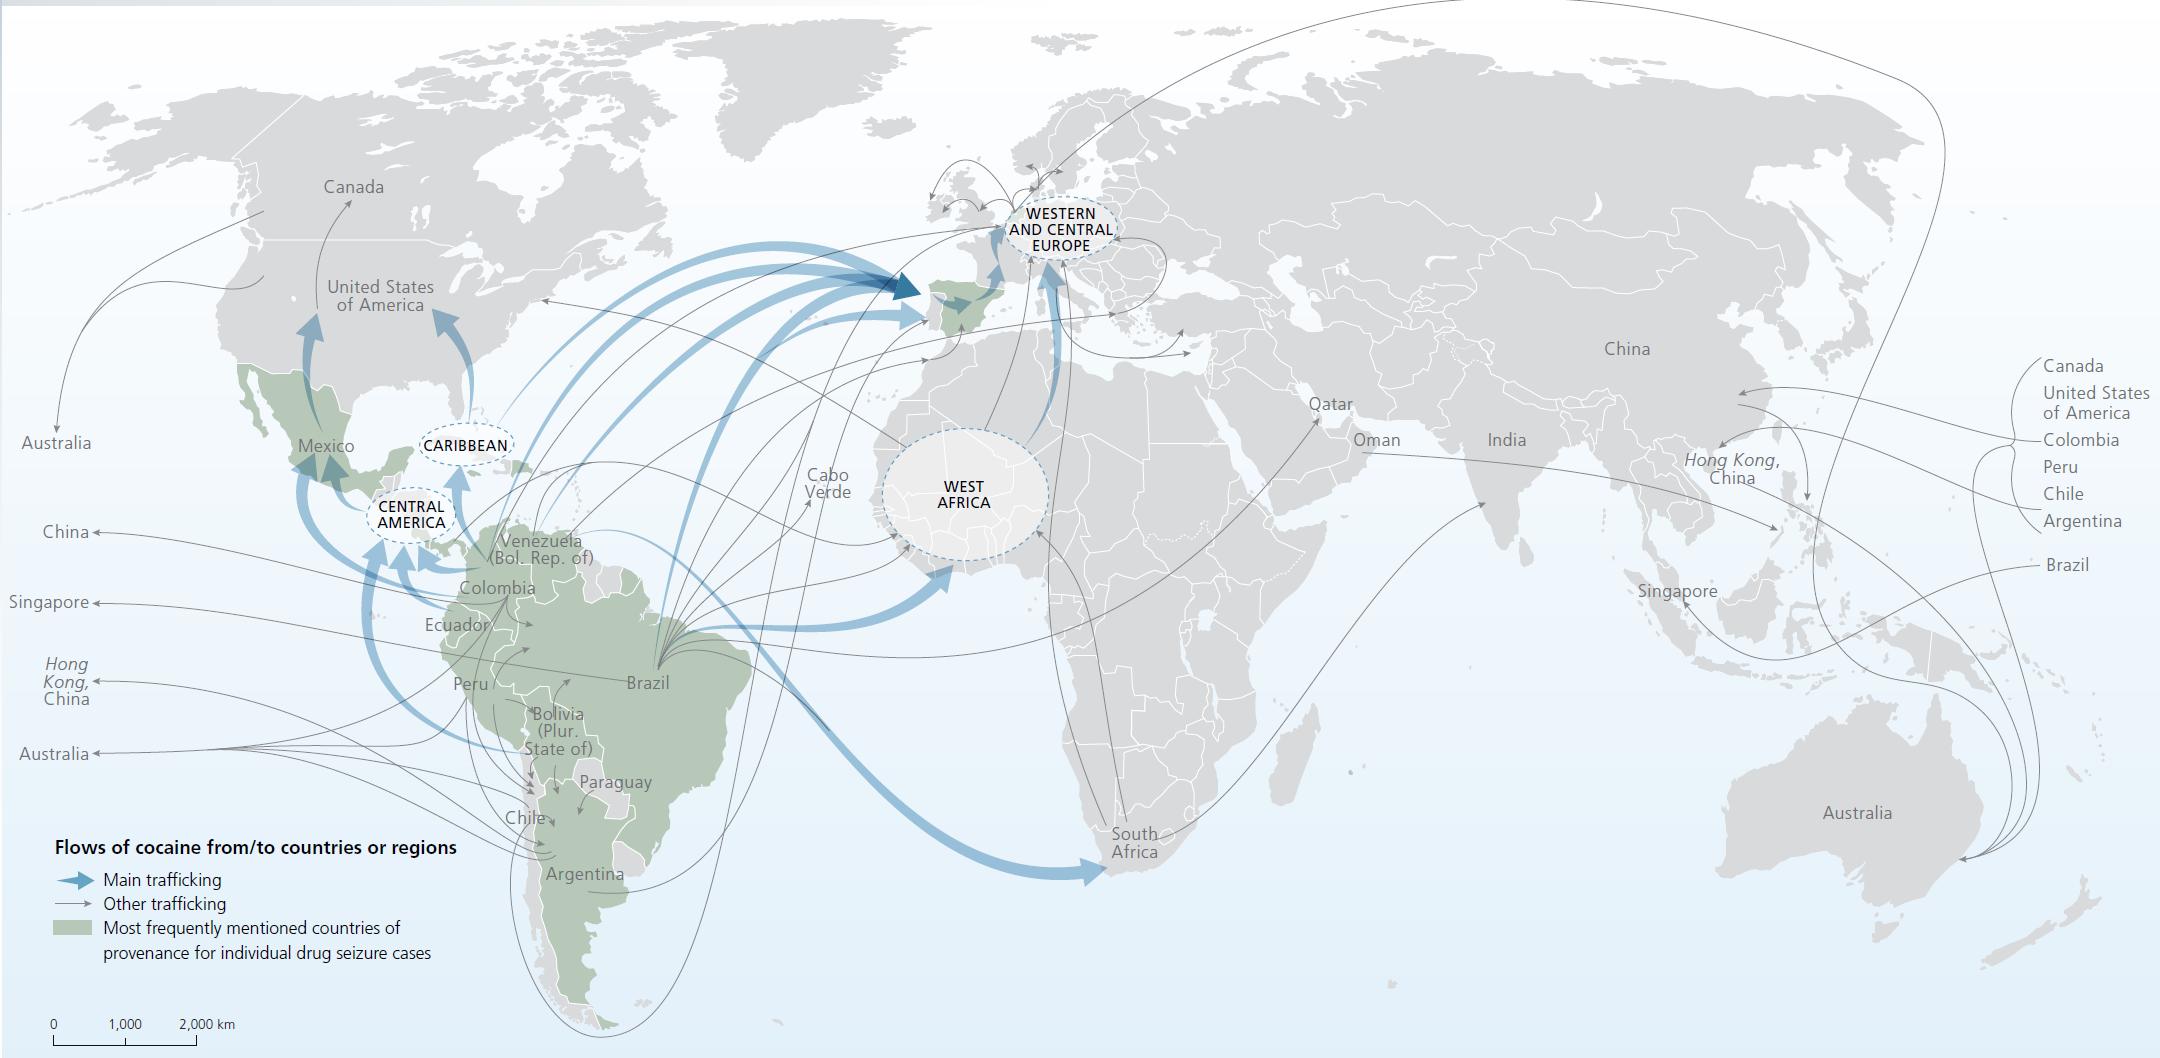
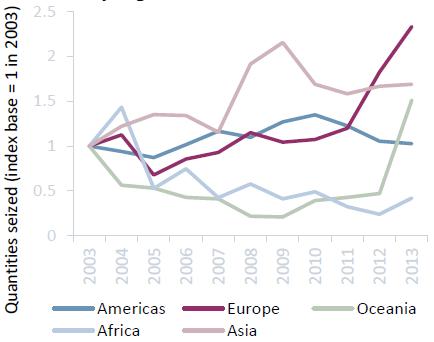
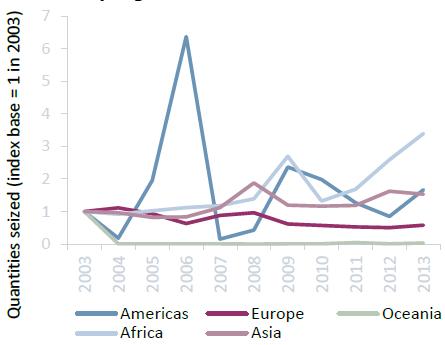
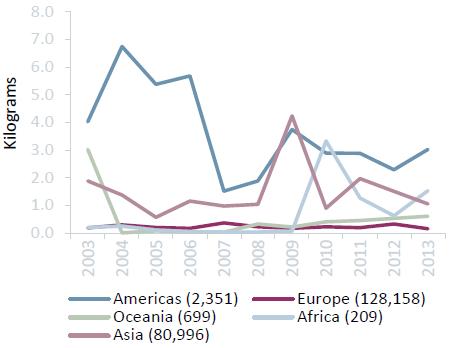
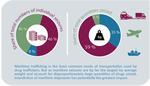
A more classic example of this dynamic aspect is the continued shift in the routes used for smuggling opiates and the fact that Afghan heroin may be reaching new markets. The growing importance of Africa as a transit area for Afghan heroin bound for Europe and other regions has been reflected in increasing seizures of heroin reported in recent years in some African countries, particularly in East Africa. Recent seizures also suggest that it may have become more common for large shipments of Afghan heroin to be smuggled across the Indian Ocean into East and Southern Africa. Moreover, Africa continues to be used as a trans-shipment area for smuggling cocaine across the Atlantic into Europe, and Eastern Europe is emerging as a transit area and as a destination. The quantities being smuggled are small but this may be an indication that the cocaine market is moving eastwards.
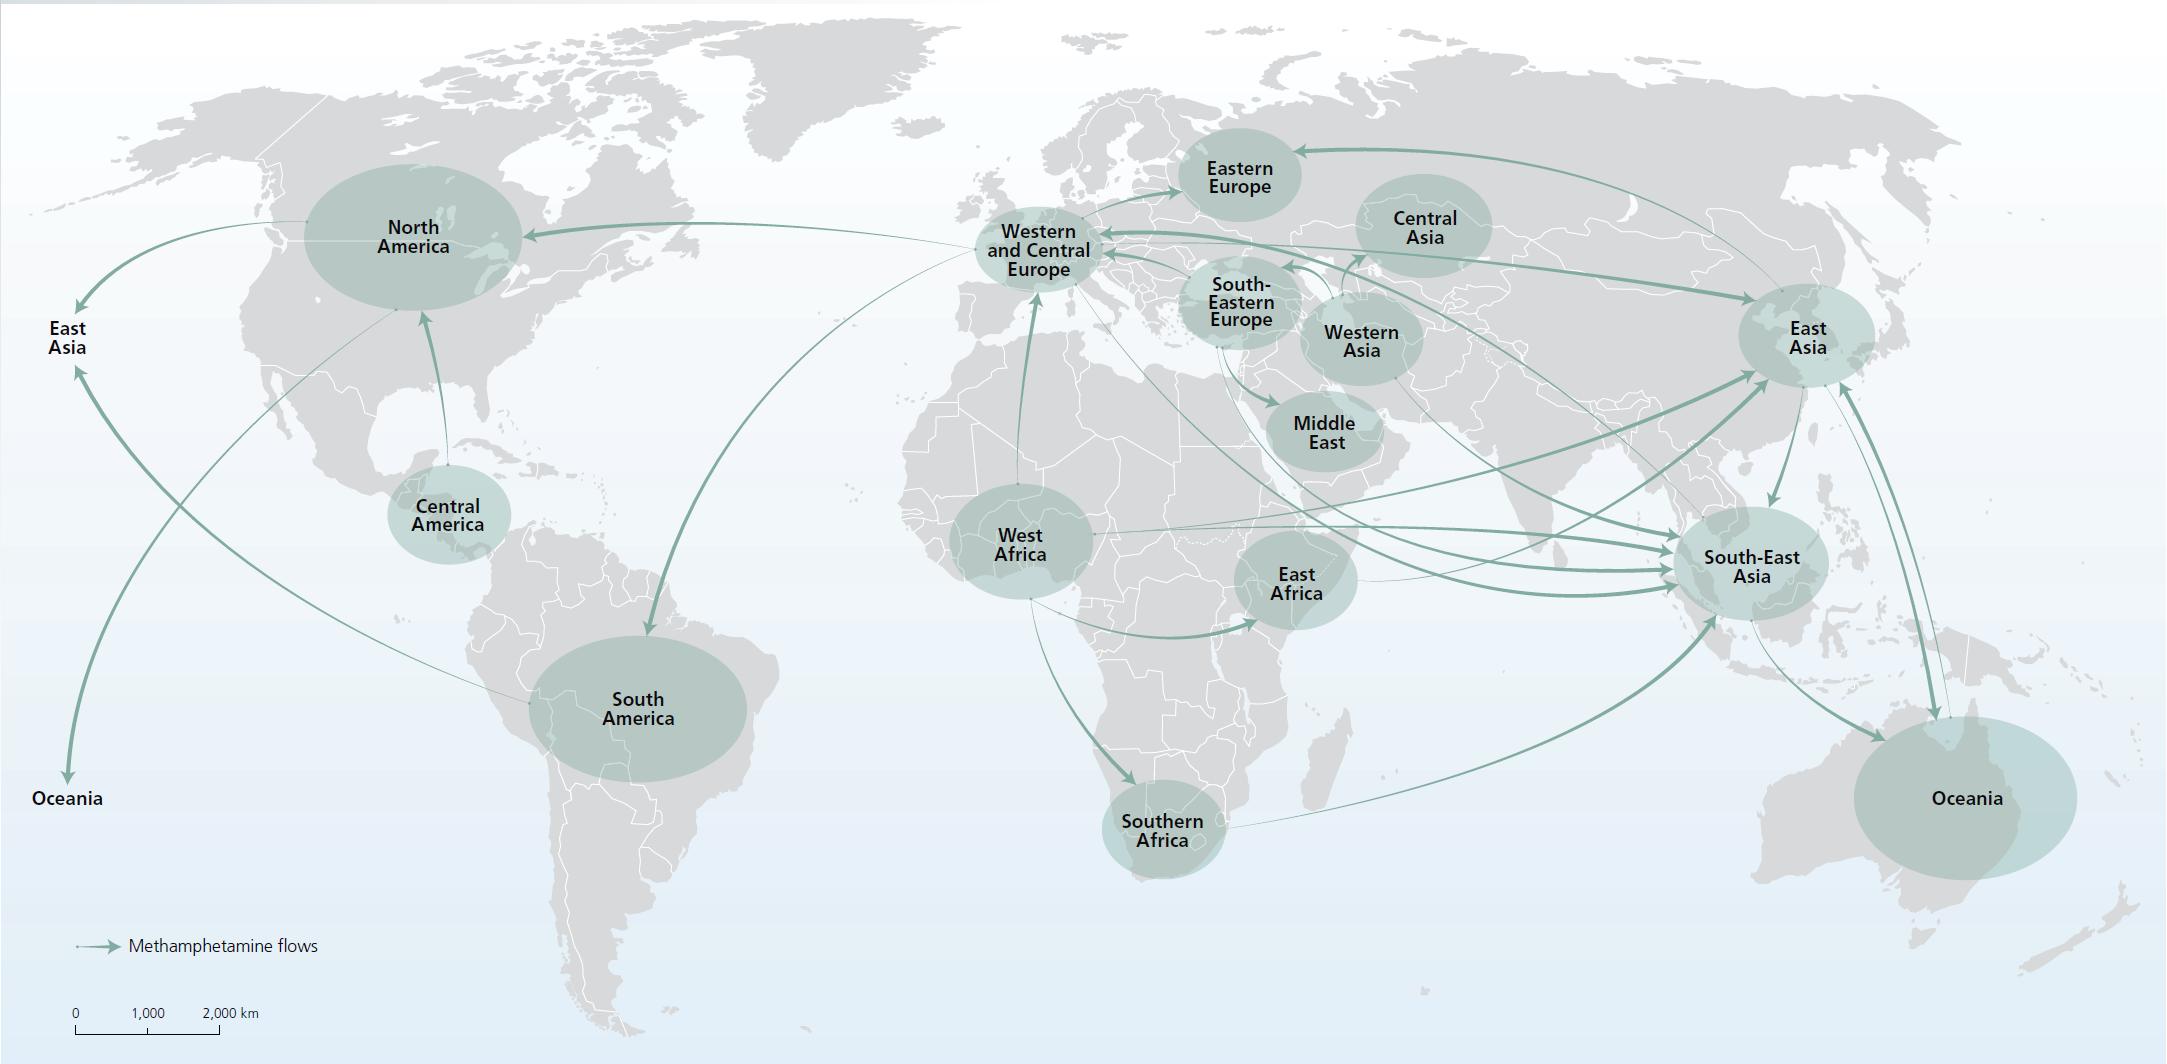
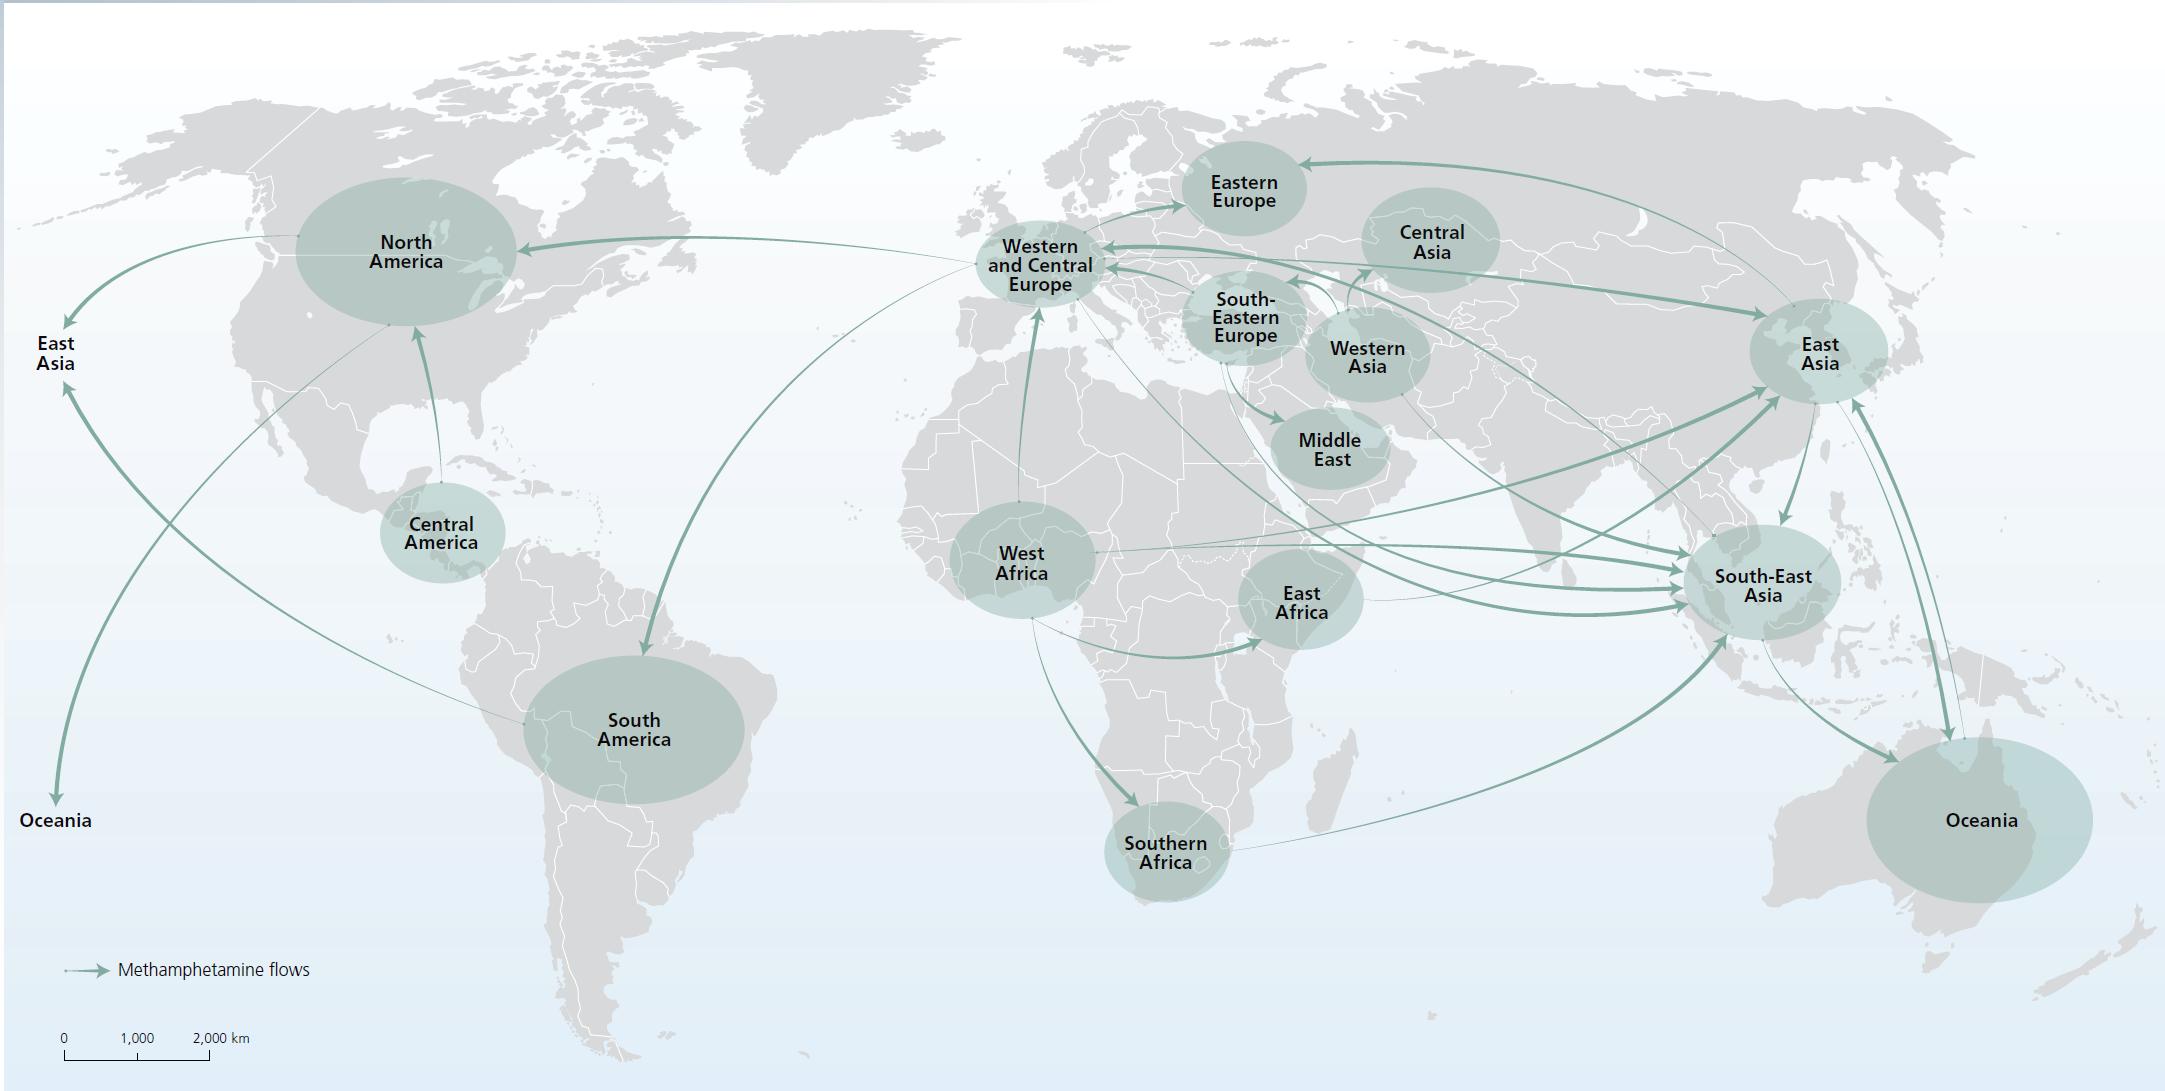
Click to enlargeWest Africa appears to have become an established source of the methamphetamine smuggled into East and South-East Asia via Southern Africa or Europe, with new trafficking routes linking previously unconnected regional methamphetamine markets. The established market for methamphetamine in East and South-East Asia continues to grow, while there are also indications of increasing methamphetamine use in parts of North America and Europe.
As opiates originating in Myanmar may be unable to meet the demand in South-East Asia, the so-called "southern route" could be increasing in importance as a conduit for smuggling Afghan heroin southwards from Afghanistan through Pakistan or the Islamic Republic of Iran. Trafficking networks using the Balkan route to smuggle Afghan heroin into Europe may be experimenting with a new route, leading through the Caucasus, and there are indications of heroin being trafficked from Iraq rather than from the Islamic Republic of Iran.
Not only are drug trafficking routes undergoing change, but there is also evidence that organized criminal groups, which in the past may have limited their trafficking activities to one drug type, are diversifying. For example, groups that previously focused on heroin trafficking appear to be increasingly engaging in trafficking in cannabis resin and methamphetamine.
To a certain extent, there has also been a shift in the focus of the trafficking routes themselves. There is increasing evidence that routes traditionally used for smuggling one type of drug are now being used for smuggling other drug types. While there appears to be an evolution in the countries reported to be used as transit hubs for certain drugs, such as African countries being used as transit areas for heroin and cocaine, certain African countries are also increasingly being used as transit areas for different types of drugs.
Opiates
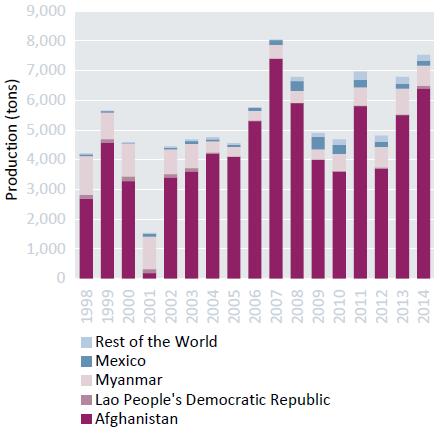
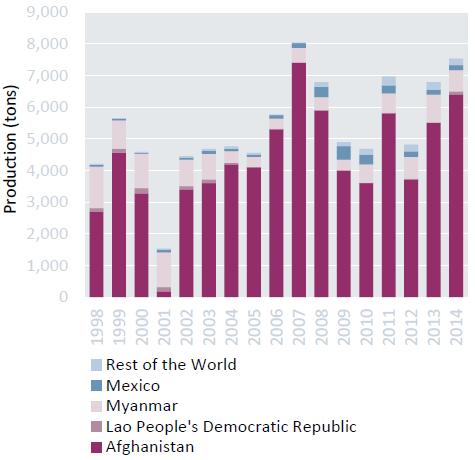
According to the limited information available, global prevalence of the use of opioids (0.7 per cent of the world's adult population, or 32.4 million users) and the use of opiates (0.4 per cent, or 16.5 million users worldwide) has remained stable, whereas global opium poppy cultivation in 2014 reached the highest level since the late 1930s. This was mainly attributable to the fact that opium poppy cultivation reached historically high levels in the main country in which opium poppy is cultivated, Afghanistan, where potential production of opium also continued to increase. Global opium production reached 7,554 tons in 2014, also the second highest level since the late 1930s, though global seizures of opium, heroin and illicit morphine decreased by 6.4 per cent from 2012 to 2013.
Global potential opium production, 1998-2014

Click to enlargeSource: Period 1997-2002: UNODC; since 2003: national illicit crop monitoring system supported by UNODC.
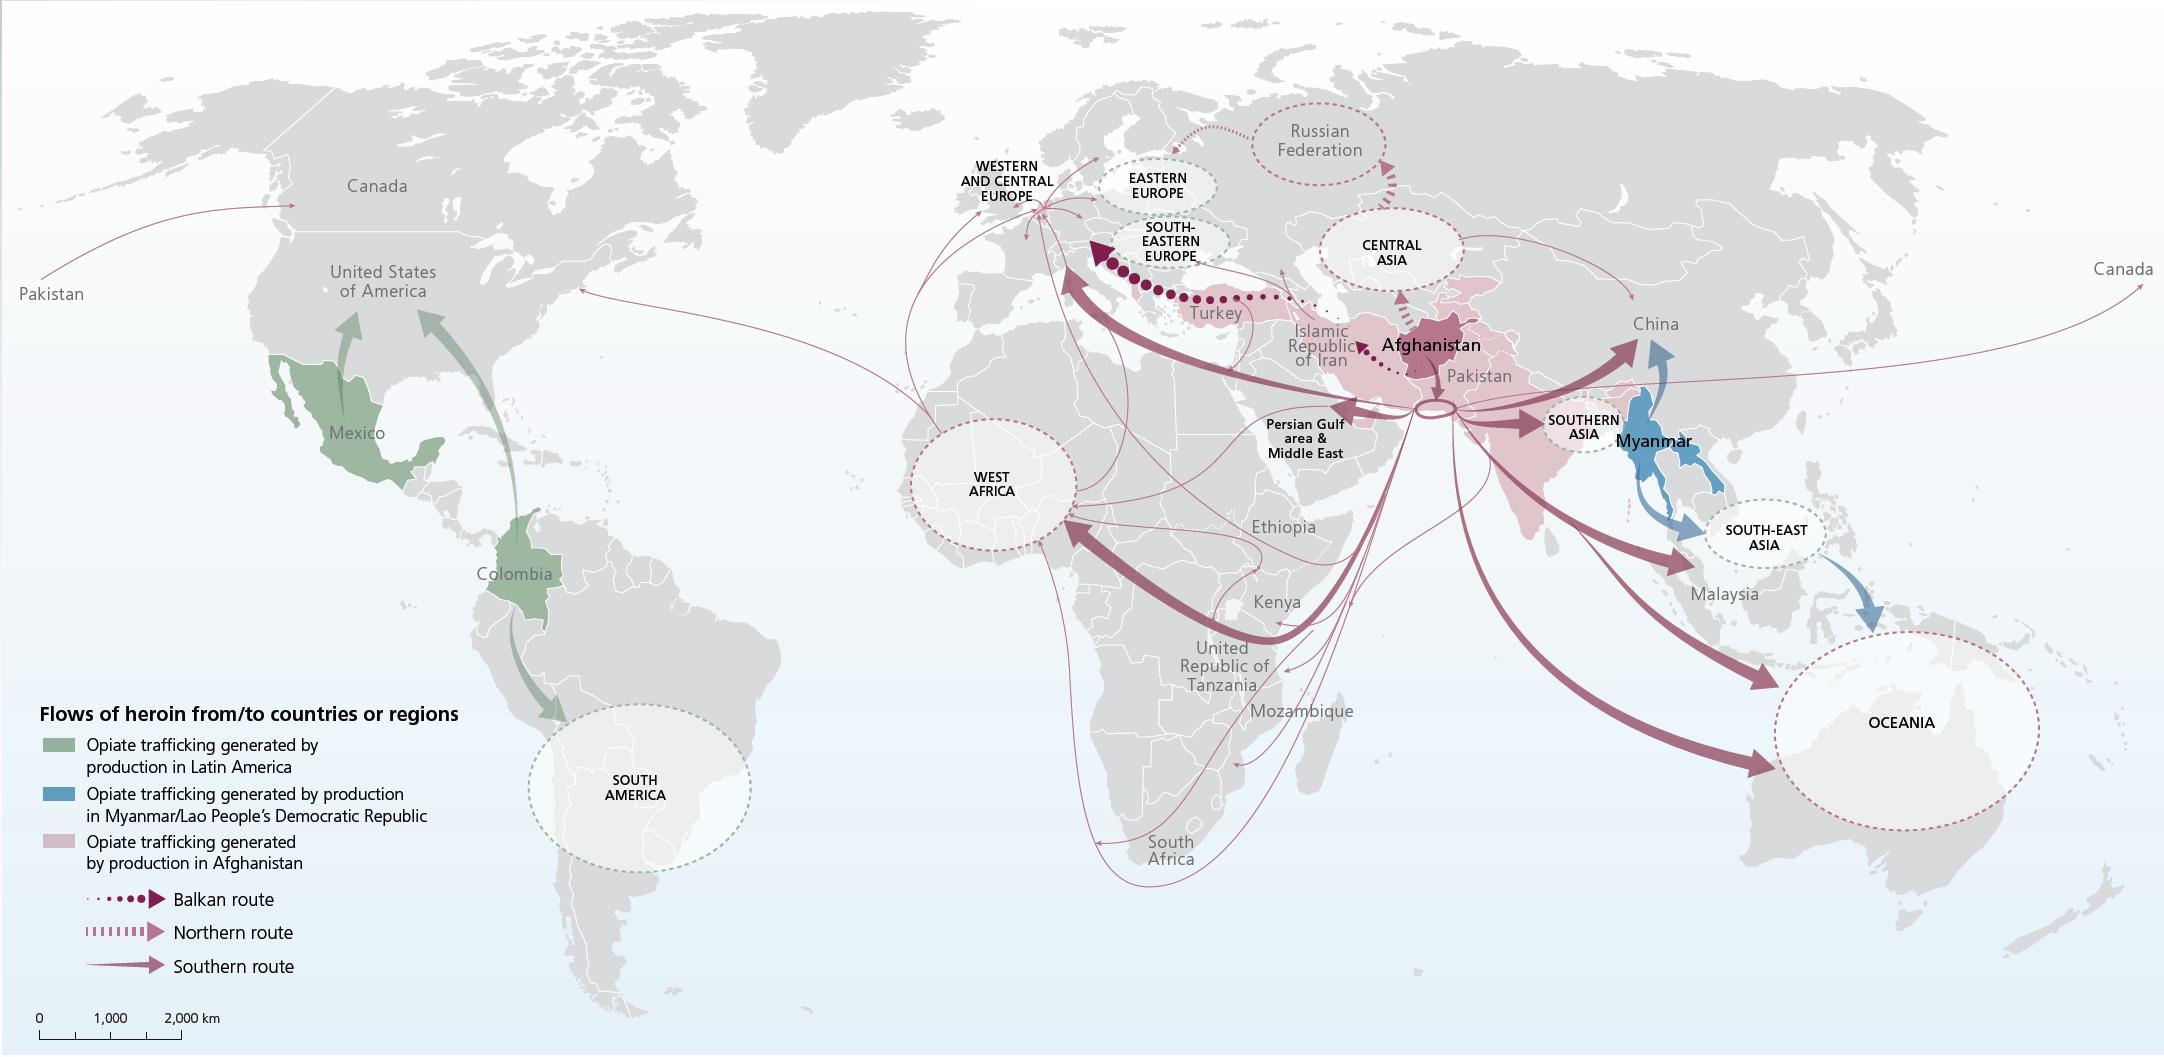
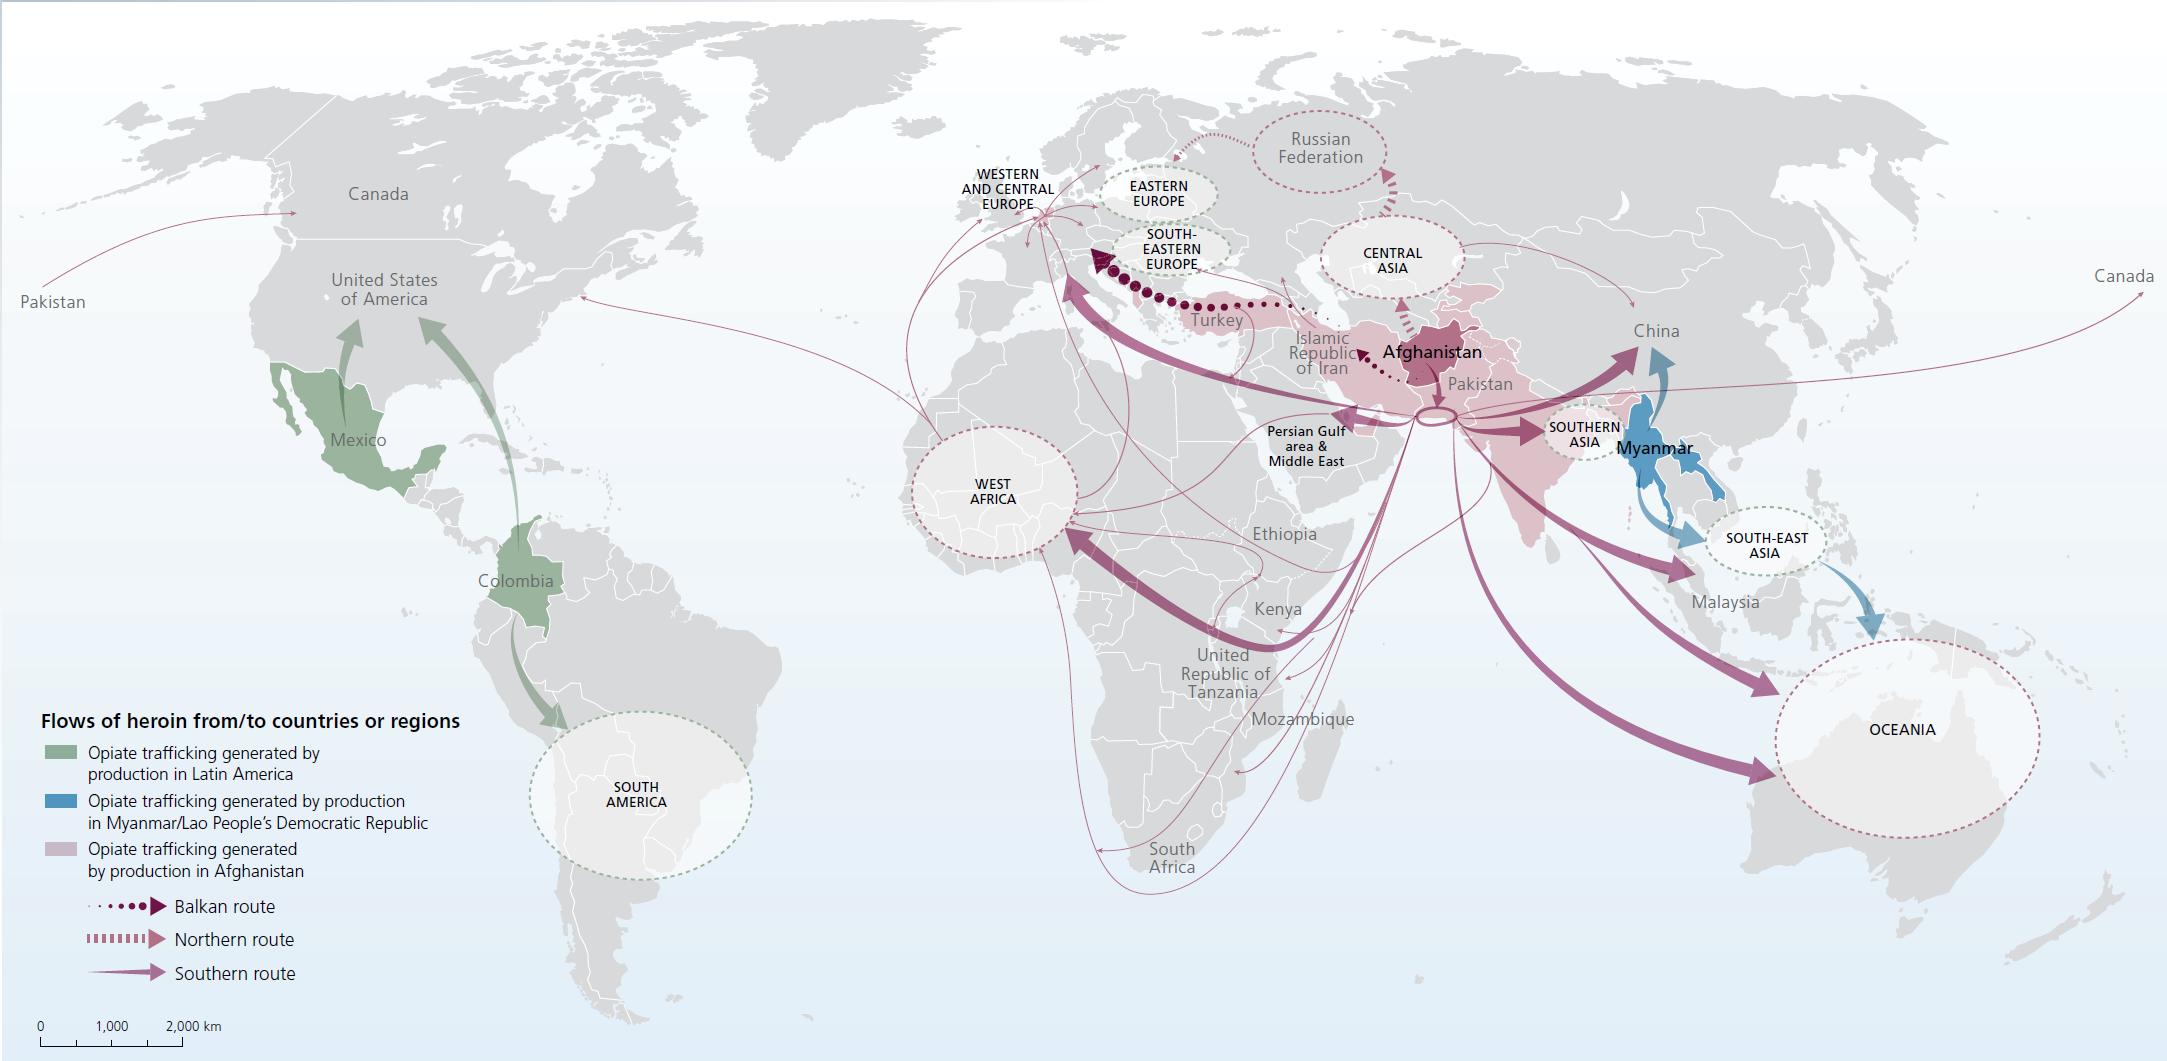
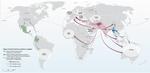
Main global trafficking flows of opiates
Click to enlargeSources: UNODC, responses to annual report questionnaire and individualdrug seizure database.
Notes: The trafficking routes represented on this map should be considered broadly indicative and based on data analyses rather than definitive route outlines. Such analyses are based on data related to official drug seizures along the trafficking route as well as official country reports and responses to annual report questionnaires. Routes may deviate to other countries that lie along the routes and there are numerous secondary flows that may not be reflected.
The boundaries shown on this map do not imply official endorsement or acceptance by the United Nations. Dashed lines represent undetermined boundaries. The dotted line represents approximately the Line of Control in Jammu and Kashmir agreed upon by India and Pakistan. The final status of Jammu and Kashmir has not yet been agreed upon by the parties. The final boundary between the Sudan and South Sudan has not yet been determined.The increase in estimated opium and heroin production has not yet been reflected in an increase in heroin supply in most regions. The destination of the additional quantities of heroin is unclear, but there are signs of increases in the availability of heroin and in heroin-related indicators such as mortality and medical emergencies in some countries.
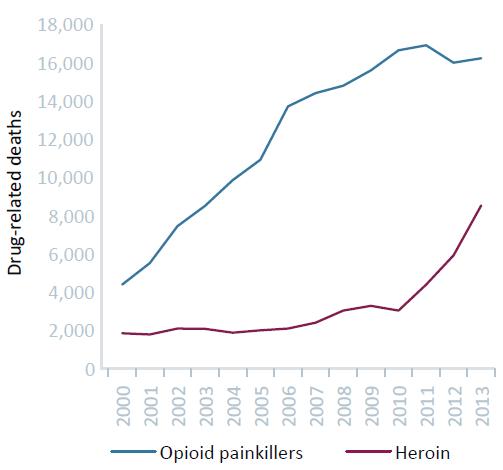
The prevalence of opioid use remains high in North America (3.8 per cent) in relation to the global average. In the United States of America, there are indications of a partial shift in the use of opioids towards heroin use, attributable in part to changes in the formulation of OxyContin, one of the main prescription opioids that are misused, as well as an increase in the availability of heroin and a decrease in its price in some parts of the country. With the number of heroin-related deaths increasing considerably (from 5,925 in 2012 to 8,257 in 2013), reaching the highest level in a decade, the number of drug-related deaths continues to rise in the United States.
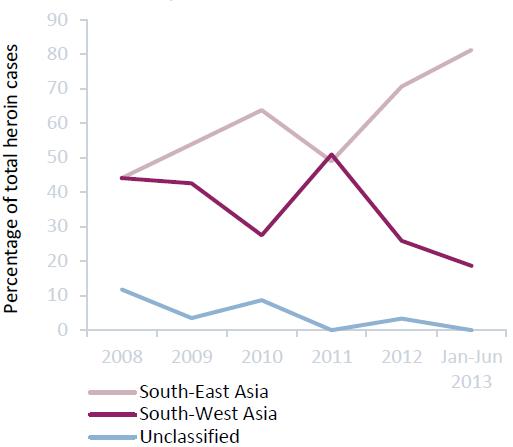
There are signs of change in the supply of heroin in different regions. In North America, although 90 per cent of the heroin in Canada originates in Afghanistan, the United States continues to be supplied by heroin manufactured in Central and South America. However, analysis of seizures indicates that while Afghan heroin currently accounts for relatively little of the heroin seized in the United States, this may be changing. In Oceania, there have been fluctuations in the Australian market between the supply of Afghan heroin and heroin originating in the Lao People's Democratic Republic or Myanmar, but it seems that in 2013 the latter was predominant. This underlines the fact that the reach of organized criminal networks continues to be global and that organized criminal groups are becoming increasingly sophisticated and versatile.
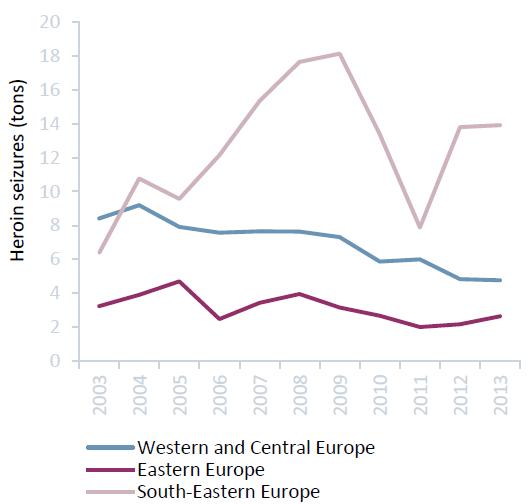
In Europe, the heroin market is also marked by variations, albeit at the subregional level. There are indications of a stable or downward trend in the use of heroin in Western and Central Europe, while heroin seizures have recently increased in Eastern and South-Eastern Europe, where the absence of new data prevents the assessment of recent trends in the prevalence of drug use.
In the absence of any recent reliable data on the extent of the use of opioids in most parts of Asia, it is difficult to determine a trend, but the use of opioids is generally considered to be stable. Asia remains the world's largest market for opiates, accounting for an estimated two thirds of all users of opiates, and the total number of registered heroin users in China is increasing. Data on Africa remain limited, but it is likely that the increasing importance of the region as a transit area for Afghan heroin bound for markets in other regions has had an impact on the use of opiates in Africa.
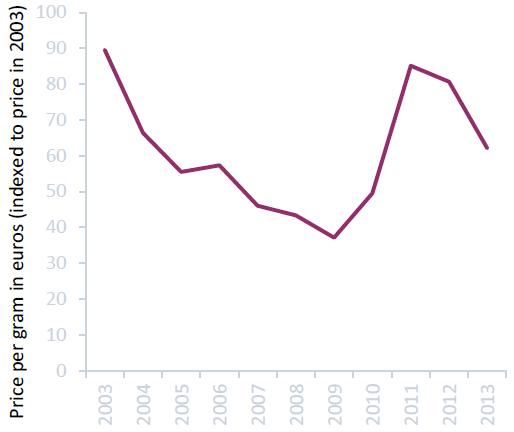
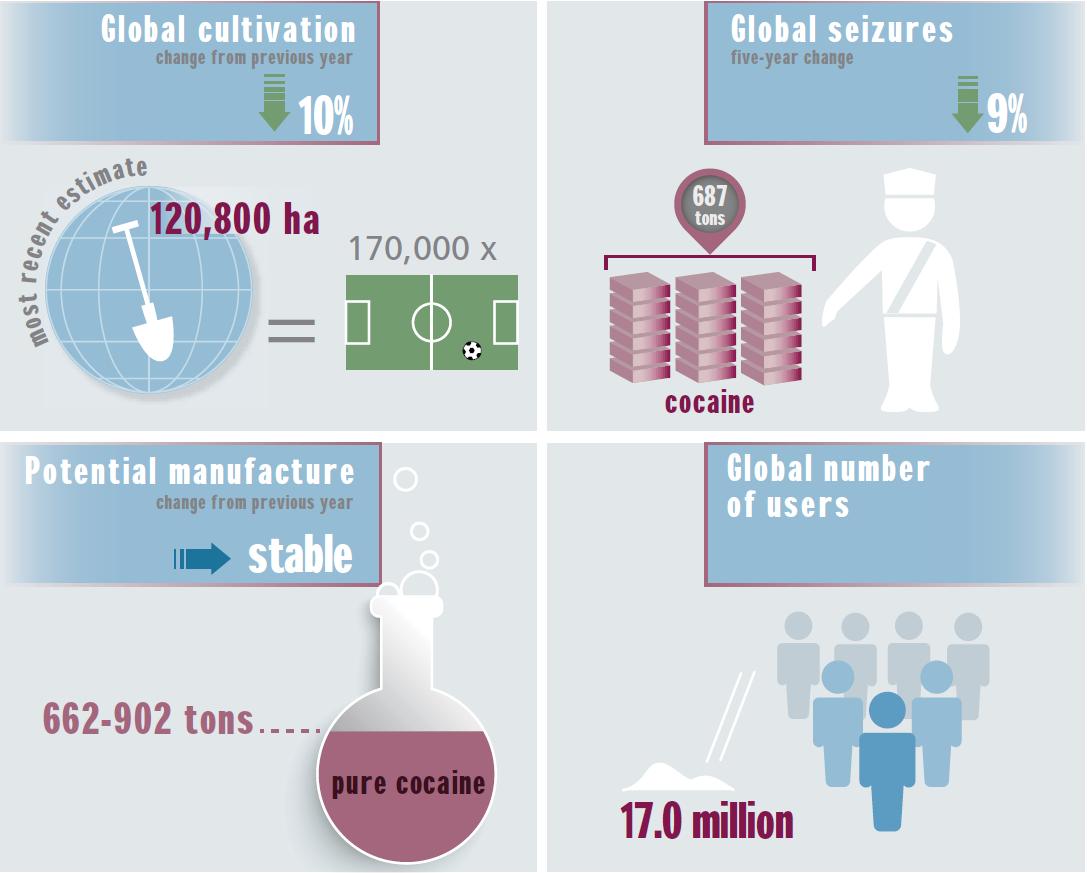
Cocaine
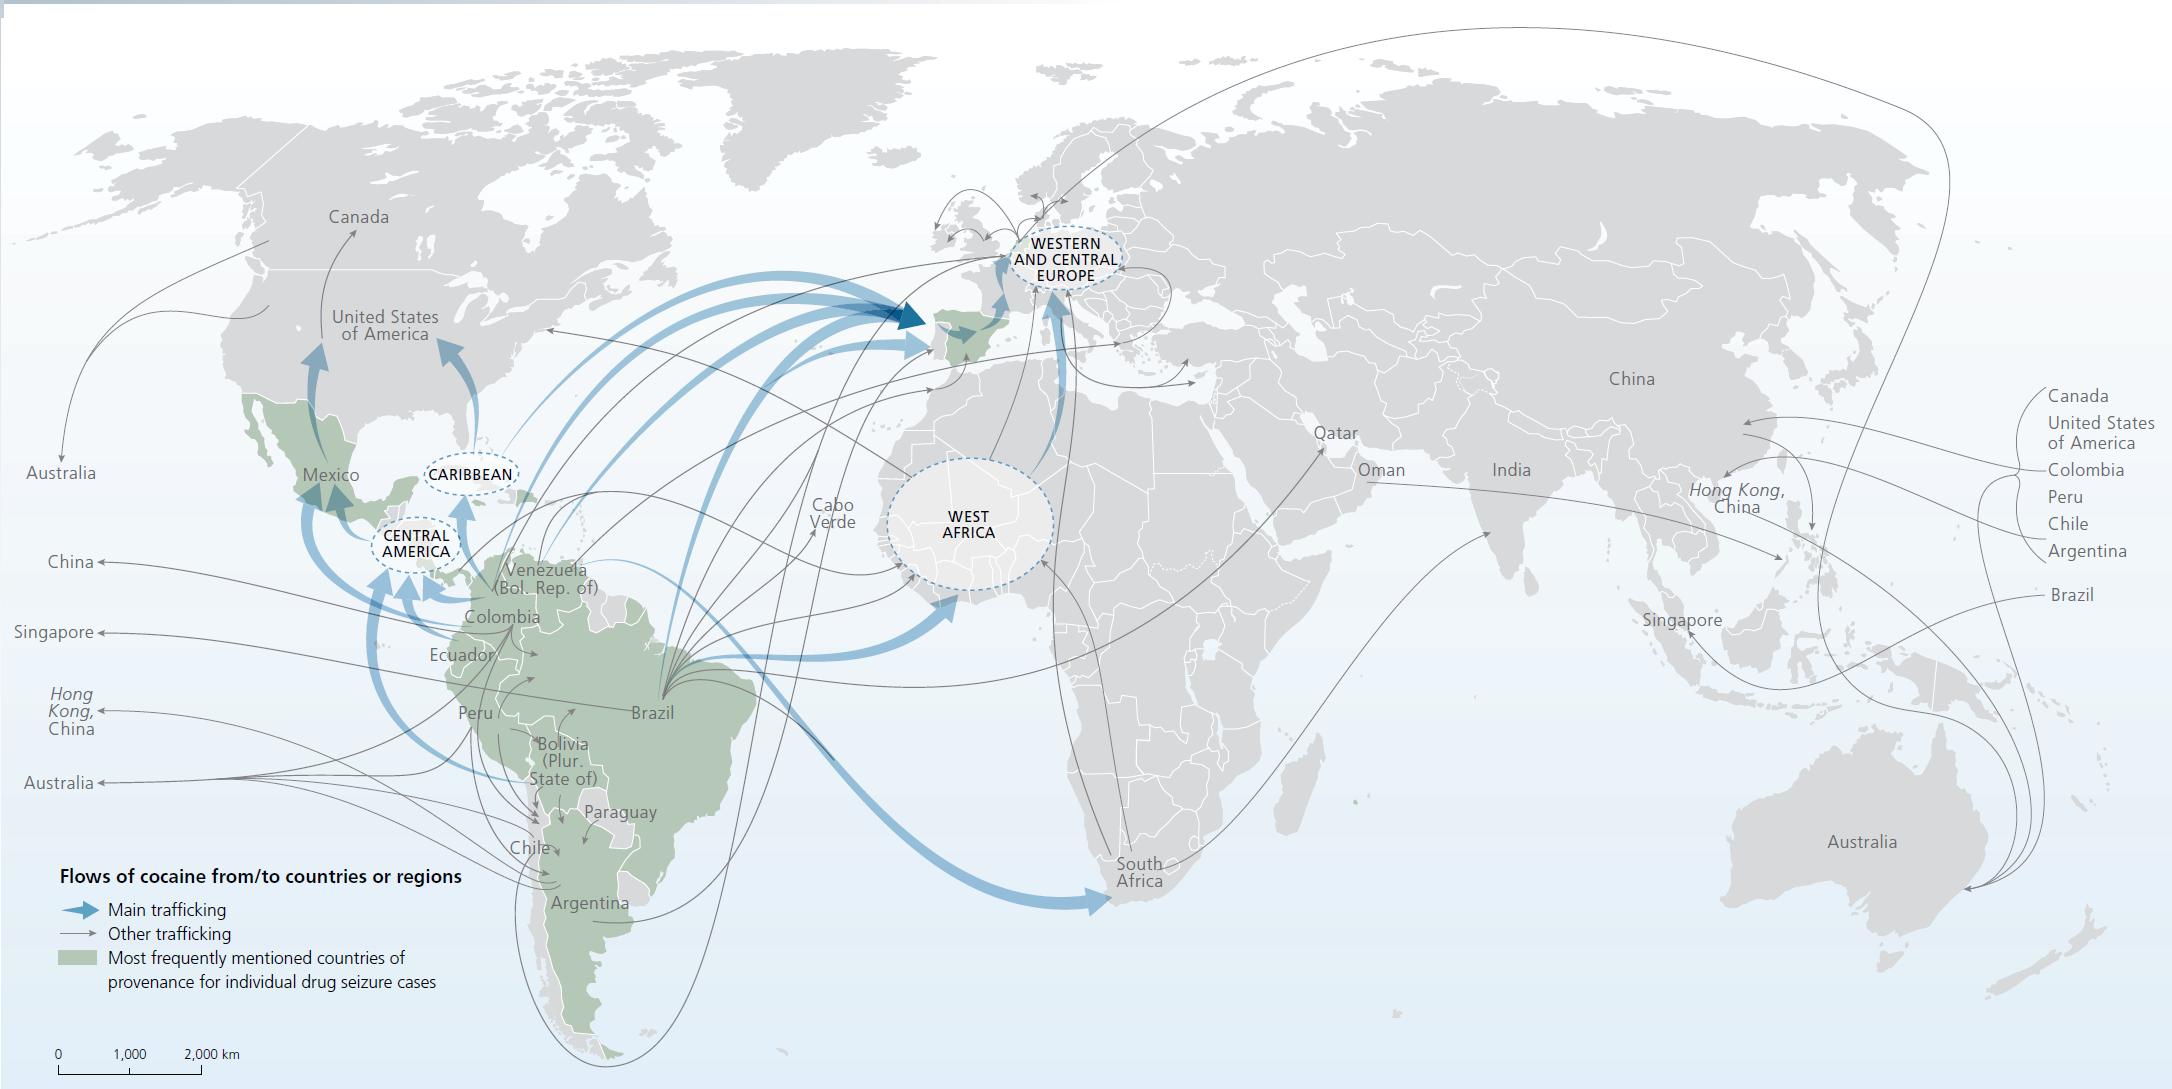
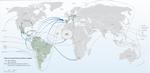
Main global trafficking flows of cocaine
Click to enlargeSource: UNODC, responses to annual report questionnaire and individual drug seizure database.
Notes: The trafficking routes represented on this map should be considered broadly indicative and based on data analyses rather than definitive route outlines. Such analyses are based on data related to official drug seizures along the trafficking routes as well as official country reports and responses to annual report questionnaires. Routes may deviate to other countries that lie along the routes and there are numerous secondary flows that may not be reflected.
The boundaries shown on this map do not imply official endorsement or acceptance by the United Nations. Dashed lines represent undetermined boundaries. The dotted line represents approximately the Line of Control in Jammu and Kashmir agreed upon by India and Pakistan. The final status of Jammu and Kashmir has not yet been agreed upon by the parties. The final boundary between the Sudan and South Sudan has not yet been determined.Not only did coca bush cultivation continue to decline in 2013, reaching the lowest level since the mid-1980s, when estimates first became available, but the annual prevalence of cocaine use (0.4 per cent of the adult population) also continued to decline in Western and Central Europe and North America. In those subregions, which, along with South America, have the world's largest cocaine markets, the prevalence of cocaine use is highest. Supply reduction measures may have contributed to the decline in coca bush cultivation in the coca-producing countries, leading to a reduction in the availability of cocaine and the shrinking of some of the principal cocaine markets.
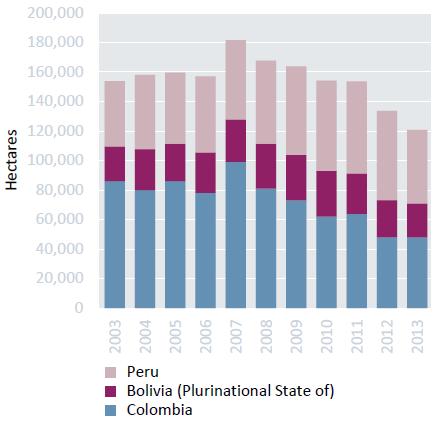
Coca bush cultivation, 2003-2013
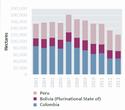
Click to enlargeSource: UNODC, responses to annual report questionnaire and other official sources.
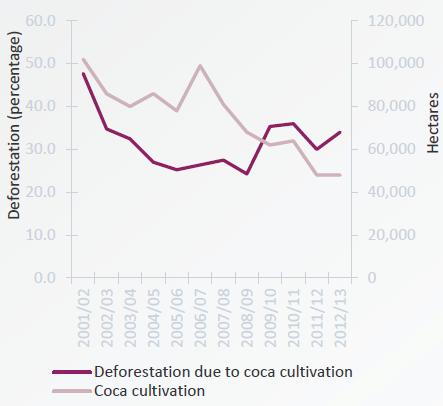
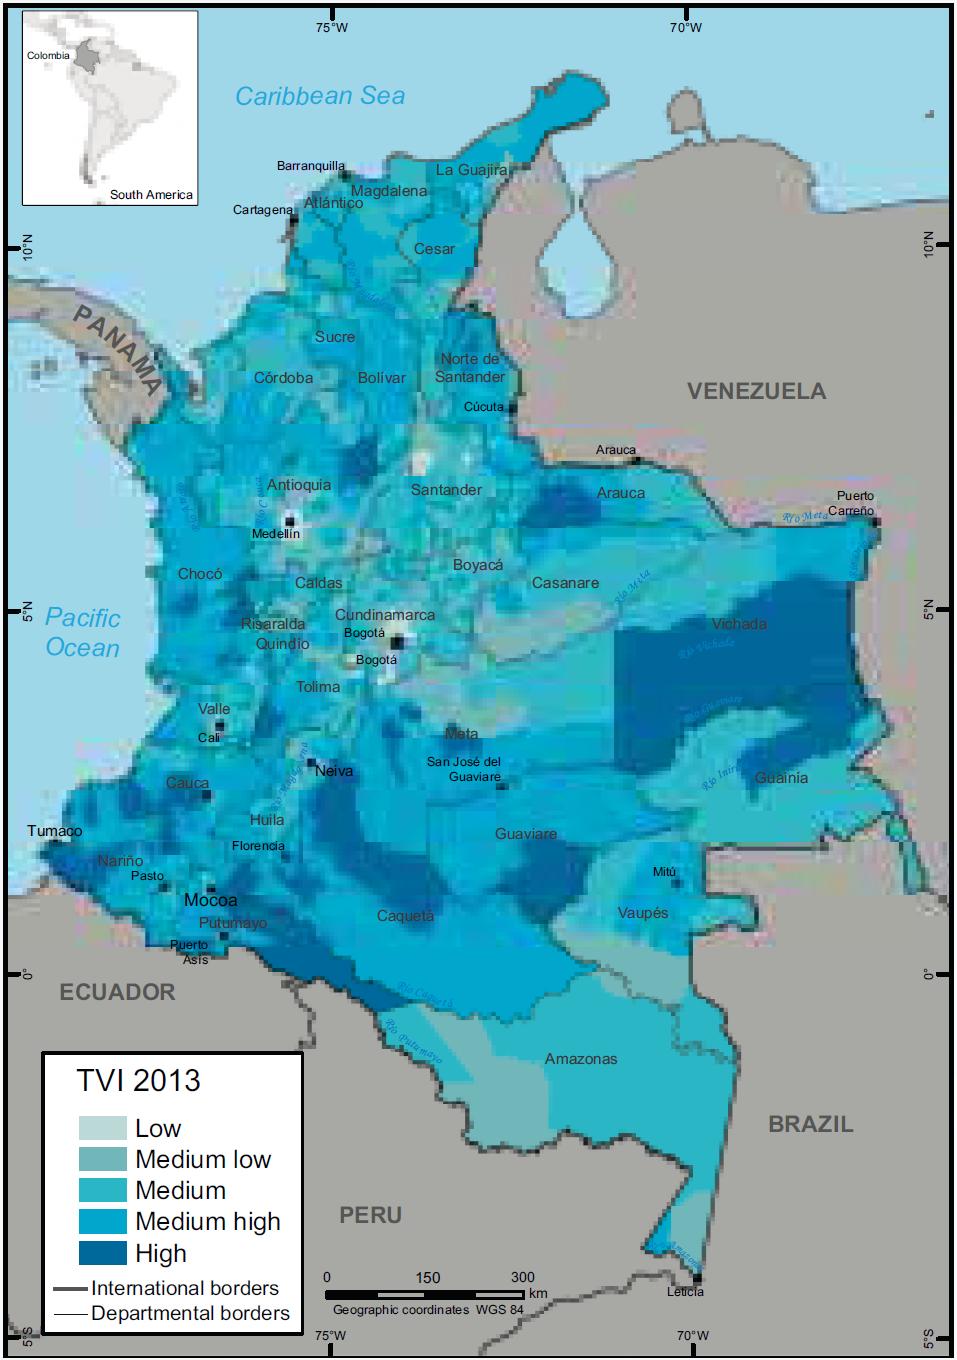
In addition to the human cost of cocaine manufacture and trafficking, illicit coca bush cultivation and the transformation of coca into cocaine continue to cause serious environmental damage even though coca bush cultivation has decreased. In Colombia alone, roughly 290,000 hectares of forest were lost as a direct result of coca crop cultivation between 2001 and 2013, while the slash-and-burn method used to clear new plots has led to increased erosion. Further environmental damage has been caused by the herbicides and fertilizers used in coca bush cultivation and the chemicals employed in the transformation of coca into cocaine.
Cannabis
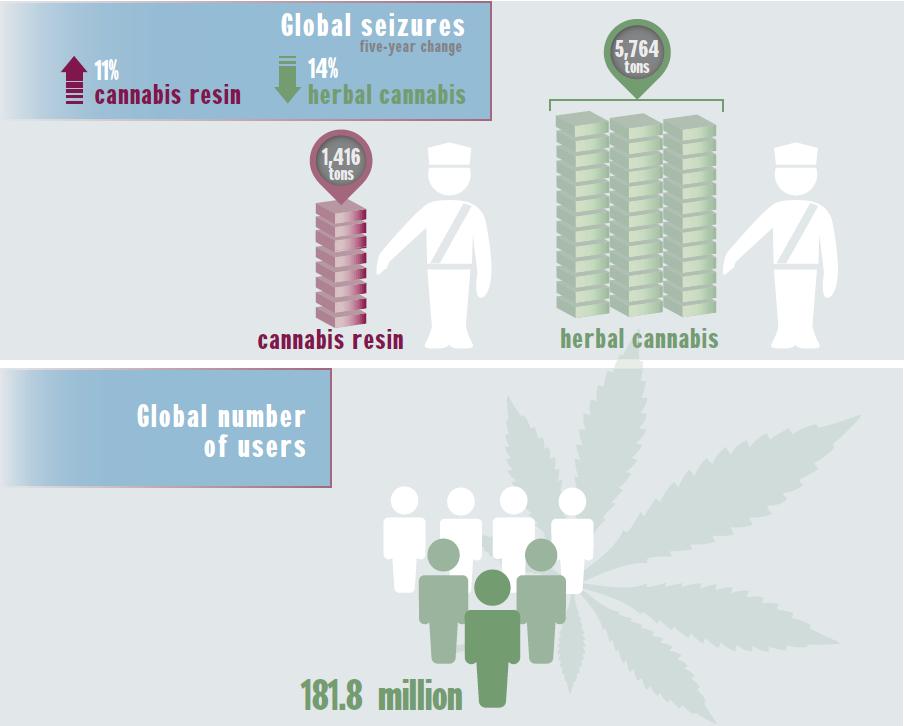
Cannabis use is increasing and continues to be high in West and Central Africa, Western and Central Europe and Oceania, as well as in North America, where the most recent data available indicate an increase in the prevalence of cannabis use in the United States. Europe is still one of the world's largest markets for cannabis resin, but its use is concentrated in a few countries. The use of cannabis herb is more evenly spread across European countries, and the market in Western and Central Europe is shifting from cannabis resin to cannabis herb.
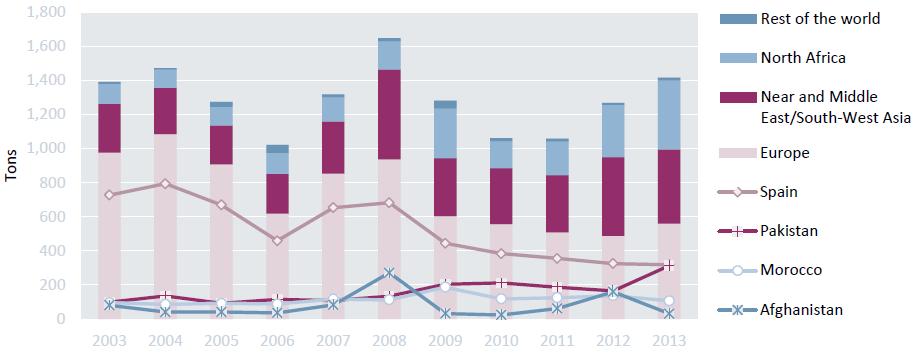
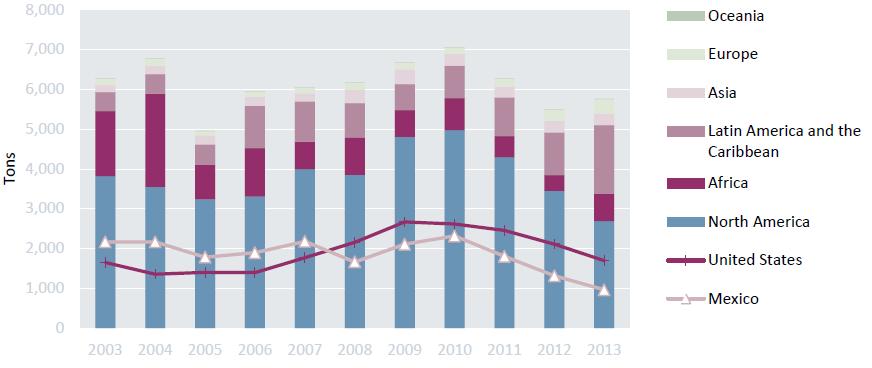
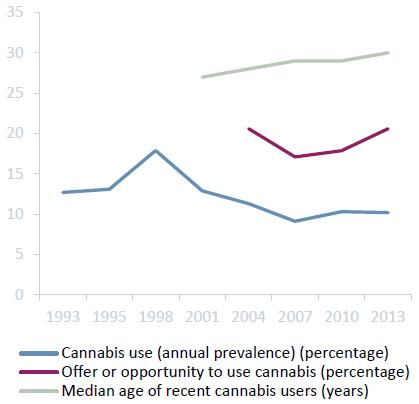
Advances in cannabis plant cultivation techniques and the use of genetically selected strains have led to an increase in the number of cannabis harvests, as well as in the yield and potency of cannabis. The potency of cannabis, commonly measured in terms of the concentration of THC (Δ9-tetrahydrocannabinol, the main psychoactive ingredient in cannabis), has been increasing in many markets over the past decade, leading to growing concern about the potential of cannabis to cause serious health problems. Despite the fact that increasing professionalism and sophistication have enhanced the capacity of cannabis plant growers to avoid detection by law enforcement authorities, data for 2013 show an increase in the quantities of cannabis herb and cannabis resin seized worldwide.
Synthetic drugs: amphetamine-type stimulants and new psychoactive substances
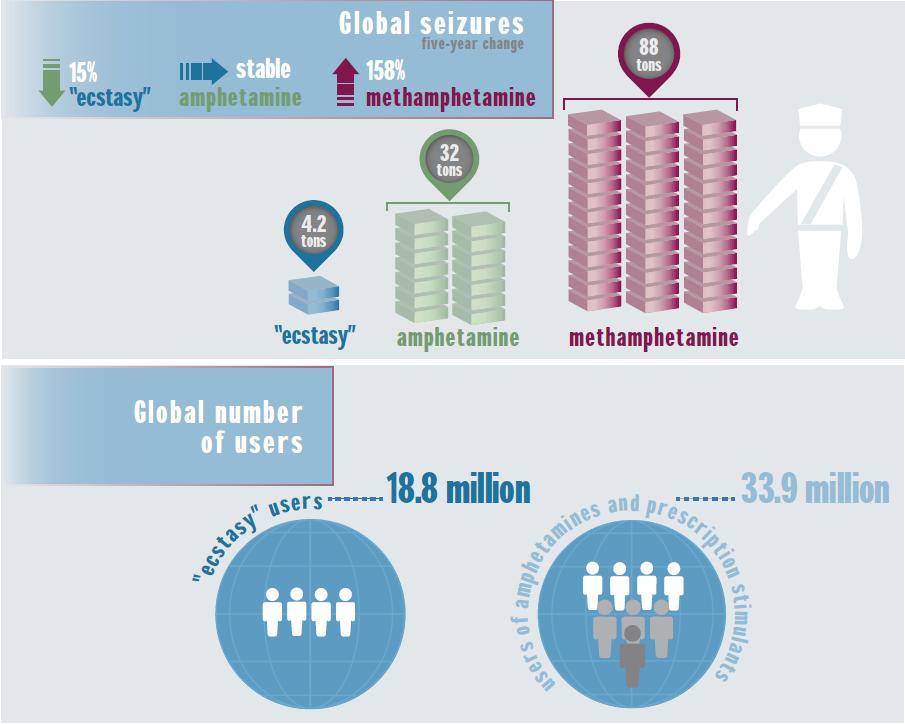
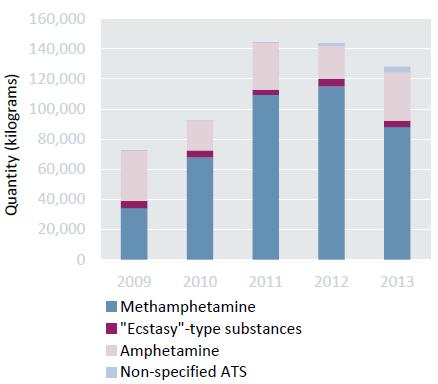
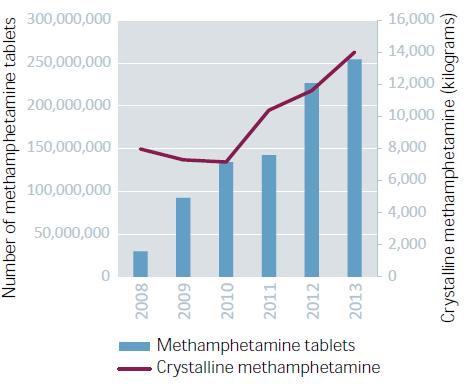
The global market for synthetic drugs continues to be dominated by methamphetamine. The increasingly diversified market for methamphetamine is expanding in East and South-East Asia, where it accounts for a large share of the people receiving treatment for drug use in a number of countries, and use of crystalline methamphetamine is increasing in parts of North America and Europe. Surging seizures since 2009 also point to a rapid expansion in the global ATS market, with the total quantity of seized ATS almost doubling to reach over 144 tons in 2011 and 2012, the highest level since the United Nations Office on Drugs and Crime (UNODC) began systematic monitoring, and remaining at a comparatively high level in 2013.
Methamphetamine flows as perceived by recipient countries, 2011-2013
Click to enlargeSource: UNODC, responses to annual report questionnaire, 2011-2013.
Note: The origins of the flow arrows do not necessarily indicate the source/manufacture of methamphetamine. These arrows represent the flows as perceived by recipient countries. Flow arrows represent the direction of methamphetamine trafficking and are not an indication of the quantity trafficked.
The boundaries shown on this map do not imply official endorsement or acceptance by the United Nations. Dashed lines represent undetermined boundaries. The dotted line represents approximately the Line of Control in Jammu and Kashmir agreed upon by India and Pakistan. The final status of Jammu and Kashmir has not yet been agreed upon by the parties. The final boundary between the Sudan and South Sudan has not yet been determined.
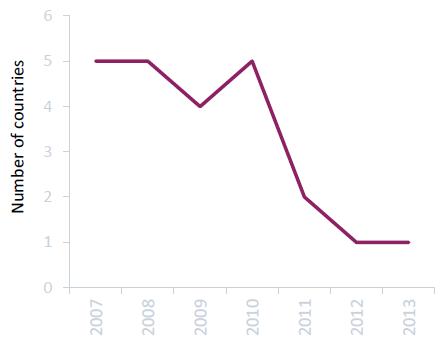
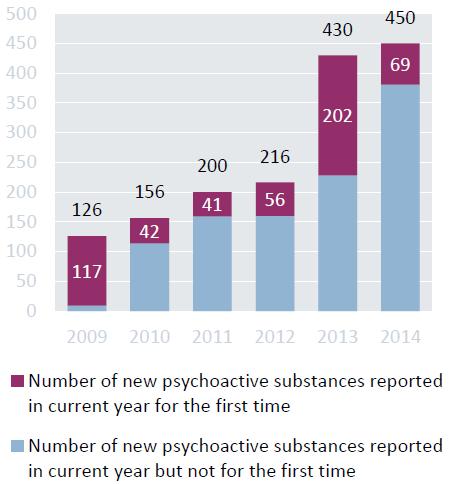
Number of new psychoactive substances reported, 2009-2014
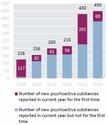
Click to enlargeSource: UNODC, early warning advisory on NPS, 2009-2014.
Note: This graph represents only the number of different NPS reported during the respective reporting year. Not all NPS reported in one year were necessarily reported in the following year(s).
According to seizure data, the global "ecstasy" market is smaller than the global market for amphetamine and methamphetamine and remains confined to a few regions. East and South-East Asia and Oceania may be emerging as a driver of the global market for "ecstasy", while the market seems to be on the decline in the Americas, where "ecstasy" seizures dropped by 81 per cent between 2009 and 2012. The largest "ecstasy" markets continue to be East and South-East Asia and Oceania, although seizures of "ecstasy" declined there in 2013.
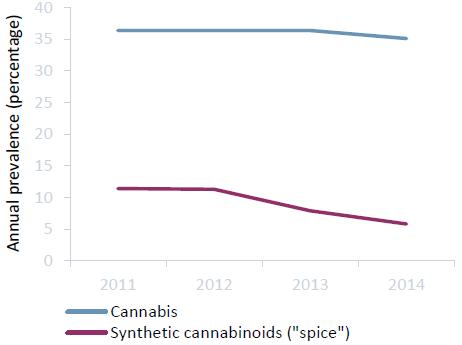
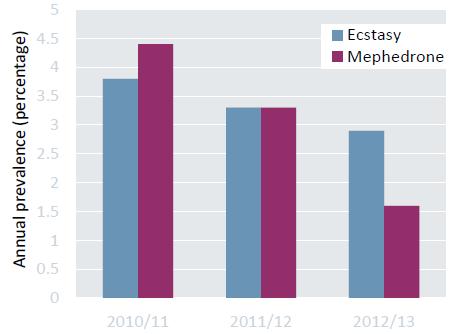
The "ecstasy" market has been on the decline in several European countries for some time, with mephedrone and other NPS perhaps serving as a substitute. The use of mephedrone and synthetic cannabinoids may have declined in some markets in recent years, but a growing number of countries have reported a wider range of emerging NPS, as well as worrying developments such as the injecting use of NPS. There continue to be limited data on recent developments in injecting drug use and polydrug use involving NPS; these particular forms of drug use could pose a serious challenge for providers of treatment for drug use and health-care providers.
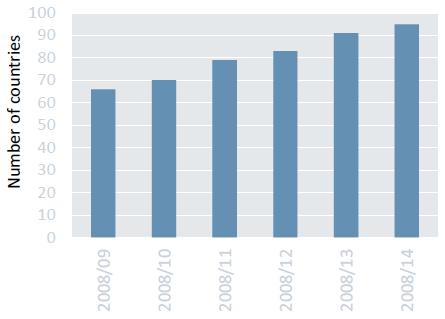
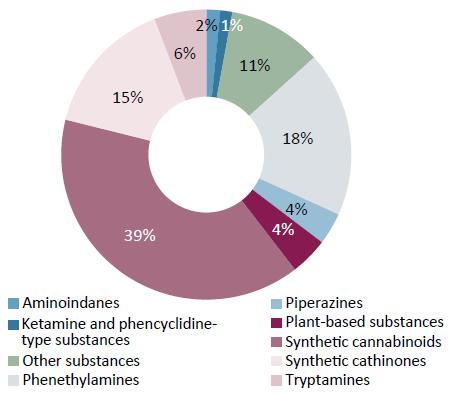
The sheer number, diversity and transient nature of NPS currently on the market partly explain why there are still only limited data available on the prevalence of use of many NPS. Those difficulties also explain why both the regulation of NPS and the capacity to address health problems related to NPS continue to be challenging. Different countries report that NPS continue to proliferate in the marketplace, in terms of both quantity and diversity. By December 2014, a total of 541 NPS had been reported by 95 countries and territories to the UNODC early warning advisory. Synthetic cannabinoids continued to account for the majority of NPS reported in 2014 (39 per cent); they were followed by phenethylamines (18 per cent) and synthetic cathinones (15 per cent). The growing number of NPS available worldwide indicates that the market for synthetic drugs is becoming even more diversified.
ALTERNATIVE DEVELOPMENT
Illicit crop cultivation: breaking the vicious cycle
Illicit crop cultivation is driven by situation-specific combinations of vulnerability and opportunity factors. As survival and subsistence are real considerations for many households that engage in illicit crop cultivation, they are frequently risk-averse and take into account a variety of factors when making decisions on such cultivation.
One of those factors is the specific nature of the illicit crops — agronomic aspects, durability of the product, price, ease of sale, etc. All major illicit crops are particularly attractive because they produce quick returns from non-perishable products. Illicit crop cultivation can thus provide farmers with the necessary short-term economic means to survive, but it does not allow the area to develop its licit economy and institutional environment.
Other factors include geographical and environmental factors, such as climate, the availability of water and arable land, and proximity to market; household-specific socioeconomic factors, such as level of income, existing employment opportunities, access to credit and size of landholding; developmental facilities such as access to roads, the power grid and educational and health services; and sociopolitical and institutional factors, such as security, government control and rule of law. Illicit crop cultivation tends to take place in marginalized, isolated areas characterized by limited government control, unclear land rights, lack of infrastructure, poverty and violence, which are areas where few international development agencies tend to operate.
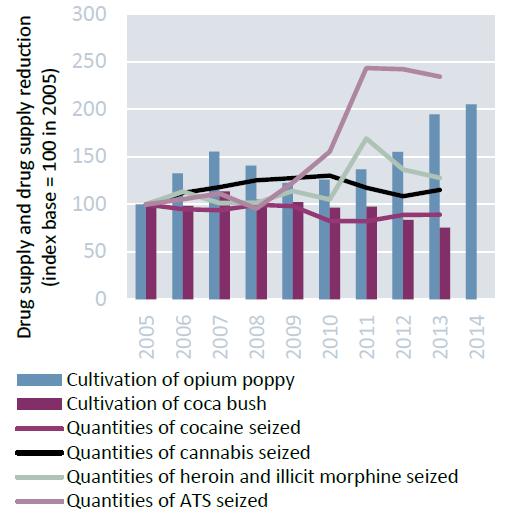
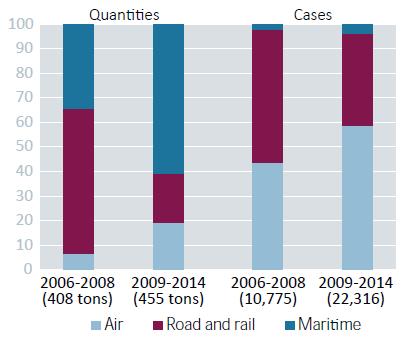
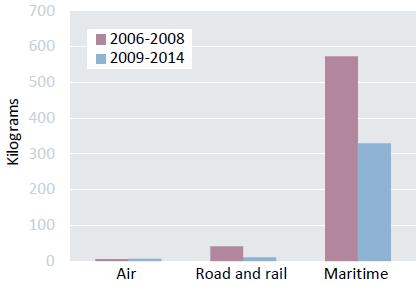
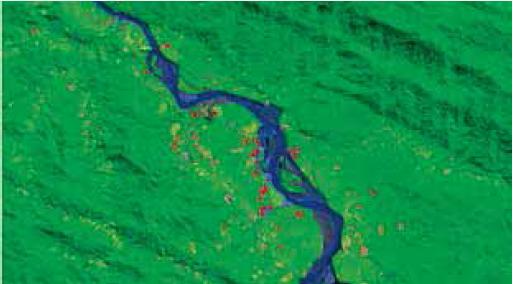
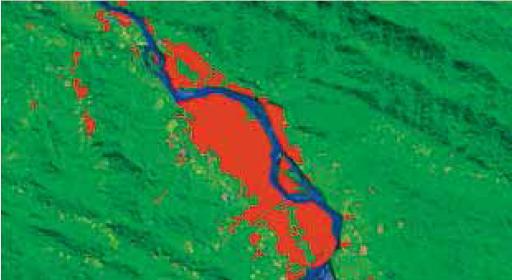
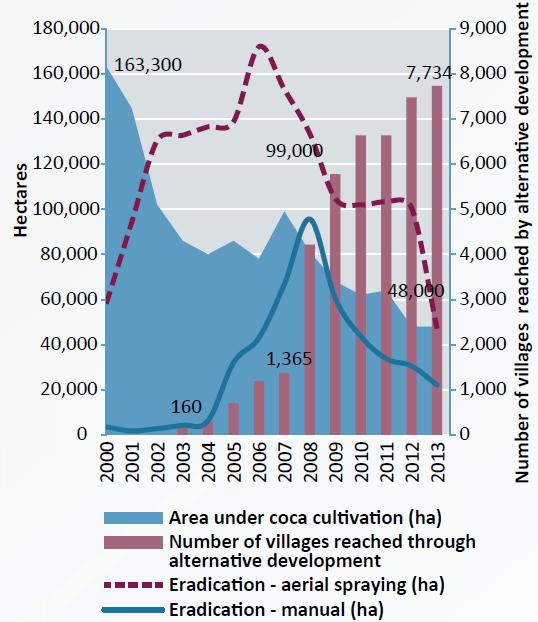
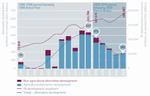
Impact of illicit drug production and of alternative development interventions
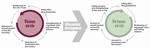
Click to enlargeAlternative development is an approach aimed at reducing the vulnerabilities that lead to involvement in illicit crop cultivation and ultimately eliminating such cultivation. Alternative development can break the vicious cycle of rising illicit drug production, weakening rule of law, decreasing growth of the licit economy, decreasing investment in licit sectors, strengthening organized crime and increasing violence by effectively promoting factors fostering a sustainable licit economy. In the long run, this can attract investment and help to develop the necessary infrastructure, thereby changing and sustaining the livelihood of rural communities.
Alternative development is not generally an objective in itself but rather a means to an end: it is aimed at contributing to an enabling environment for long-term rural development without illicit crop cultivation. Alternative development acts as a catalyst, boosting development in areas with particular challenges related to the illicit drug economy.
The General Assembly at its twentieth special session, held in 1998, defined alternative development as a process to prevent and eliminate illicit crop cultivation "through specifically designed rural development measures in the context of sustained national growth and sustainable development efforts in countries taking action against drugs, recognizing the particular sociocultural characteristics of the target communities and groups". |2| This definition is used at the international level. Different definitions reflecting new strategies and approaches of alternative development have been developed by a wide variety of implementing countries, donors and practitioners.
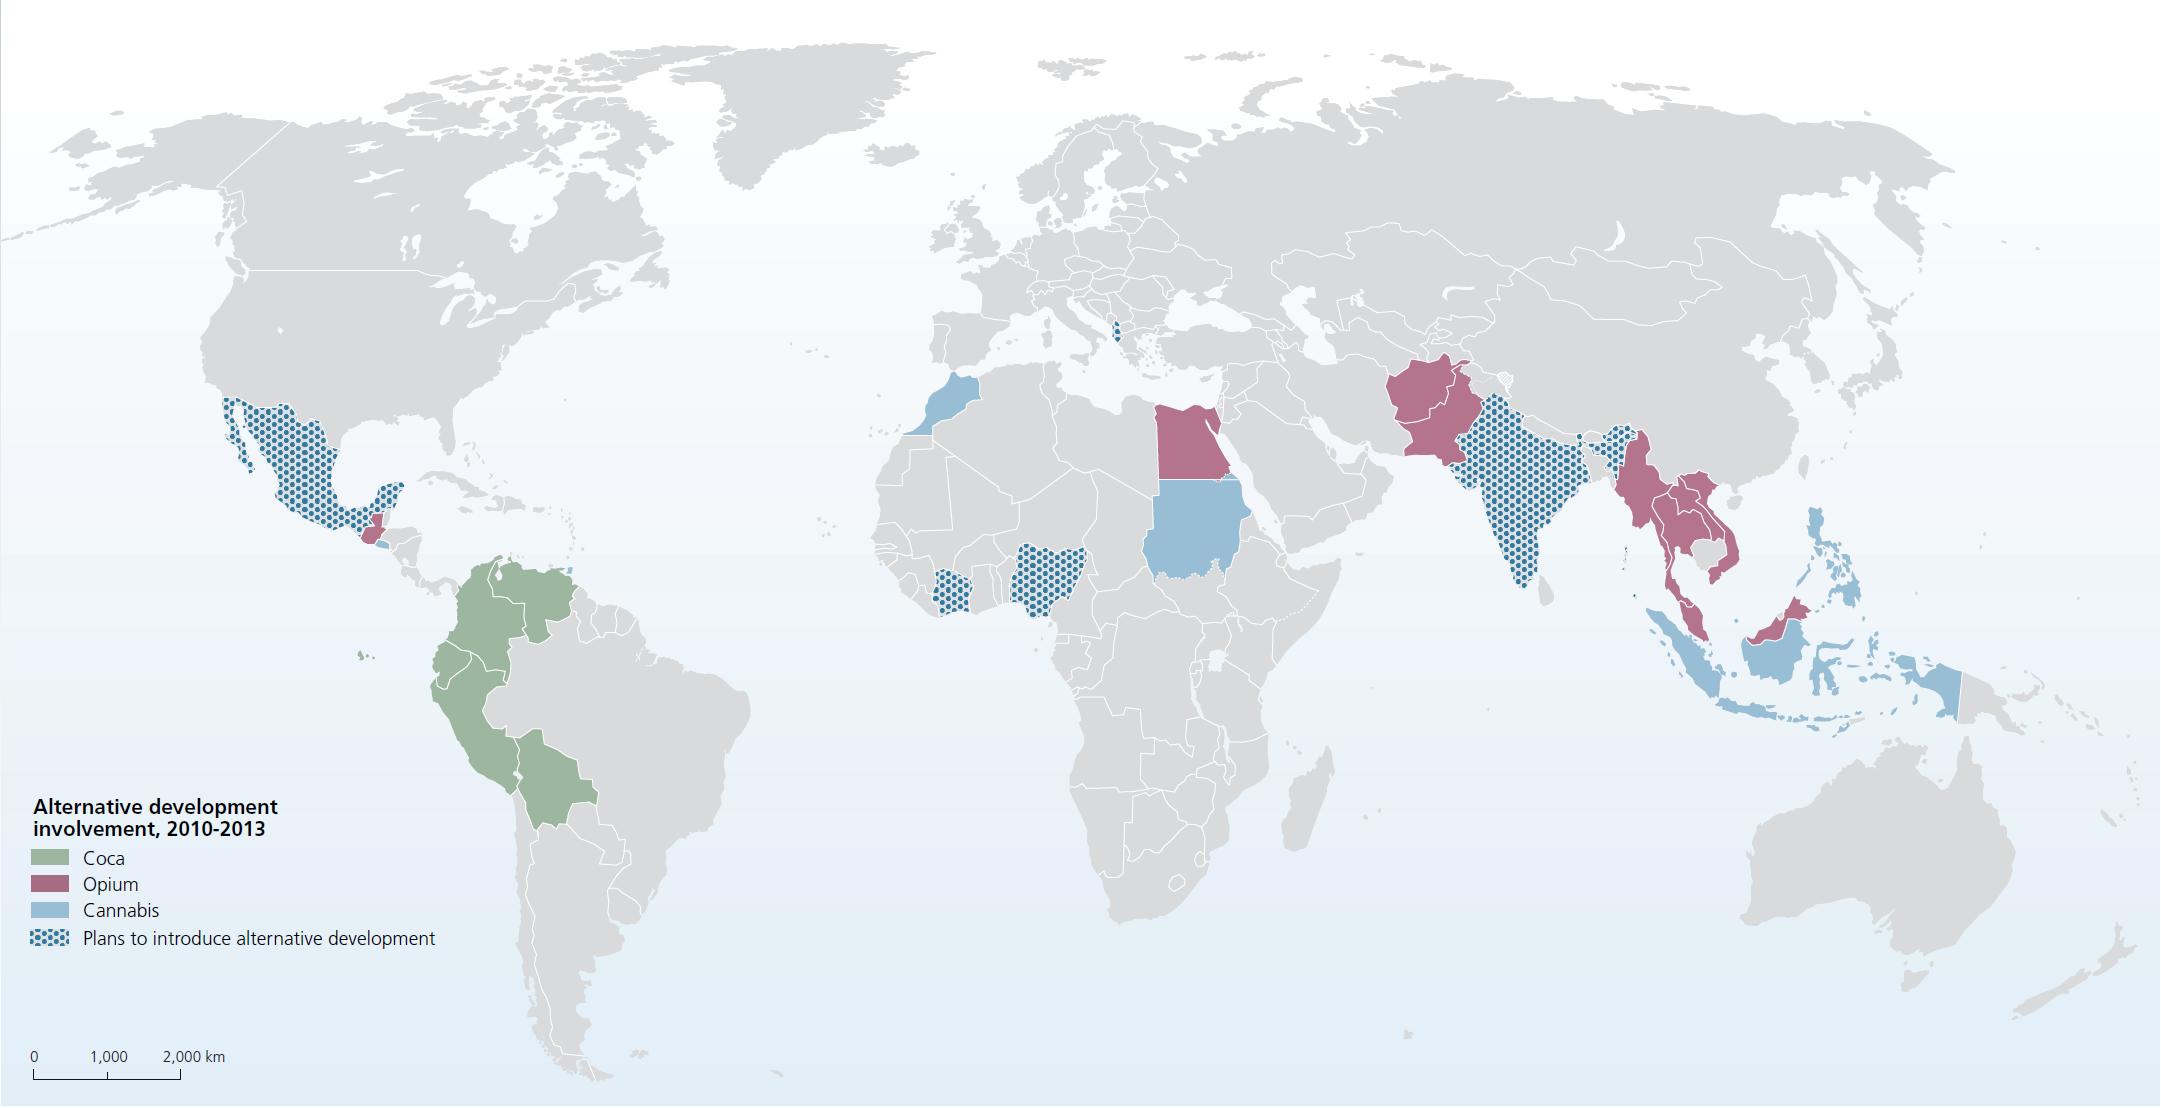
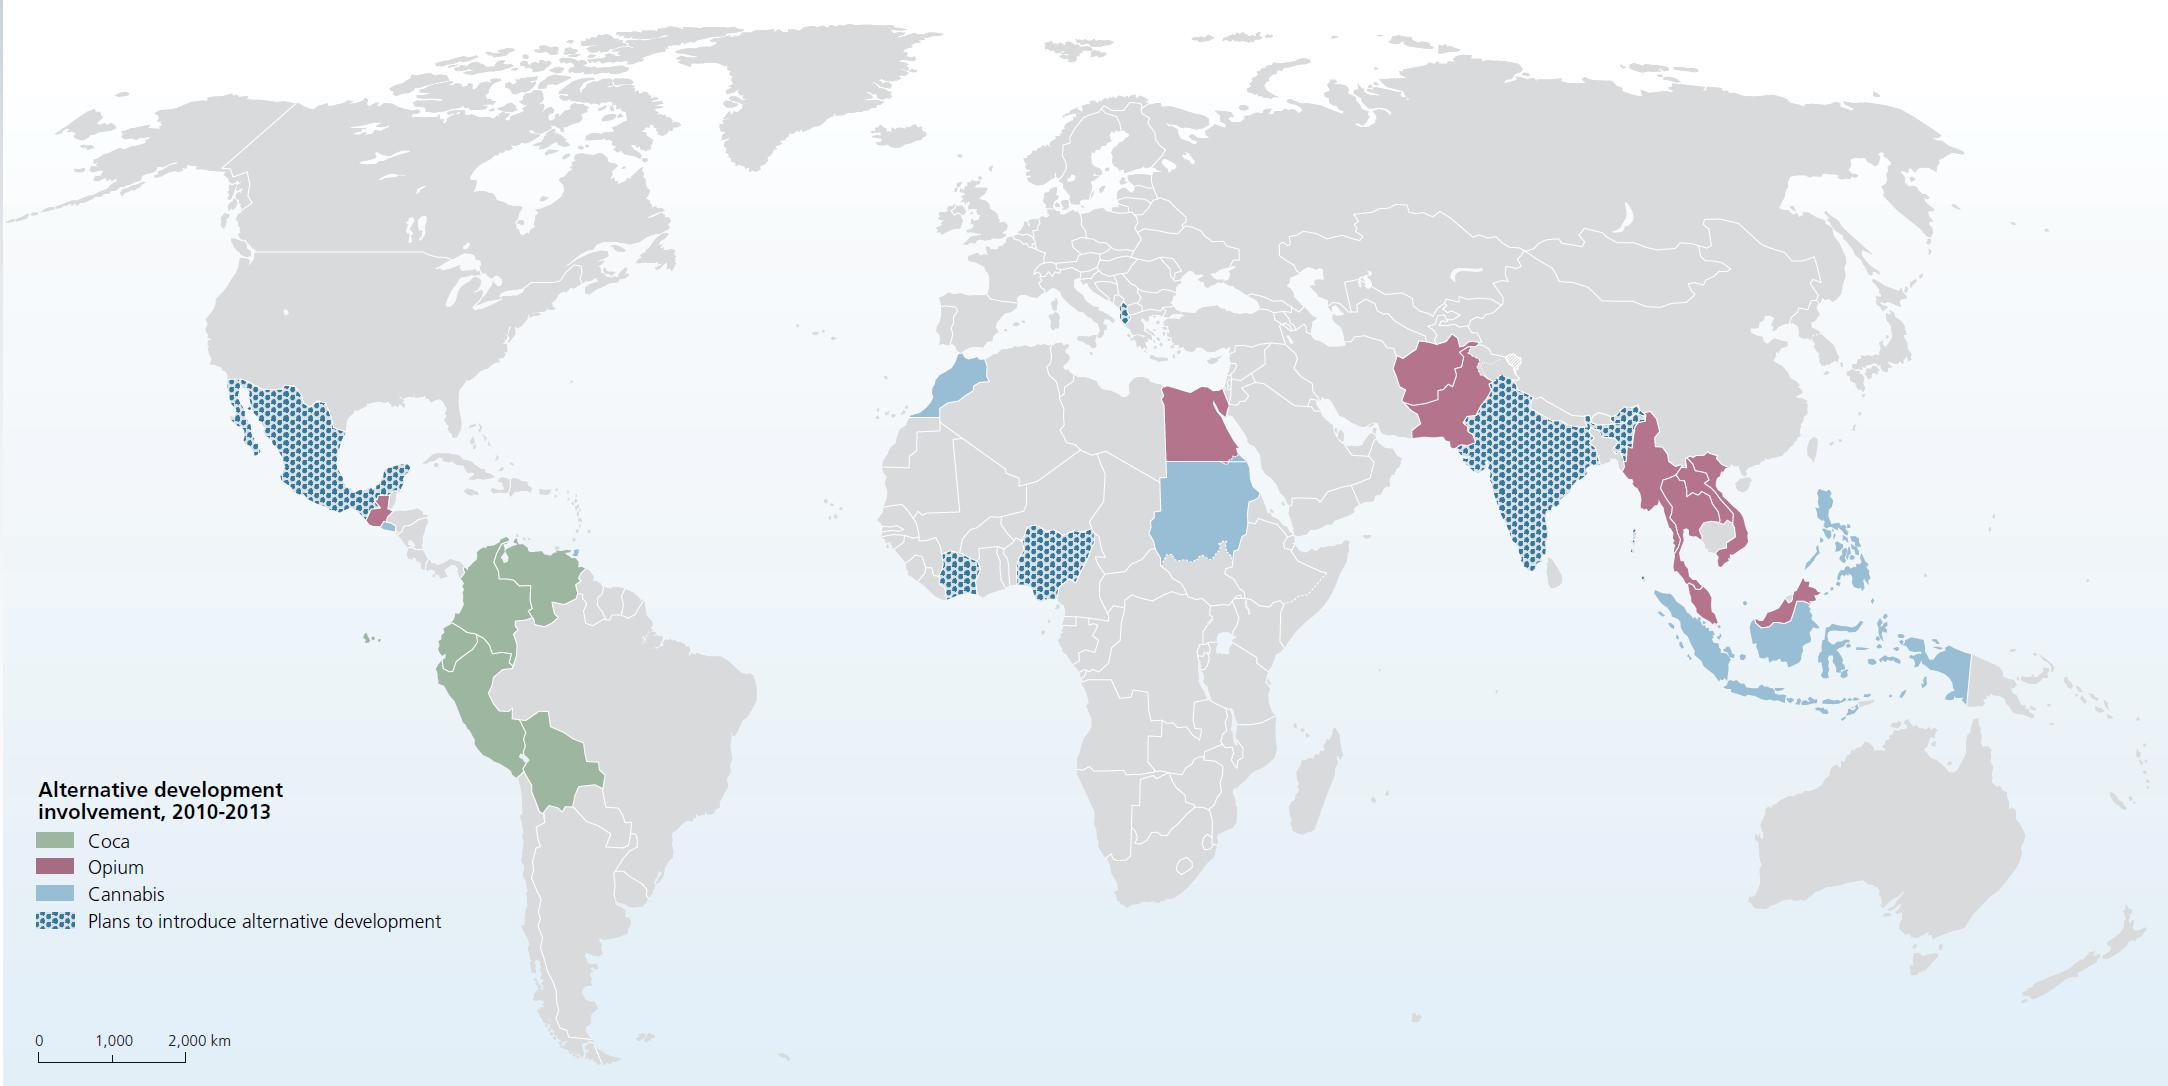
Member States implementing domestic alternative development projects (as reported to the United Nations Office on Drugs and Crime), 2010-2013
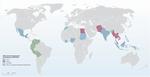
Click to enlargeSources: UNODC annual report questionnaire and UNODC alternative development projects.
Note: Only countries providing sufficient information on the implementation of alternative development projects are included. The boundaries shown on this map do not imply official endorsement or acceptance by the United Nations. Dashed lines represent undetermined boundaries. The dotted line represents approximately the Line of Control in Jammu and Kashmir agreed upon by India and Pakistan. The final status of Jammu and Kashmir has not yet been agreed upon by the parties. The final boundary between the Sudan and South Sudan has not yet been determined.
National strategies or plans employ a balanced approach, complementing alternative development not only with other supply reduction strategies (particularly law enforcement and interdiction), but also with demand reduction strategies (prevention, treatment and rehabilitation). Another commonly integrated strategy — sometimes appearing as a cross-cutting theme or a separate policy — is the promotion of good governance or the strengthening of state institutions or the rule of law.
Where is alternative development implemented?
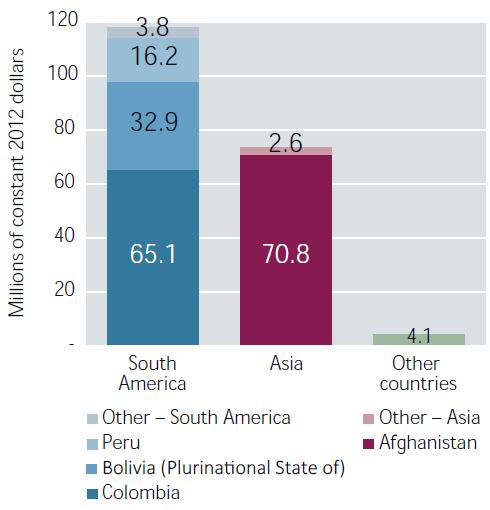
The bulk of alternative development is implemented in all the main coca- and opium-producing countries, as well as in some cannabis-producing countries and some minor opium-producing countries, which are located in South America, Central America, the Caribbean, Asia and Africa. A number of countries in Asia, Central America, Africa and Europe have also reported plans to implement alternative development activities (see map above).
Elements of alternative development
Alternative development is promulgated at the international level, but the evolution of alternative development is driven at the country or even the local level. As the factors that push farmers towards illicit crop cultivation can differ greatly from one country or area to another, the strategic elements of alternative development must be tailored to the particular circumstances on the ground at the local level. No two alternative development projects or interventions are exactly alike, even if they are in the same area, but there are commonalities.
These general strategic elements are often similar and there are commonalities in the overall framework and approach, but the importance of their roles may vary from project to project and some may not feature at all. Success is very situation-specific and there is no manual or blueprint for alternative development. With the adoption of the United Nations Guiding Principles on Alternative Development, |3| there is now a set of general guidelines outlining good practices in planning and implementing alternative development. The major components that feature, to a greater or lesser extent, in most alternative development projects are as follows:
- Income-generating alternatives are at the core of alternative development, as economic necessity tends to play an important role in a farmer's decision on whether to engage in illicit crop cultivation. Income-generating alternatives need to be viable and sustainable in order to decrease dependence on illicit crop cultivation.
- The marketing of products of alternative development is an important component of any project. To enhance marketing options and reduce some of the vulnerabilities related to illicit crop cultivation, alternative development programmes often try to involve the private sector. This approach has enabled products of alternative development to have access to markets not only at the local and national levels, but also at the international level.
- Long-term political and financial support is essential to the success of alternative development. Time is needed not only to address the economic drivers behind illicit crop cultivation, but also to build trust with local communities and to develop long-term investment. Direct participation by farmers and communities plays a key role in the design and planning of alternative development activities, especially in areas where no public institutions can fulfil such a role.
- Land tenure and the sustainable management and use of land are crucial to the long-term success of alternative development, as lack of access to land can be one of the drivers of illicit crop cultivation. As they require several years to produce yields, most alternative cash crops require the long-term engagement of farmers; without access to land, however, farmers are reluctant to cultivate long-term cash crops.
- Environmental protection plays an increasingly important role. Alternative development has both a component of "do no harm", trying to minimize the environmental impact of alternative development interventions, and a proactive component, in which programmes directly or indirectly contribute to the protection of the environment and biodiversity and the mitigation of climate change.
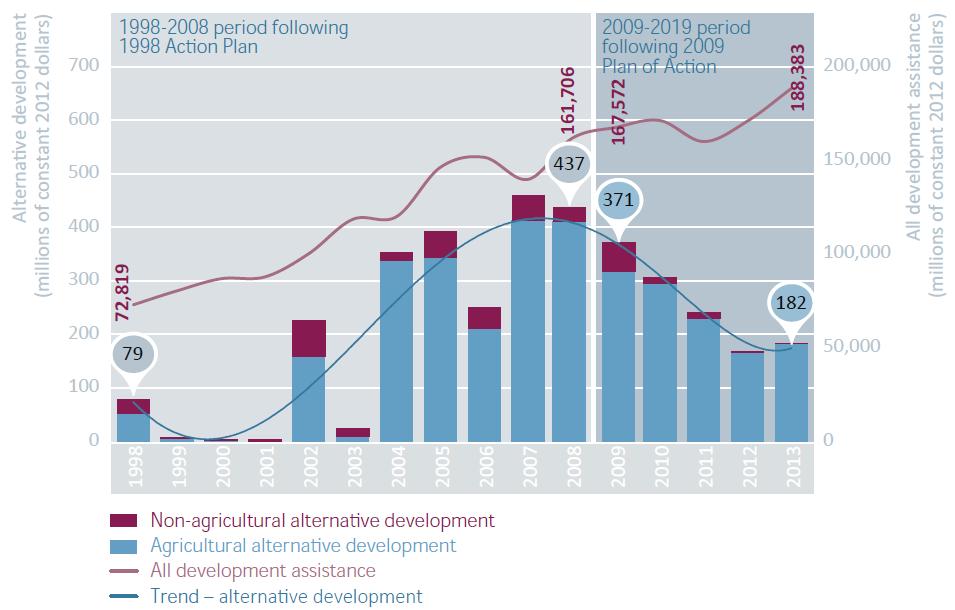
Trends in global commitments to providing development assistance and alternative development made by donor countries of the Organization for Economic Cooperation and Development, 1998-2013
Click to enlargeSource: OECD, International Development Statistics online database (data extracted on 19 December 2014).
What is successful alternative development?
Measuring the coverage, quality and effectiveness of alternative development interventions and services with regard to addressing the drug problem is challenging. The long-term nature of alternative development interventions is a factor in the complexity of measuring their success. Experience has shown that the success of alternative development in terms of the sustainable reduction of illicit crop cultivation can only be determined after several years of intervention. Attempts to gauge success over shorter periods have been found to be counterproductive, particularly when the resulting information is used for immediate action. The fact that projects take place at the local level but their impact is often evaluated at the national level can also affect perceptions of whether an alternative development programme has been successful or not.
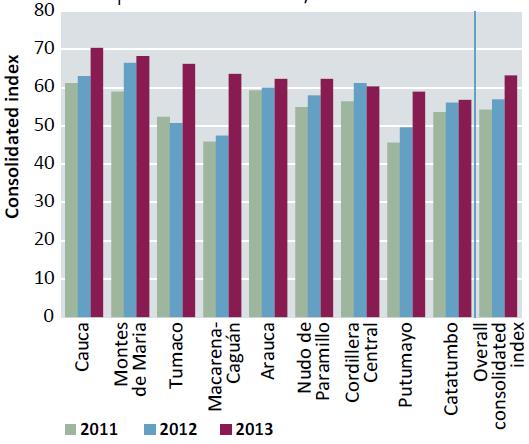
In assessing alternative development programmes, indicators related to human development, socioeconomic conditions, rural development and the alleviation of poverty, as well as institutional and environmental indicators, have been applied, in order to ensure that the outcomes are in line with national and international development objectives, including the Millennium Development Goals. Furthermore, efforts have been undertaken to consolidate a set of indicators that can be used to monitor the impact of alternative development.
In some cases, long-term commitment to alternative development has resulted in a sustainable reduction in illicit crop cultivation in the country or area concerned. More than 40 years of experience with alternative development have shown that it works when there is a long-term vision, adequate funding and the political support to integrate it into a broader development and governance agenda. Sustainable results in reducing illicit crop cultivation in different communities throughout the world have been obtained when the socioeconomic development of communities and the livelihood of rural households have improved.
Political commitment
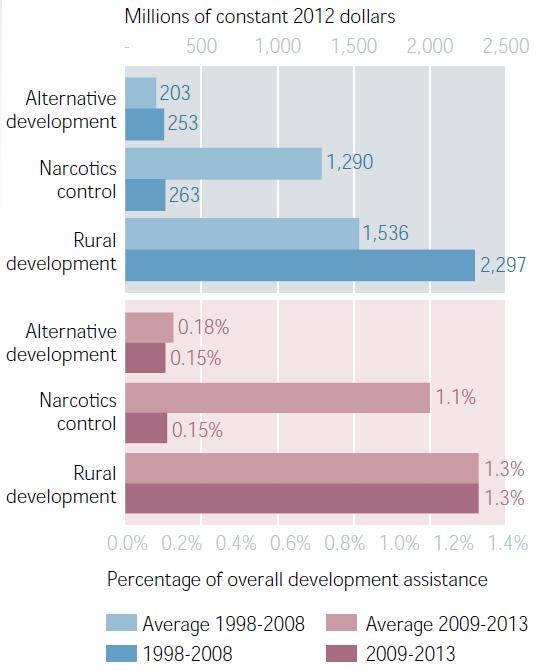
Despite the considerable attention given to alternative development at the international level, the political support has not translated into continued funding from donor countries. Alternative development has featured prominently in documents prepared for the Commission on Narcotic Drugs and the special sessions of the General Assembly on the world drug problem; however, funding for alternative development has decreased considerably in the past few years. The twentieth special session of the General Assembly, held in 1998, triggered renewed impetus in funding alternative development in the spirit of "shared responsibility", but overall gross disbursements of alternative development funds from member countries of the Organization for Economic Cooperation and Development (OECD) have declined by 71 per cent since the adoption of the 2009 Political Declaration and Plan of Action on International Cooperation towards an Integrated and Balanced Strategy to Counter the World Drug Problem. |4| In 2013, those disbursements accounted for just 0.1 per cent of global development assistance.
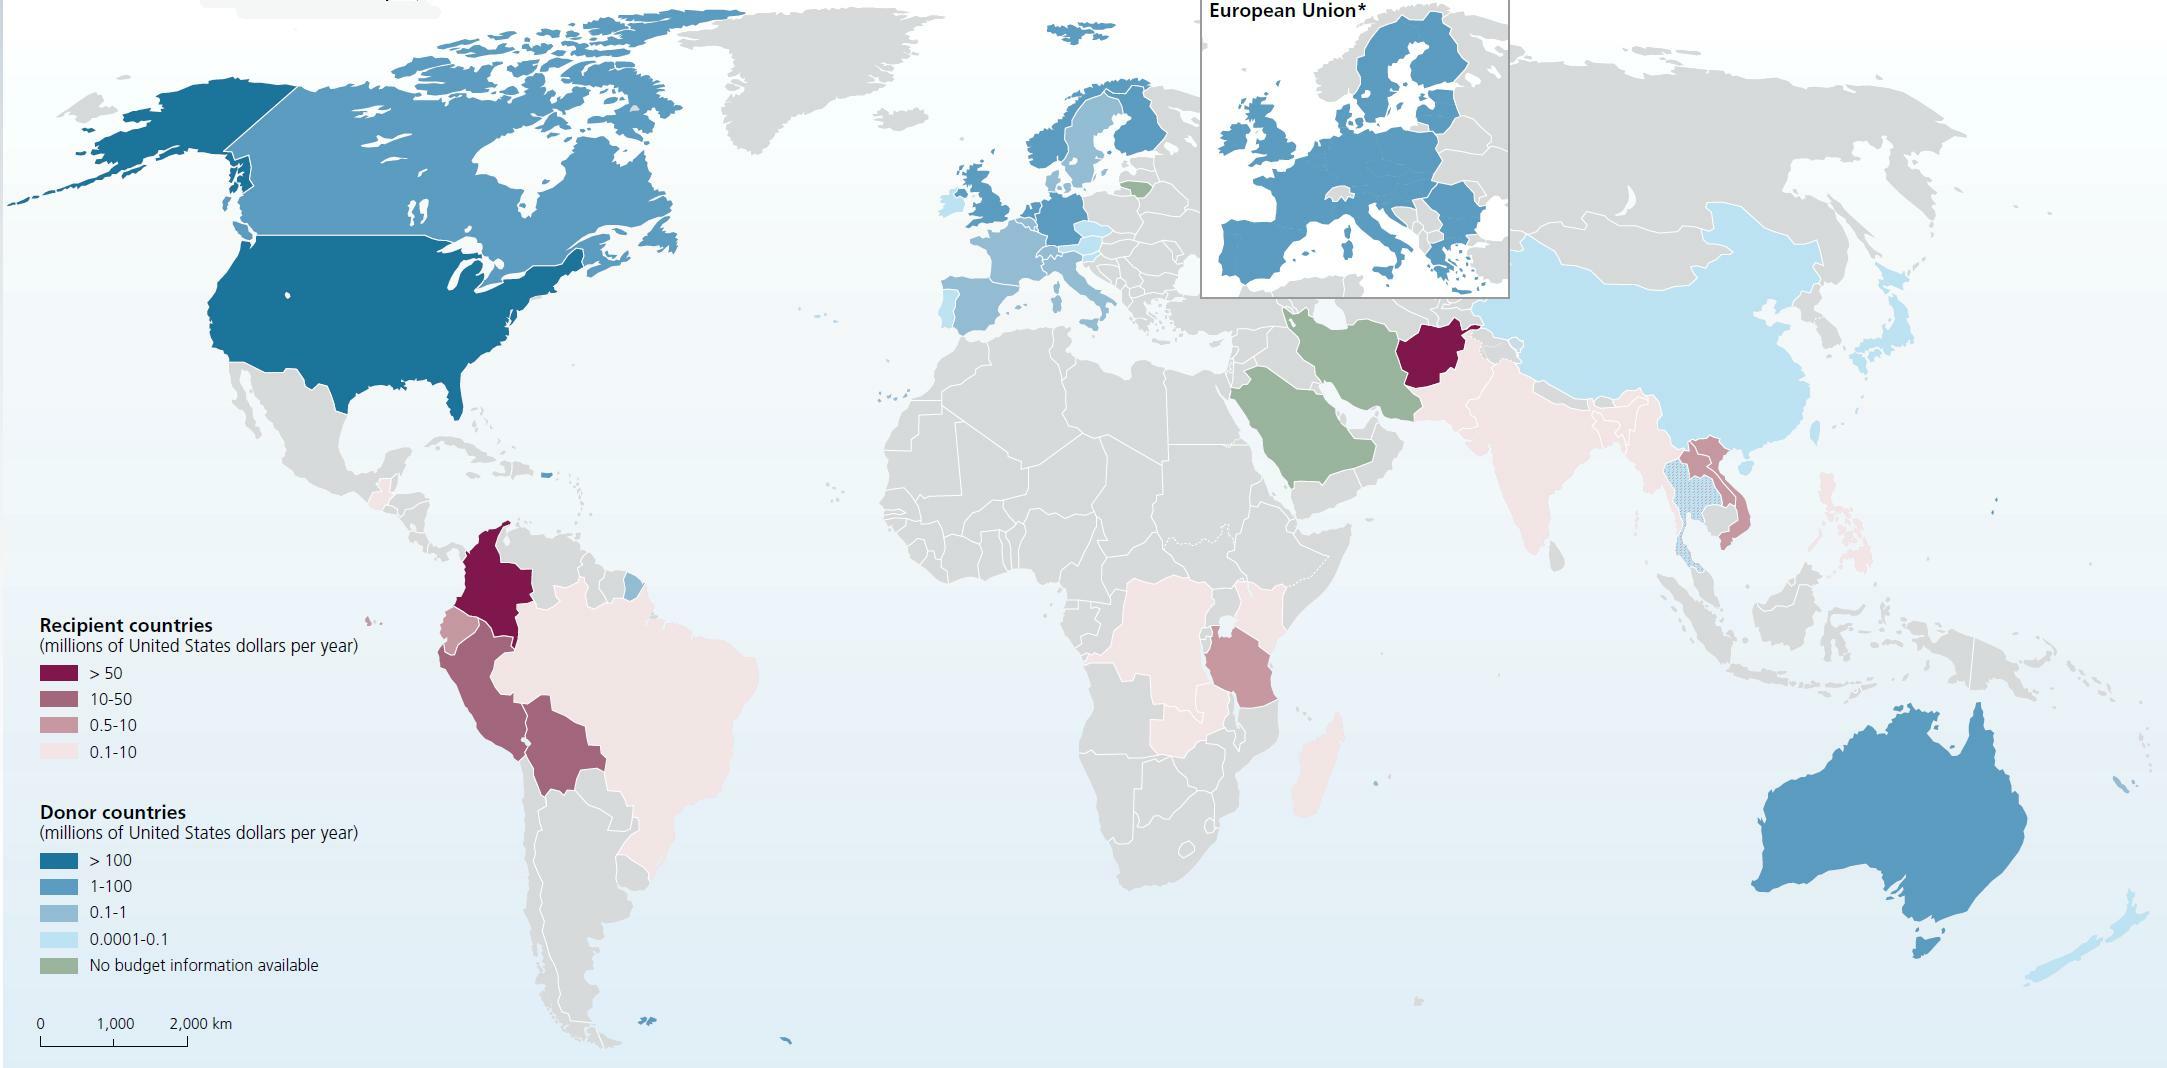
Over the past four decades, alternative development has been largely funded by external donors, including OECD member countries in North America, Europe and Oceania and non-member countries such as China, Iran (Islamic Republic of), Saudi Arabia and Thailand. But in recent years, South American countries such as Bolivia (Plurina-tional State of), Colombia and Peru and Asian countries such as Thailand have been increasingly using domestic funding to support alternative development activities.
In the process of connecting "local to global" that is currently taking place, best practices and lessons learned from local experiences within national strategies are exchanged. This reinforces efforts by UNODC, the Commission on Narcotic Drugs and other entities to foster more South-South cooperation (a broad framework for collaboration among countries of the South), pursuant to the United Nations Guiding Principles on Alternative Development.
The way forward
Alternative development has contributed to economic development (mostly in rural areas) in order to target the underlying factors and root causes of illicit drug economies. The new sustainable development goals (the post-2015 development agenda) may bring a new vision and provide alternative development with a new theoretical framework, in addition to socioeconomic development — its "traditional" pillar.
The new development agenda, emerging from the report of the Open Working Group of the General Assembly on Sustainable Development Goals, |5| points to the crucial role of environmental protection and recognizes that secure and equitable rights to land and natural resources are central to the achievement of sustainable development. These and other elements such as the rule of law and "effective, accountable and inclusive institutions", as described in goal 16 in the report, are, in part, already addressed by alternative development.
Different national experiences have shown that there may be opportunities for the alternative development approach to be applied to counter illegal activities other than illicit crop cultivation. Alternative development could be used to support communities affected by, for example, drug trafficking, illegal mining or wildlife and forest crime. With these broader applications, the concept of alternative development could be extended well beyond the existing "preventive alternative development" strategy that targets areas at risk of being used for illicit crop production.
CHAPTER I
STATUS AND TREND ANALYSIS OF ILLICT DRUG MARKETSOverall drug use remains stable globally
It is estimated that almost a quarter of a billion people between the ages of15 and 64 years used an illicit drug in 2013. This corresponds to a global prevalence of 5.2 per cent (range: 3.4-7.0 per cent), suggesting that drug use has remained stable in the past three years, although the estimated number of drug users has actually risen by 6 million to 246 million (range: 162 million-329 million) owing to the increase in the global population. With some 27 million people (range: 15.7 million-39 million), or 0.6 per cent of the population aged 15-64, estimated to suffer from problem drug use, including drug-use disorders or drug dependence, problem drug use seems to have remained somewhat stable over this three-year period.
FIG. 1. Global trends in the estimated number of drug users, 2006-2013
Click to enlargeSource: UNODC, responses to annual report questionnaire.
Note: Estimates are for adults (aged 15-64), based on past-year use.FIG. 2. Global trends in the estimated prevalence of drug use, 2006-2013
Click to enlargeSource: UNODC, responses to annual report questionnaire.
Note: Estimated percentage of adults (aged 15-64) who have used drugs in the past year.
FIG. 3. Global trends in the prevalence of use of various drugs, 2009-2013
Click to enlargeSource: UNODC, responses to annual report questionnaire.
Note: Based on the estimated percentage of adults (aged 15-64) who have used the substance in the past year.
TABLE 1. Global estimates of the use of various drugs, 2013
Percentage of population that has used the drug Number of users (thousands) low high low high Cannabis 2.7 4.9 128,480 232,070 Opioids 0.6 0.8 27,990 37,560 Opiates 0.3 0.4 12,920 20,460 Cocaine 0.3 0.4 13,800 20,730 Amphetamines 0.3 1.1 13,870 53,870 "Ecstasy" 0.2 0.6 9,340 28,390 All illicit drug use 3.4 7.0 162,000 329,000 Source: UNODC, responses to annual report questionnaire.
Note: Estimates for adults aged 15-64, based on past-year use.
UNDERSTANDING TRENDS IN DRUG USE Global and regional trends in drug use are estimated from nationally representative surveys that include questions on drug use, as well as from information gathered through studies that use indirect methods to estimate the number of regular or high-risk users such as problem opioids users. Household surveys on drug use are expensive and are, at best, carried out every three to five years. Many countries do not conduct such surveys on a regular basis and many others, especially in Asia and Africa, do not conduct them at all. In these cases, estimates from the limited number of countries where data are available are used to compute regional and global estimates.�
Rather than real-time trends at the global and regional levels, year-on-year changes in drug-use estimates thus reflect updated information from countries where new data were made available. These changes may be especially misleading if updated information is available only in countries with large populations. Indeed, global and regional estimates of drug use, including by substance, are heavily shaped by countries with large populations because of the use of national drug-use data weighted by population size in the calculation of the estimates. The stable trend that can be calculated with existing data, may mask variations that are happening in large countries for which data are not available. In addition, the estimated number of drug users is further influenced by changes in estimates of the global population aged 15-64.
The global and regional estimates of the extent of drug use offered in the present report should be viewed as best estimates, noting that they reflect the best available information at the time of analysis. From a global policy perspective, it would be more prudent to look at long-term trends rather than year-on-year changes, which may be merely a reflection of changes in a few countries. Furthermore, particular caution is required when considering trends in problem drug-use estimates at the global level, as the extent of problem drug use is difficult to capture in general population surveys (which are used to estimate drug use), and indirect methods, which are often complex, are therefore used to obtain these estimates.
� For further information, see the methodology section in the online version of this report.
Notwithstanding both regional and national variations in trends in the use of different types of drug, cannabis use has continued to rise since 2009, while the use of opioids, including the use of heroin, opium and the non-medical use of pharmaceutical opioids, has stabilized at high levels (see figure 3). However, the use of cocaine and amphetamines has declined overall, although that is mainly a reflection of trends in the Americas and Europe.
Problem drug use as reflected in the demand for drug treatment
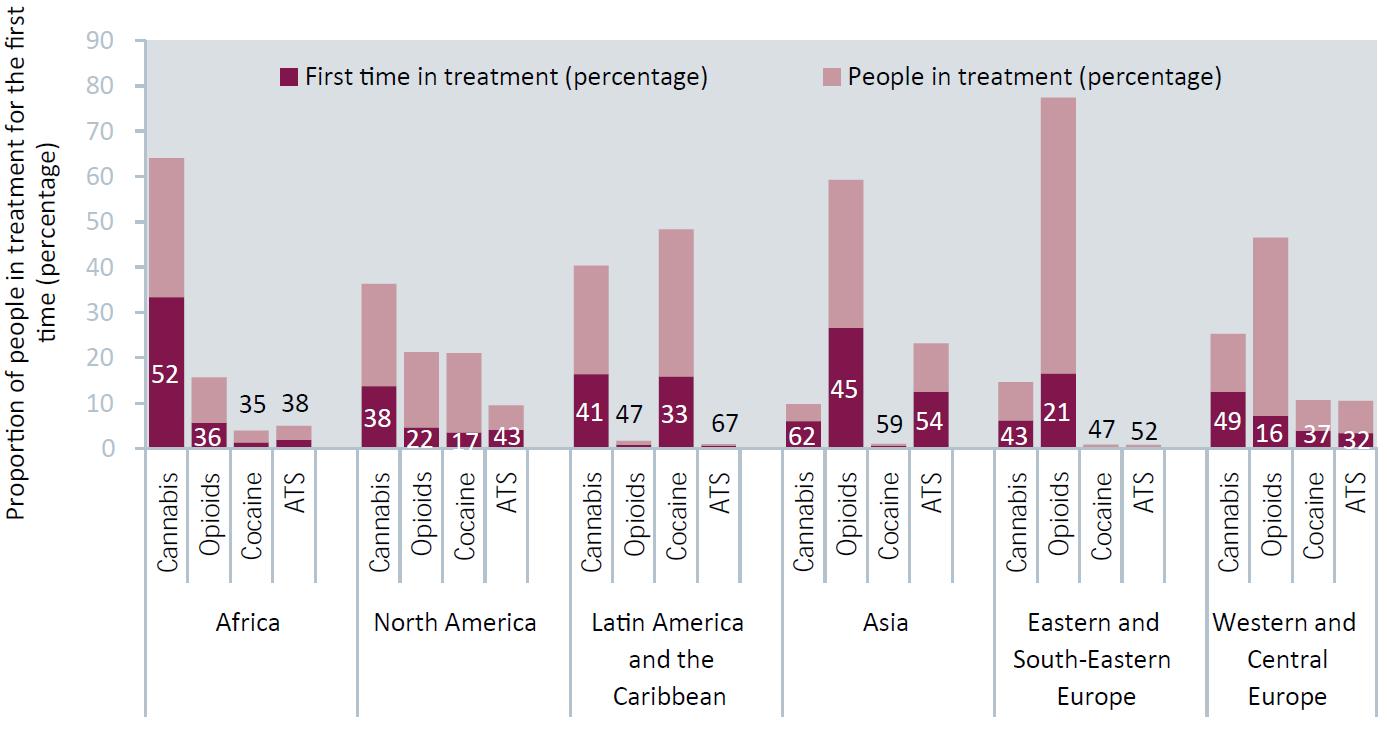
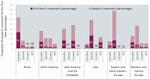
FIG. 4. Percentage distribution of people in treatment, by primary drug type, by region and share of first-time entrants for each drug type (2013 or latest available data)
Click to enlargeSource: UNODC, responses to annual report questionnaire.
In the absence of data on patterns of problem drug use, data on drug users in treatment are taken as a proxy. Treatment demand for different substances varies by region, but almost half of the people who access treatment for drug use are first-time entrants. The proportion of first-time entrants in treatment for ATS and cannabis use disorders in 2013 was higher than for other substances in most regions, indicating that, compared with other substances, there is an expanding generation of ATS and cannabis users who need treatment (see figure 4). In Asia, the number of people accessing treatment for cannabis-use disorders is small, but the proportion of first-time entrants among them (62 per cent) is the largest. Compared with other regions where cannabis users in treatment are typically in their twenties, in Asia they are reported to be typically in their thirties. As observed elsewhere, |1| |2| this may reflect a cohort of long-term regular users of cannabis who seek treatment for cannabis-related problems. In Europe, North America and Oceania, the proportion of first-time entrants for cannabis-use disorders is high, but they tend to be in their twenties. A large share of cannabis users in treatment may reflect cannabis users referred by the criminal justice system, whereas opioid users in treatment are relatively older (in their thirties). In Western and Central Europe, 16 per cent of first-time entrants were seeking treatment for opioid use, and overall treatment demand remains high, which reflects an ageing cohort of opioid users in treatment: of the estimated 1.5 million opioid users in Europe, 700,000 received opioid substitution therapy in 2012. |3| The high proportion of people in treatment for opioid use in Asia and Eastern Europe reflects the extent of problem opioid use in those regions, and ATS users form another group with a high proportion of first-time entrants in treatment in Asia.
Prison is a high-risk environment for drug use
On any given day, more than 10.2 million people are held in penal institutions throughout the world, mostly as pretrial detainees or remand prisoners, or as sentenced prisoners. |4| However, because of the high transfer of people between prison and the wider community, the number of people who spend at least some time in prison each year is considerably greater. The rapid turnover of a large number of people between the prison environment and their wider communities outside prison means that prison health merits consideration as an integral part of public health.
Drug use, including heroin use, and drug injection are common in prisons
FIG. 5. Lifetime, annual and past-month prevalence of drug use in prisons (based on 62 studies from 43 countries over the period 2000-2013)
Click to enlargeSources: UNODC, responses to annual report questionnaire; and C. Carpentier, L. Royuela and L. Montanari, "The global epidemiology of drug use in prison" (2015).
Note: Symbols represent median prevalence with vertical lines depicting inter-quartile range. Data on lifetime, annual and past-month use are not consistent across studies (this explains why the annual prevalence of cocaine use has a median value lower than the past-month use).People who use drugs often have a history of incarceration. In the United States of America, for example, it is estimated that between 24 and 36 per cent of all people using heroin pass through the correctional system each year, representing more than 200,000 individuals. |5| Although data remain limited, studies have shown that drug use within prisons is common (see figure 5). Based on a review of 41 studies from 26 countries (mostly in Europe) and supplemented with data reported in responses from Member States to the annual report questionnaire, drug use in prisons was shown to be highly prevalent in many of these studies, although there is considerable variability. |6| Approximately one in three people held in prison have used drugs at least once while incarcerated, with approximately one in eight reporting use in the past month. Cannabis is the most commonly used drug, as it is in the wider community outside prison, but lifetime and recent (past-month) use of heroin in prison is more common than that of cocaine, amphetamines or "ecstasy". Based on these studies, the median estimate of the proportion of people held in prison who have used heroin at some time while incarcerated is 10.1 per cent (inter-quartile range: 2.5-13.4 per cent), while 5.0 per cent (inter-quartile range: 0.8-11.5 per cent) report use in the past year (which is approximately 14 times higher than in the general population, estimated at 0.35 per cent), and 2.4 per cent (inter-quartile range: 1.3-9.0 per cent) report recent use in the past month.
A number of studies report high levels of injecting drug use by prisoners, which may be a result of the high prevalence of heroin use. |7| In Europe, of the 12 countries reporting to EMCDDA on injecting drug use by prisoners at some time during incarceration, four countries report levels above 10 per cent (Luxembourg, 31 per cent; Germany, 22 per cent; Portugal, 11 per cent; and Latvia, 10 per cent). |8| Some small-scale surveys provide anecdotal information on high levels of injecting drugs in prison. For example, among a survey of female prisoners in British Columbia, Canada, 21 per cent reported injecting drugs while in prison; |9| a survey of prisoners in Australia revealed that 23 per cent had injected drugs at some time in prison; |10| and among male inmates in Bangkok, 39 per cent reported injecting drugs while in prison, with 12 per cent injecting for the first time while incarcerated. |11| These estimates are considerably higher than the prevalence of injecting drug use among the general population, which is estimated globally to be 0.26 per cent of those aged 15-64.
Unsafe injecting practices are a major risk factor for the transmission of blood-borne infections such as HIV and viral hepatitis B and C. Due to the difficulties of obtaining sterile needles and syringes, people held in prisons are more likely to share injecting equipment and this practice has been found to be extremely common among prisoners. Very high levels of sharing of needles and syringes have been documented among people who inject drugs (PWID) in prisons: 56 per cent in Pakistan, 66 per cent in the Russian Federation, 70-90 per cent in Australia, 78 per cent in Thailand and 83-92 per cent in Greece. |12|
Millions of people inject drugs worldwide
Among people using drugs, PWID are one of the most vulnerable and marginalized groups. They experience a range of health, socioeconomic and legal challenges, often with poor outcomes, not least of which is the elevated risk of death compared with the general population (see also box 3). The joint UNODC/WHO/UNAIDS/World Bank estimate for the number of PWID worldwide for 2013 is 12.19 million (range: 8.48-21.46 million). This corresponds to 0.26 per cent (range: 0.18-0.46 per cent) of the adult population aged 15-64. This estimate is based on reporting of information on current injecting drug use from 93 countries covering 84 per cent of the global population aged 15-64.
HIGH RATES OF HIV, TUBERCULOSIS AND HEPATITIS C ARE OFTEN FOUND IN PRISONS
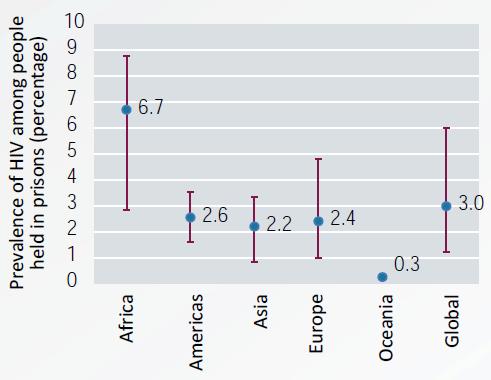
Prevalence of HIV among people held in prison, by region (2013, or latest year available after 2008)
Click to enlargeSource: UNODC, responses to annual report questionnaire; and Dolan and others, "HIV/AIDS in prison" (2014).
Notes: Symbols represent median prevalence with vertical lines depicting inter-quartile range. Only two studies were identified from Oceania (Australia and New Zealand).Prisons pose a high-risk environment for the transmission of infectious diseases, particularly HIV and tuberculosis. In many countries, PWID, who are at increased risk of contracting HIV and other bloodborne infections, compared with the population in the community, are overrepresented in prison populations.� The global median prevalence of HIV among people living in prisons is estimated at 3.0 per cent, which is five times higher than the global median prevalence of HIV of 0.6 per cent among the general population aged 15-49.b
Prison settings are often characterized by overcrowding, inadequate ventilation, poor nutrition and limited medical facilities for diagnosis and treatment, all of which contribute to the spread of tuberculosis among prisoners. In some countries, the incidence rates of tuberculosis in prisons were found to be 8-35 times higher than among the general populations.c Combined infections of HIV and tuberculosis are particularly serious, with each infection speeding up the progress of the other. The risk of developing tuberculosis is 20-37 times greater in people living with HIV compared with those not infected with HIV.d In addition, the prevalence of hepatitis C is far higher among people held in prison, particularly among those in prison with a history of injecting drug use.e
� Kate Dolan and others, "HIV/AIDS in prison: A global systematic review of prevalence, incidence, AIDS related mortality and HIV and related interventions", presented at the 20th International Conference on AIDS, held in Melbourne, Australia, from 20 to 25 July 2014.
b UNAIDS, AIDSinfo database.
c A. Aerts and others, "Tuberculosis and tuberculosis control in European prisons", International Journal of Tuberculosis and Lung Disease, vol. 10, No. 11 (2006), pp. 1215-1223.
d Masoud Dara, Dato Chorgoliani and Pierpaolo de Colombani, "TB prevention and control care in prisons", in Prisons and Health, S. Enggist and others, eds. (Copenhagen, WHO Regional Office for Europe, 2014).
e S. Larney and others, "The incidence and prevalence of hepatitis C in prisons and other closed settings: results of a systematic review and meta-analysis", Hepatology, vol. 58, No. 4 (2013), pp. 1215-1224.
The updated global total number of PWID is slightly different from the 12.69 million (for 2012) published in the World Drug Report 2014. Although new or more recent information on PWID from 22 countries are included, the revision primarily reflects new estimates for Poland and the United Republic of Tanzania, which were not previously reported, and lower estimates for the numbers of PWID in Brazil and Viet Nam. The global prevalence of PWID among the population aged 15-64 is essentially unchanged from the World Drug Report 2014.
By far the highest prevalence of PWID continues to be found in Eastern and South-Eastern Europe, where 1.27 per cent of the general population aged 15-64 is estimated to be injecting drugs, a rate nearly five times the global average. The estimate for this subregion is heavily influenced by the high prevalence of injecting drug use experienced in the Russian Federation (2.29 per cent of the population aged 15-64). However, in terms of the actual numbers of PWID, the largest proportion continues to reside in East and South-East Asia, with an estimated 3.15 million, accounting for approximately one in four PWID worldwide. Large numbers of PWID also reside in Eastern and South-Eastern Europe (2.91 million, representing 24 per cent of the global total number of PWID) and North America (2.07 million, representing 17 per cent of the global total number of PWID). Three countries, the Russian Federation, China and the United States, when combined, account for nearly half (48 per cent) of the global total number of PWID.
TABLE 2. Estimated number and prevalence (percentage) of people who currently inject drugs among the general population aged 15-64, 2013
Region Subregion People who inject drugs Estimated number Prevalence (percentage) low best high low best high Africa 330,000 1,000,000 5,590,000 0.05 0.16 0.91 America 2,150,000 2,820,000 3,970,000 0.34 0.44 0.62 North America 1,780,000 2,070,000 2,380,000 0.56 0.65 0.75 Latin America and the Caribbean 370,000 750,000 1,590,000 0.11 0.23 0.49 Asia 3,380,000 4,560,000 6,110,000 0.12 0.16 0.21 Central Asia and Transcaucasia 360,000 410,000 470,000 0.66 0.75 0.87 East and South-East Asia 2,330,000 3,150,000 4,300,000 0.15 0.20 0.27 South-West Asia 400,000 670,000 940,000 0.22 0.37 0.51 Near and Middle East 30,000 70,000 130,000 0.03 0.08 0.13 South Asia 250,000 260,000 260,000 0.03 0.03 0.03 Europe 2,500,000 3,680,000 5,630,000 0.45 0.67 1.02 Eastern and South-Eastern Europe 1,790,000 2,910,000 4,780,000 0.78 1.27 2.09 Western and Central Europe 710,000 770,000 850,000 0.22 0.24 0.26 Oceania 120,000 130,000 160,000 0.49 0.53 0.66 GLOBAL 8,480,000 12,190,000 21,460,000 0.18 0.26 0.46 Sources: UNODC, responses to annual report questionnaire; progress reports of UNAIDS on the global AIDS response (various years); the former Reference Group to the United Nations on HIV and Injecting Drug Use; and national government reports.
Note: Numbers are rounded to the nearest 10,000.The burden of HIV among people who inject drugs continues to be high in many regions
The burden of HIV among PWID is high, with PWID accounting for an estimated 30 per cent of new HIV infections outside sub-Saharan Africa. |13| About 1.65 million (range: 0.92-4.42 million) PWID were estimated to be living with HIV worldwide in 2013, which would correspond to 13.5 per cent of PWID being HIV positive. This joint UNODC/WHO/UNAIDS/World Bank estimate is based on information on the prevalence of HIV among PWID from 114 countries, covering 93 per cent of the estimated global number of PWID.
Although estimates of the prevalence of HIV among PWID have been updated for 52 countries (none with large numbers of PWID living with HIV), the global total number of PWID living with HIV is essentially unchanged from the information provided in the World Drug Report 2014. However, the small downward revision to the total number of PWID globally has resulted in the global prevalence of HIV among PWID being revised upwards to 13.5 per cent (from the 13.1 per cent presented in the World Drug Report 2014).
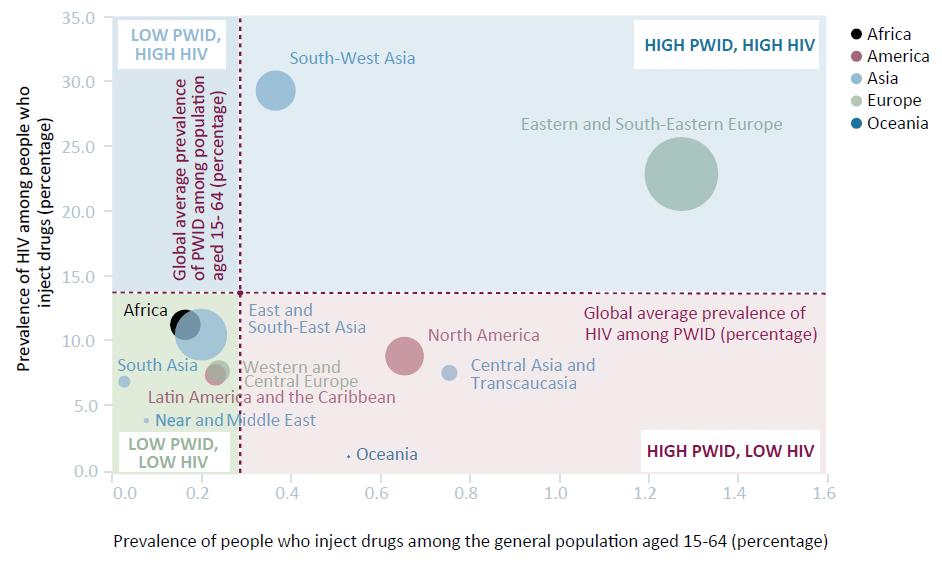
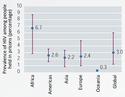
Two subregions stand out as having particularly high rates of HIV infection among PWID. An estimated 29 per cent of PWID are living with HIV in South-West Asia and some 23 per cent of PWID are living with HIV in Eastern and South-Eastern Europe. In the remaining regions, the average prevalence of HIV infection among PWID is much lower, ranging from 1 per cent in Oceania to 11 per cent in Africa (although for Africa this estimate may not be reliable as monitoring systems may not be adequate).
Approximately 40 per cent of the estimated global total number of PWID living with HIV reside in Eastern and South-Eastern Europe, mostly in the Russian Federation and Ukraine. East and South-East Asia contribute a further 20 per cent to the global total number of PWID living with HIV, although both the prevalence of injecting drug use and the prevalence of HIV among PWID are below their respective global averages. It is the large population aged 15-64 residing in this region that translates into the relatively large number of PWID living with HIV. South-West Asia, the region with the highest prevalence of HIV among PWID, contributes 12 per cent to the total global number of PWID living with HIV, with a large proportion of these residing in Pakistan. Four countries, the Russian Federation, China, Pakistan and the United States (in descending order), when combined account for nearly two thirds (63 per cent) of the total global estimated number of PWID living with HIV.
TABLE 3. Estimated number and prevalence (percentage) of HIV among people who inject drugs, 2013
Region Subregion HIV among people who inject drugs Estimated number Prevalence (percentage) Best estimate low best high Africa 30,000 112,000 1,582,000 11.2 America 167,000 237,000 416,000 8.4 North America 141,000 182,000 248,000 8.8 Latin America and the Caribbean 26,000 55,000 168,000 7.3 Asia 344,000 576,000 993,000 12.6 Central Asia and Transcaucasia 26,000 31,000 40,000 7.5 East and South-East Asia 211,000 329,000 612,000 10.5 South-West Asia 90,000 196,000 314,000 29.3 Near and Middle East 1,000 3,000 9,000 3.8 South Asia 17,000 17,000 18,000 6.8 Europe 373,000 724,000 1,428,000 19.7 Eastern and South-Eastern Europe 322,000 665,000 1,359,000 22.8 Western and Central Europe 51,000 59,000 69,000 7.6 Oceania 1,000 1,000 2,000 1.0 GLOBAL 915,000 1,651,000 4,421,000 13.5 Sources: UNODC, responses to annual report questionnaire; progress reports of UNAIDS on the global AIDS response (various years), the former Reference Group to the United Nations on HIV and Injecting Drug Use; estimates based on UNODC data; and national government reports.
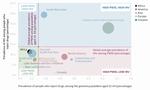
Note: Numbers are rounded to the nearest 10,000.FIG. 6. People who inject drugs living with HIV, in relation to the prevalence (percentage) of people who inject drugs and the prevalence (percentage) of HIV among this group, by region, 2013
Click to enlargeSources: UNODC, responses to annual report questionnaire; progress reports of UNAIDS on the global AIDS response (various years); the former Reference Group to the United Nations on HIV and Injecting Drug Use; and national government reports.
Notes: The number of PWID living with HIV is represented for each region as both a proportion of PWID in the general population aged 15-64 (horizontal axis) and as a proportion of PWID living with HIV (vertical axis). The areas of the circles are proportional to the number of PWID living with HIV. The orange dot and dashed lines represent the global average prevalence of PWID and the global average prevalence of PWID living with HIV.
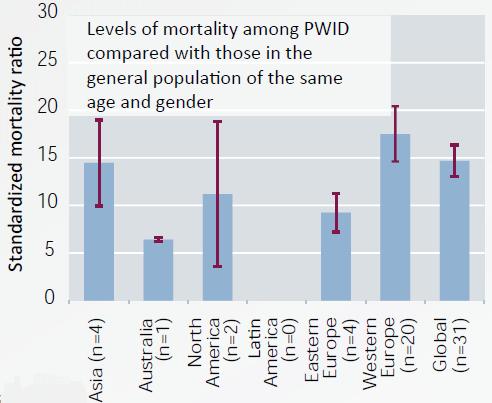
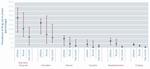
PREMATURE DEATH IS COMMON AMONG PEOPLE WHO INJECT DRUGS Compared with the general population, PWID are at an elevated risk of dying, primarily as a result of the transmission of infectious diseases, in particular HIV, and of fatal drug overdoses. A recent systematic review of cohort studies that followed PWID over time� suggests that they experience a high mortality rate. The overall (pooled) mortality rate across the 65 cohort studies from 25 countries estimated a mortality rate of 2.35 deaths per 100 person-years (if 100 PWID were followed over one year, two to three deaths would be expected to occur among this group). This is a much higher level of mortality than among those of comparable age and gender among the general population (standardized mortality ratio = 14.68).
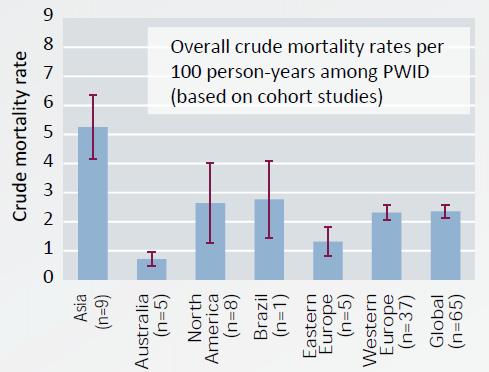
Mortality rates among people who inject drugs and the increase in mortality among people who inject drugs compared with the general population
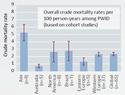
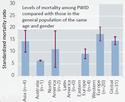
Click to enlargeSource: Mathers and others, "Mortality among people who inject drugs" (2013).
Note: The numbers within brackets on the horizontal axis represent the number of cohort studies.Asia is the region with the largest estimated population of PWID, accounting for more than one in three PWID globally. Albeit based on a very limited number of studies, at 5.25 deaths per 100 person-years, the region also experiences a high mortality rate from injecting drugs. By contrast, findings from five other studies in Australia suggest that the level of mortality among PWID is low in Australia, at 0.71 deaths per 100 person-years.
The mortality rate was observed to be higher among males who inject drugs (MWID). Based on 37 studies, MWID were found to have a mortality rate 1.32 times that of females who inject drugs (FWID). However, based on 19 studies, FWID had a greater excess mortality than MWID when compared with similar age groups in the general population. Across 43 studies, the crude mortality rate among PWID from overdose was estimated at 0.62 deaths per 100 person-years.
Continuity of treatment and the length of time spent in treatment can have an impact in reducing overdoses among PWID. Data from six studies showed a risk of dying some 2.5 times higher for PWID during off-treatment periods compared with in-treatment time periods.
Effective evidence-based interventions can now be identified for prevention, treatment and care of HIV for PWID,b including needle and syringe programmes, opioid substitution therapy, antiretroviral therapy and the availability of naloxone. For example, a recent systematic reviewc highlighted the importance of opioid substitution therapy, finding that it is associated with an average 54 per cent reduction in the risk of new HIV infection among PWID, largely by reducing the frequency of unsafe injecting; this is ultimately very likely to reduce the number of deaths among PWID. However, the availability of evidence-based interventions targeting PWID, including opioid substitution therapy, varies considerably across countries and is generally limited even in countries with a high prevalence of PWID and high proportions of PWID who are living with HIV.d
a Bradley M. Mathers and others, "Mortality among people who inject drugs: a systematic review and meta-analysis", Bulletin ofthe World Health Organization, vol. 91, No. 2 (2013), pp. 102-123.
b WHO, UNODC, UNAIDS Technical Guide for Countries to Set Targets for Universal Access to HIV Prevention, Treatment and Care for Injecting Drug Users: 2012 Revision (Geneva, WHO, 2012).
c Georgie J. MacArthur and others, "Opiate substitution treatment and HIV transmission in people who inject drugs: a systematic review and meta-analysis", BMJ, vol. 345 (4 October 2012), pp. 1-16.
d UNODC, World Drug Report 2014.
FIG. 7. Prevalence of HIV among people who inject drugs in selected cities
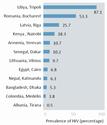
Click to enlargeSources: UNODC, responses to annual report questionnaire; progress reports of UNAIDS on the global AIDS response (various years); the former Reference Group to the United Nations on HIV and Injecting Drug Use; and national government reports.
The Russian Federation is affected by a concentrated HIV epidemic among PWID. Approximately one in three PWID living with HIV worldwide are estimated to reside in the Russian Federation, which experiences both a high prevalence and a high incidence |14| (new cases) of HIV among PWID. However, across cities in the Russian Federation there is a very large variation in the HIV prevalence among PWID. A study carried out in eight cities in the period 2007-2009 showed percentages of PWID living with HIV ranging from levels below 10 per cent in Voronezh (3 per cent) and Omsk (9 per cent), to around 15 per cent in Naberezhnye Chelny (13 per cent), Chelyabinsk and Orel (both 15 per cent), to around 60 per cent in Irkutsk (57 per cent), Saint Petersburg (59 per cent) and Yekaterinburg (64 per cent). |15|
The prevalence of HIV among PWID can vary markedly between cities (see figure 7) and certain cities and settings around the world that carry a large proportion of the global burden of HIV are becoming a focus of attention in the global response to the HIV epidemic, |16| with the geographically localized nature of HIV epidemics and the role of cities and settings, such as prisons, increasingly being seen as critical considerations.
Availability of harm reduction services remains low
FIG. 8. Levels of service coverage for people who inject drugs and those among them living with HIV (2013, or latest year available)
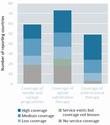
Click to enlargeSource: UNODC, responses to annual report questionnaire.
Note: For further information, see the methodology section in the online version of this report.In many countries, the levels of service coverage for needle and syringe programmes, opioid substitution therapy and antiretroviral therapy remain low, as defined according to targets set by WHO, UNODC and UNAIDS (see figure 8). |17| The proportion of countries reporting these services as either not available or at low levels of coverage are 47 per cent, 41 per cent and 22 per cent, respectively. Most of the countries reporting information on service coverage are in Europe where the levels of service coverage are relatively high. Outside Europe the level of access to these services is much lower. |18|
A recent review |19| of the global coverage of services for needle and syringe programmes, opioid substitution therapy and antiretroviral therapy shows that 91 countries include the provision of harm reduction programmes in their national policies, but that at the global level, harm reduction responses related to unsafe injecting remain poor. Needle and syringe programmes were available in 90 countries in 2014 (out of the 158 countries where injecting drug use has been documented), an increase of five since 2012, although the nature of these programmes varies considerably. In many low- and middle-income countries, however, they do not provide an adequate coverage to be fully effective. Since 2012, there has been a scale-up of needle and syringe services in 29 countries, but in 13 others the provision of services has actually decreased. Opioid substitution therapy was available in 80 countries in 2014, an increase of two since 2012. In many countries, however, opioid substitution therapy programmes remain at levels below international minimum guidelines. Since 2012, 25 countries have seen a scale-up of opioid substitution therapy, but in five others services have declined.
Progress towards realizing the commitments made in the Political Declaration on HIV and AIDS
The Political Declaration on HIV and AIDS |20| adopted by the General Assembly in its resolution 60/262 in 2011 included a commitment by Member States to work towards reducing the transmission of HIV among PWID by 50 per cent by 2015. Some progress towards realizing this commitment can be noted. Globally, new HIV infections among PWID have declined slightly (by around 10 per cent) from an estimated 110,000 (range: 97,000123,000) in 2010 to 98,000 (range: 85,000-111,000) in 2013. |21| Although the accumulated evidence collected over the past 30 years points to the effectiveness of harm reduction measures, |22| the implementation of such programmes remains at very low levels of coverage in many regions of the world. |23|
Globally, every other person who injects drugs is living with hepatitis C
FIG. 9. Number of countries, by prevalence of hepatitis C among people who inject drugs
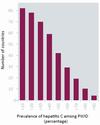
Click to enlargeSources: UNODC, responses to annual report questionnaire; progress reports of UNAIDS on the global AIDS response (various years); the former Reference Group to the United Nations on HIV and Injecting Drug Use; and national government reports.
Note: Total number of countries with data on hepatitis C prevalence among PWID is 88.Hepatitis C has the potential to pose serious health problems for those infected, with the possibility of liver failure, liver cancer and premature death. While an estimated 2.2 per cent of the global population are infected with hepatitis C, |24| this proportion is 25 times higher among PWID, estimated at 52 per cent for 2013, or 6.3 million PWID worldwide. This joint UNODC/WHO/UNAIDS/World Bank estimate is based on information from 88 countries. Although new or updated information from 36 countries has been included, the global estimate is essentially unchanged from that presented in the World Drug Report 2014.
In some countries, the prevalence of hepatitis C among PWID is considerably higher, including in countries with large PWID populations (see figure 9). Of these 88 countries, the prevalence of hepatitis C among PWID is 60 per cent or higher in 29 countries (33 per cent), including in China, where there were an estimated 1.93 million PWID in 2012, |25| 70 per cent or higher in 19 countries (22 per cent), including the United States, where there were an estimated 1.52 million PWID in 2007, |26| and 80 per cent or higher in 10 countries (11 per cent).
TABLE 4. Estimated number of drug-related deaths and drug-related mortality rates, 2013
Region Number of drug-related deaths Mortality rate per million aged 15-64 Availability of mortality data (percentage of total population in region) best estimate lower estimate upper estimate best estimate lower estimate upper estimate Africa 37,800 18,000 57,700 61.9 29.4 94.3 North America 43,300 43,300 43,300 136.8 136.8 136.8 100.0 Latin America and the Caribbean 6,000 4,900 10,900 18.4 14.9 33.4 80.0 Asia 81,100 13,600 100,700 28.2 4.7 35.0 9.0 Western and Central Europe 7,300 7,300 7,300 22.5 22.5 22.5 100.0 Eastern and South-Eastern Europe 9,500 9,500 9,500 41.5 41.5 41.5 92.0 Oceania 2,000 1,700 2,100 82.3 69.9 83.3 75.0 GLOBAL 187,100 98,300 231,400 40.8 21.5 50.5 Sources: UNODC, responses to annual report questionnaire; Inter-American Drug Abuse Control Commission; Louisa Degenhardt and others, "Illicit drug use", Comparative Quantification of Health Risks: Global and Regional Burden of Disease Attributable to Selected Major Risk Factors, vol. 1, M. Ezzati and others, eds. (Geneva, World Health Organization, 2004), p.1109.
Note: For further information, see the methodology section in the online version of this report.Being aware of one's hepatitis C status is important for access to treatment and also in preventing transmission of the infection to others. As shown in a recent systematic review, a high proportion of PWID are unaware that they are living with hepatitis C and, among those known to be infected, there is a low uptake of antiviral treatment in many European countries. |27| The study indicated that the level of undiagnosed infection of hepatitis C among PWID was high, with a median of 49 per cent (range: 24-76 per cent), while among PWID diagnosed with hepatitis C, the proportion that had started antiviral treatment was generally low, ranging from 1 to 19 per cent with a median of 9.5 per cent. The burden of disease from hepatitis C infection (such as liver disease and mortality), where assessed, was high and the authors of the study concluded that it would rise in the decade from 2014.
Drug-related deaths are predominantly related to opioid overdose
With regard to the most serious outcome that can result from illicit drug use, UNODC estimates that in 2013 there were 187,100 (range: 98,300-231,400) drug-related deaths |28| worldwide, corresponding to a mortality rate of 40.8 (range: 21.5-50.5) drug-related deaths per million people aged 15-64.
Overdose is the primary cause of drug-related deaths worldwide and opioids (heroin and non-medical use of prescription opioids) are the main drug type implicated in these deaths. Drug overdoses, with opioids present in about three quarters of the cases, are estimated to account for 3.5 per cent of all deaths among Europeans aged 15-39. |29|
FIG. 10. Deaths related to heroin and opioid painkillers in the United States, 2000-2013
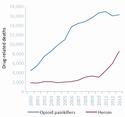
Click to enlargeSource: H. Hedegaard, L. H. Chen and M. Warner, "Drug poisoning deaths involving heroin", NCHS Data Brief No. 190 (2015).
In Europe, the highest drug-related mortality rates are found in the most northerly countries and territories with (in descending order of mortality rates and considering only countries and territories with a population aged 15-64 of 500,000 or greater) Estonia, Scotland, Finland, Sweden, Northern Ireland, the Russian Federation, Norway and Ireland all experiencing mortality rates of over 70 drug-related deaths per million of the population aged 15-64. In all of these countries, opioids were the drug type most frequently mentioned as the primary cause of death.
Contributing an estimated 23 per cent to the global number of drug-related deaths, North America experiences the highest drug-related mortality rate by far. Within the region, the United States reports one of the highest drug-related mortality rates worldwide at 4.6 times the global average and, with 40,239 drug-related deaths recorded in 2013, accounts for approximately one in five drug-related deaths globally. The high mortality rate in North America in part reflects better monitoring and reporting of drug-related deaths than in most other regions.
Heroin-related overdoses show recent increases in the United States
Substantial increases have recently been reported in the number of heroin overdoses in the United States (see figure 12). Mortality rates have nearly tripled from 1.0 to 2.7 heroin overdose deaths per 100,000 of the population between 2010 and 2013; this reflects an increase in the number of heroin-related deaths from 3,036 to 8,527 |30| (see also section on opiates).
Deaths related to new psychoactive substances are on the rise in the United Kingdom of Great Britain and Northern Ireland
In the United Kingdom of Great Britain and Northern Ireland, there has been much recent media attention over deaths relating to the use of new psychoactive substances (NPS). Over the past few years in England and Wales, the number of drug-related deaths in which NPS or so-called "legal highs" (predominantly methcathinones such as mephedrone, which has been controlled as a Class B drug under the United Kingdom Misuse of Drugs Act 1971 since April 2010) have been mentioned on death certificates has continually increased, from nine deaths in 2007 to 60 deaths in 2013. |31| There is very limited information available on the toxicology of NPS and the overdose risk from the use of these substances, alone or in combination with other drugs (including alcohol), is largely unknown.
Non-fatal overdoses are a common experience among drug users
While there has been a focus on overdose fatalities, non-fatal overdose among illicit drug users remains fairly common yet relatively undocumented. A number of studies have been conducted to understand the extent, patterns, determinants and correlates of non-fatal overdose, especially among regular opioid users and those injecting drugs; these studies suggest that between 30 and 80 per cent of the study participants have experienced an overdose in their drug-using career, nearly half of whom had experienced multiple overdoses in recent months. |32| |33| |34| |35| |36| While the absence of specific assistance is largely at play, it would seem that in some cases victims of such incidents may fear the consequences of revealing their illicit drug use or may lack confidence in the health-care system. |37| |38| A number of studies have estimated that 1 in 20 or 25 overdose cases are fatal, with a cumulative risk of death increasing with each successive overdose. |39| |40| |41|
Non-fatal overdose remains of public health significance because of its related morbidity and serious consequences, including pulmonary oedema, bronchopneumonia, peripheral neuropathy, renal failure, cognitive impairment and traumatic injuries sustained during overdose. |42| |43| Repeated overdoses also place the person at a greater risk of long-term physical and cognitive damage, while survivors of a non-fatal overdose have a higher risk of suffering further overdose and death. |44|
The risk of overdose varies depending on different factors. |45| Overdoses are reported in users with longer opioid use or long-term injecting, who are older, who are more likely to have been treated for drug dependence and who have a higher level of dependence on the severity of dependence scale. |46| |47| Overdoses are associated with higher drug purity; higher frequency of use — almost daily use or binge use of drugs; |48| and polydrug use, particularly the use of amphetamines, cocaine, alcohol or benzodiaz-epines in conjunction with opioids, especially while injecting. The role of polydrug use in opioid overdose, for instance with benzodiazepines, essentially reflects a pharmacological interaction in the form of an additive respiratory depressant effect. |49|
Temporary cessation of drug use following periods of drug detoxification, hospitalization, arrest or imprisonment leads to decreased drug tolerance. When drug use is reinitiated, there is an increased risk of overdose. Importantly, enrolment in opioid substitution therapy would seem to protect from non-fatal overdose: in a study among PWID conducted between 1996 and 2004 in Vancouver, Canada, it was the only variable that was shown to be inversely associated with non-fatal overdose. |50| Similarly, social mar-ginalization or homelessness, together with living with HIV, have also been associated with overdose episodes, though evidence of a causal association has not been established. |51|
Overdose is preventable
Despite the high prevalence of non-fatal overdoses and the associated morbidity, scant attention has been given internationally to overdose reduction interventions. Overdose-related deaths are preventable. Along with long-term opioid agonist (substitution) treatment, the availability and accessibility of naloxone is another important intervention in cases of overdose. Naloxone is an opioid antagonist that can immediately reverse the effects of opioid overdose. |52| As many overdoses occur in the presence of the drug user's family members or peers, empowering these people with the skills to administer naloxone can be a lifesav-ing intervention.
C. GENDER, DRUG USE AND HEALTH CONSEQUENCES
Use of drugs, except tranquillizers, is more prevalent in men than in women
Compared with drug use among men, overall drug use remains low among women. At the global level, men are three times more likely than women to use cannabis, cocaine or amphetamines. By contrast, women are more likely than men to misuse prescription drugs, particularly prescription opioids and tranquillizers. |53| |54| This mainly reflects differences in opportunities to use drugs due to the influence of the social or cultural environment rather than intrinsic gender vulnerability. |55|
A large body of evidence has shown that processes of drug-use initiation, social factors and characteristics related to substance use, biological responses and progression to the development of problems related to substance use vary considerably between men and women. |56| Women with substance-use disorders tend to have a history of over-responsibility in their families of origin and have experienced more disruptions and report more interpersonal conflicts in the family than their male counterparts, particularly issues related to parenting and exposure to childhood and adult trauma. Women with substance-use disorders may come from families where one or more family members is also drug dependent and may have suffered victimization and injury. Many women identify relationship problems as a cause for their substance use. In addition, psychiatric co-morbidities, especially mood and anxiety disorders, are reported to be higher among women |57| |58| and these disorders typically predate the onset of substance-use problems. |59|
FIG. 11. Gender differences in the use of selected drugs, 2013 (or latest available data)
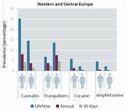
Click to enlarge
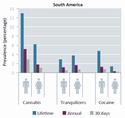
Click to enlargeSource: UNODC, responses to annual report questionnaire.
Note: Unweighted average of lifetime, past-year and past-month prevalence in adults (aged 15-64), based on 28 countries in Western and Central Europe and six countries in South America.
Literature on gender differences published over the past three decades has shown that women typically begin using substances later than men and that substance use by women is strongly influenced by intimate partners who also use drugs. |60| Women overall may be less likely than men to develop drug-use disorders and dependence. Nevertheless, once they have initiated substance use, women tend to increase their rate of consumption of alcohol, can-nabis, opioids and cocaine more rapidly than men |61| and may progress more quickly than men to the development of drug-use disorders and dependence. |62| |63| In the United States, for instance, males were reported to be 2.33 and 2.25 times more likely to have had drug-use disorders and drug dependence, respectively, than females in the previous year. |64| |65|
In most surveys among the general population, a greater misuse of prescription drugs is reported among women than among men, with the difference in the use of sedatives and tranquillizers being more marked than in the use of prescription opioids or painkillers. Thus, women are twice as likely as men to use tranquillizers, but both have roughly equal levels of use of prescription opioids. Survey data from South America, Western and Central Europe and North America indicate that, in comparison with the use of most illicit substances, the extent of the misuse of tranquillizers at all levels, whether lifetime, annual or current (past 30 days), remains at a higher level among women than among men: for example, the aggregated past-year misuse of tranquillizers by women in Western and Central Europe is nearly twice that of can-nabis use, while the use of other substances such as amphetamine, cocaine and opioids remains at very low levels (see figure 11).
Research has shown that while many people experiment with drug use, not many will repeat the experience on more than a limited number of occasions and even fewer of them will continue into more regular drug use. This is illustrated by the sharp decline observed when comparing lifetime with annual and current (past month) drug use. In the case of the misuse of sedatives and tranquillizers, this rate of attrition seems to be much lower than for other substances. Data from general population surveys in Western and Central Europe show that more than a third of men and women who initiate the misuse of tranquillizers continue to be regular or current users, whereas 17 per cent of men and 10 per cent of women may continue to be regular cannabis users. Considering the high prevalence of the misuse of tranquillizers among women, this remains a significant problem.
Women who inject drugs are often more vulnerable to HIV than their male counterparts
FIG. 12. Ratio of annual and past-month prevalence to lifetime prevalence of drug use among women in Western and Central Europe, 2013 (or latest year available)
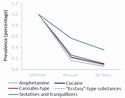
Click to enlargeSource: UNODC, responses to annual report questionnaire.
Note: Unweighted average of lifetime, past-year and past-month prevalence in adult females (aged 15-64), based on 28 countries in Western and Central Europe.
The available data on gender disaggregated HIV prevalence among PWID point to the existence of gender disparities that are quite large in some countries (see figure 13). Data reported to UNAIDS |66| show that FWID experience a higher prevalence of HIV in many countries with large populations of PWID (over 120,000), including India, Italy, Malaysia, Mexico, the Russian Federation and Ukraine. Additionally, in some other countries with a high prevalence of HIV among PWID, such as Indonesia, Kenya, Mauritius and Thailand, the prevalence of HIV is also higher among FWID. Females constitute sizeable minorities of the PWID populations in many countries, where, for example, 33 per cent of PWID in Canada are female, while this figure is 30 per cent in the Russian Federation, 26 per cent in Ukraine, 20 per cent in China and 10 per cent in Malaysia. |67| |68| Furthermore, in many countries the prevalence of HIV among females in prison is higher than among male prisoners. |69|
FIG. 13. Prevalence of HIV among females who inject drugs compared with prevalence of HIV among males who inject drugs (latest year available)
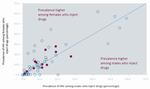
Click to enlargeSource: UNAIDS, progress reports on the global AIDS response.
Note: Each circle represents a country. The solid circles are those countries with large numbers (over 120,000) of people who inject drugs. Data were available for 61 countries across all global regions.
A review of 117 studies from 14 countries with a high prevalence of HIV among PWID (greater than 20 per cent) found an overall higher prevalence of HIV among FWID compared with MWID, although the difference was quite modest. |70| There was also a very wide variation across the studies. In all 10 studies with the largest differences in HIV prevalence between FWID and MWID, the original authors point to sexual transmission as the reason for the difference. Similarly, combined data for nine countries in Europe found an overall prevalence of HIV among FWID of 21.5 per cent compared with 13.6 per cent among MWID. |71| Again the differences across the countries were marked. In countries in sub-Saharan Africa, where in the general population females are more affected by HIV than males, HIV among FWID is particularly high compared with MWID: in Kenya, although FWID were few in number, the HIV prevalence is almost three times higher (44.5 per cent) than among MWID (16.0 per cent); |72| in the United Republic of Tanzania, HIV among FWID (66.7 per cent) is more than double that among MWID (29.9 per cent); |73| in Senegal, HIV among FWID (21.1 per cent) is three times higher than among MWID (7.5 per cent); |74| in South Africa, HIV among FWID (17 per cent) is slightly higher than among MWID (14 per cent); |75| and in Nigeria HIV among FWID (21.0 per cent) is seven times higher than among MWID (3.1 per cent). |76| By contrast, a review of11 studies from five countries in Central Asia found no overall gender differences in the HIV prevalence among PWID, but again there was considerable variation among the studies. |77|
There have been multiple reasons proposed why FWID may be at greater risk of becoming infected with HIV than their male counterparts. |78| |79| Females are more likely to be stigmatized and marginalized by society and are more likely to hide their injecting drug-use behaviour. Unsafe injecting practices may be more common among females given the greater difficultly in accessing needle and syringe programmes or treatment for drug dependence and the lack of services tailored to women's needs. |80| Surveys have documented high rates of sex work among FWID (often to support their own, as well as their sexual partner's, drug use), and of inconsistent condom use, as well as higher rates of sharing of needles and syringes than among FWID who are not involved in sex work. |81| |82| |83| The combined risks of unsafe injecting and unprotected sex work substantially elevates the risks of acquiring HIV for females.
One common feature that emerges from the different reviews and is seen in the data from UNAIDS is that the gender differences observed in individual surveys show a very wide variability. This highlights that local context is very important in the implementation of prevention programmes that are targeted and gender sensitive to cater for the separate needs of males and females where these needs are different.
Women are less likely than men to access drug treatment
FIG. 14. Proportion of women in treatment for various substances, by region (2013 or latest available data)
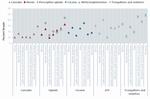
Click to enlargeSource: UNODC, responses to annual report questionnaire.
Note: Unweighted average of proportion of women in all drug treatment per primary substance of use.
The problems that women experience as a result of drug use may interfere in more areas of their life than in men's. The severity of the medical consequences of substance use and psychiatric co-morbidities are also reportedly higher among women. However, a convergence of evidence suggests that women with substance use disorders are less likely, over their lifetime, to enter treatment than their male counterparts, as they are more likely to face barriers that affect their access and entry to drug treatment. |84| |85| Globally, one out of three drug users is a woman yet only one out of five drug users in treatment is a woman, although this ratio is higher in Europe and Oceania (mainly reflecting Australia) than elsewhere. A higher proportion of women is, however, reported in the case of treatment for the misuse of tranquillizers and prescription opioids than other substances. Approximately one third of those in treatment for the use of tranquillizers are women, compared with approximately 10 per cent in the case of cannabis. This is most likely a reflection of the comparatively higher prevalence of use of tranquillizers among women than among men.
Gender disparities in access to substance-use treatment have mainly been associated with the limited availability of services tailored to meet the specific needs of women in treatment. As there remains limited information about women with substance-use problems, there is still a general lack of appropriate evidence-based treatment models for women, especially in resource-constrained countries. |86|
Women encounter significant systemic, structural, social, cultural and personal barriers in accessing substance abuse treatment. |87| |88| At the structural level, the most significant obstacles include lack of child care and punitive attitudes to parenting and pregnant women with substance abuse problems. This makes women fear losing custody of their children or having to relinquish their children as a condition of treatment, and prevents them from seeking treatment in residential settings. Treatment programmes may also be located far from where women live and may have inflexible admission requirements and schedules that may not suit the needs of women. |89| |90| Moreover, women with children may still need to secure child care to participate in outpatient treatment programmes as they may not have enough money to pay for child-care costs, transportation or treatment itself. Although men may be referred for treatment by their family, an employer or the criminal justice system, treatment history among women is more associated with and triggered by other problems, such as a diagnosis of antisocial personality disorder, or sex work, and could be referred by the social services system, mental health facilities or self-initiated, rather than solely due to substance abuse. |91|
In many societies, substance use both in general and among women is heavily stigmatized and cultural norms may make it difficult for women to acknowledge such a problem or leave their homes and families to undergo treatment. Since many women with substance-use problems also live with a partner or other family members with a substance-use problem, relationship issues and the role of substance use within the relationship dynamic remain central issues in women obtaining support to undergo treatment. |92| A growing body of evidence suggests that drug treatment services that attend to social needs and other gender-specific needs as well as those of ethnic groups can contribute to engagement, retention in treatment and improved treatment outcomes. |93|
What works in drug use prevention?
Prevention of drug use is one of the key provisions of international drug control systems. Aimed at protecting the health of people from harm caused by the non-medical use of controlled substances while ensuring availability of those substances for medical and scientific purposes, |94| drug use prevention encompasses any activity focused on preventing or delaying the initiation of drug use and the potential transition to problem drug use.
Compared with treatment for drug dependence, for example, the science behind drug use prevention started to develop only relatively recently. In 2013, UNODC published the International Standards on Drug Use Prevention, which summarize the scientific evidence on the effectiveness of drug use prevention efforts. Notwithstanding some notable gaps in the base of evidence, UNODC was able to identify a series of interventions and policies that are effective in preventing drug use, substance abuse and other risky behaviours. |95| Building on the International Standards, including recent reviews of the evidence |96| and relevant single studies, this section outlines the possibilities and opportunities for success in preventing drug use that reside in the implementation of evidence-based interventions.
In this section, general conclusions about the effectiveness of prevention programmes are drawn from reviews that summarise the results of numerous single studies. To demonstrate the potential impact of specific effective prevention interventions, the results of high-quality single efficacy studies are presented. The selection criteria were that the studies utilized research methods to eliminate alternative explanations of intervention effects (using intervention and control groups that were randomized) and had long-term follow-up of the intervention and control groups. Basics of prevention
There is no single cause of drug use and addiction. Drug use should be seen as an unhealthy behaviour linked to the developmental process. Although most drug use starts in adolescence, at least half of adolescents never experiment with drugs and some 20 per cent of them report past-month use of cannabis. |97| In this context, it is important to note that what occurs during adolescence very much depends on what happened earlier on in an individual's development, during childhood and early adolescence. For this reason, as shown below, drug prevention efforts can and should be targeted at earlier ages than adolescence.
FIG. 15. Factors increasing vulnerability to drug use
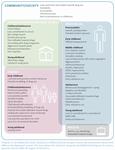
Click to enlargeSource: National Research Council and Institute of Medicine of the National Academies, Preventing Mental, Emotional, and Behavioral Disorders among Young People: Progress and Possibilities (Washington, D.C., The National Academies Press, 2009).
In addition, vulnerability to drug use is due to a variety of factors, whether stemming from the individual or from developmental contexts (see figure 15). The interplay between these factors ultimately either increases or attenuates an individual's vulnerability to substance use. This is why there is no "silver bullet" remedy for prevention, although multi-causality also offers many starting points for preventive activity. Evidence of different prevention interventions in settings significant to the target group — family, school, workplace, community, media and leisure settings — are presented in this section. These contexts are embedded in the wider society, where cultural norms and drug policies may also facilitate or discourage drug use. Indeed, as factors that promote drug use (such as availability of the drug or poor parenting and neglect) are often beyond the control of the individual, prevention works best if it acts both at the individual level and on the developmental contexts within which individuals evolve.
Individuals and groups vary in their risk of developing drug use because of its multi-causal nature. Groups with a higher risk, such as children with a substance dependent parent, should be approached in a different manner to population groups in which the majority does not tend to use psychoactive substances, such as school pupils. Prevention programming takes this into account by providing strategies for the population at large (universal prevention), for groups that are particularly at risk (selective prevention) and for individuals that are particularly at risk (indicated prevention, which also includes individuals that might have started experimenting and are therefore at particular risk of progressing to disorders). The impact of an intervention or policy depends on its effectiveness and how well it reaches the target group.
In many individuals, drug use is often only one of a number of risky behaviours that share several vulnerability factors. For example, many of the risk factors linked to substance use are also linked to outcomes such as violence, dropping out of school and risky sexual behaviour. Drug prevention addressing these common risk factors is thus also effective in preventing other risk behaviours. |98| Similarly, preventing other problem behaviour may yield positive results in preventing substance use. |99|
Although problem behaviour and drug use peak in adolescence |100| |101| they can be linked to very different developmental pathways. If it starts at all, problem behaviour starts during adolescence in the majority of youths, who then grow out of it during early adulthood. In such cases, drug use can be seen in the context of an unhealthy means of coping with developmental tasks and pressures specific to adolescence. By contrast, for a minority problem behaviour starts early and, if not addressed, is highly likely to persist throughout their lifetime. Such individuals are often characterized by a difficult temperament and externalizing or internalizing behaviours during childhood. Their drug use, which often begins in early adolescence, may be perceived as an expression of yet another facet of unhealthy behaviour that will change its characteristics over their lifetime.
FIG. 16. Different trajectories of cannabis use in late adolescence and young adulthood
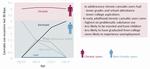
Click to enlargeSource: Schulenberg and others, "Trajectories of marijuana use" (2005).
The same behaviour (drug use in adolescence) thus has different sources — an observation to be considered when planning a prevention intervention. Figure 16 depicts different developmental pathways of cannabis use among students in the United States, |102| among whom a minority of early and persistent frequent users was identified (chronic users), whereas the majority only rarely or temporarily used cannabis or did not use cannabis at all. To test the differential perspective, researchers compared the early and chronic users to the remaining sample with regard to problems in other substance use (i.e. other than cannabis), problem behaviours and well-being. Chronic users were different in several ways, which supports the idea that they experience more (and ongoing) difficulties than other youths. In particular, during their high school years they achieved lower grades and had lower college aspirations, and had lower school attendance rates and worked more hours. Later, in early adulthood, they were less likely to be married, have children or have graduated from college, and were more likely to experience unemployment.
The developmental notion of drug use behaviour implies that prevention should incorporate not only drug-specific components, but also skills that help individuals to deal effectively with the challenges of each phase of life, such as relationship skills for adolescents or parenting skills for parents. In fact, drug prevention is aimed at supporting the safe and healthy development of children and youth, but may also include, when relevant, additional aspects specifically related to drugs around the age of drug use initiation.
Drug-specific prevention in younger population groups often targets tobacco and alcohol rather than other drugs. An understanding of drug use from a developmental perspective also explains why this kind of early prevention is a way to prevent substance use in young adulthood, including illicit drug use (such as cannabis or other drugs). First of all, epidemiological research indicates that one rarely finds a drug user without previous or concurrent use of tobacco or alcohol. |103| |104| Secondly, a large number of studies have shown that the earlier the use of a specific substance is initiated, the more likely it is that substance use disorders related to the specific substance are developed. Cross-substance analyses are rare, but in a high-quality study, a younger age at first alcohol and nicotine use was directly relevant for later initiation of cannabis use. |105| Thirdly, prevention effectiveness studies show that long-term preventive effects on use of cannabis, opioids, cocaine, "ecstasy", methamphetamines, non-prescription medicine or LSD in young adulthood can be explained by the fact that the participants of the programme initiated any substance use less often or less intensively in adolescence. |106| |107| Figure 17 illustrates a simplified model of long-term effectiveness in which participants in a family programme stayed on a less progressive track of drug use.
Settings for drug prevention and specific approaches that work
Family
The family-oriented prevention approach targets the setting that is most influential on the development of children and adolescents in general. Similarly, long-term observational studies tell us how important parental behaviour and attitudes are with regard to drug use, from pregnancy to young adulthood.
Examples of effective drug prevention efforts show that they start by providing adequate support to future parents who are burdened by their own drug use disorder, other mental health conditions or a socioeconomically disadvantaged life situation. Pregnancy is experienced as a time of uncertainty, but is also seen as a potential turning point towards a healthier lifestyle. Thus, prevention can take advantage of this special situation and (a) offer help with the various issues that these vulnerable groups are concerned with, and (b) motivate them to change their drug use behaviour. Positive preventive outcomes have been observed among children whose mothers were treated for substance use disorder and received parenting training during pregnancy. |108| Similarly, prenatal and infancy visits during which a trained nurse or social worker supports parents in need of help with health, housing, employment or legal issues, in addition to parenting challenges, have proved to be effective in improving the child's behaviour when it reaches adolescence. |109|
FIG. 17. Model of long-term effectiveness of developmental drug prevention programmes
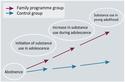
Click to enlargeSources: Spoth and others, "Universal intervention effects on substance use" (2009); and Spoth and others, "Replication RCT" (2014).
FIG. 18. Concurrent use of substances among adolescents in the United States who participated in a family programme

Click to enlargeSource: Trudeau and others "Longitudinal effects of a universal family-focused intervention" (2007).
Training programmes focused on parenting skills are a powerful tool, not only for populations at risk but also in the general population. In these programmes all parents are encouraged to raise their children in a warm and responsive manner and to become involved in their children's lives and learn how to communicate effectively with their children and enforce rules and limits. Drug-specific content in these programmes pertains to the parents' own substance use and, depending on the child in question's developmental stage, the expectations the parents have about the child's substance use and how to communicate about drug issues. Such interventions achieve positive preventive outcomes in the short and long run with regard to drug use and other problem behaviour. |110| |111|
Family programmes go one step further, by adding a child and family component to the parenting training. While parents are working on parenting skills, their children or adolescents learn how to improve their social and resistance skills, coping strategies, problem solving and decision-making. Specific to drugs, perceptions of the risks associated with use of drugs and social norms and attitudes towards drugs are discussed. Unique to this type of intervention is a subsequent family session, during which families are asked to communicate about controversial issues or resolve typical conflicts while organizing family leisure time. Family bonding activities are also part of the session. These programmes are expected to significantly lower the chance of initiating alcohol use (by roughly 30 per cent) and to reduce the frequency of alcohol use among participating adolescents. |112| Rare long-term studies reveal that four years after the start of an intervention, participants had a 25 per cent less chance of alcohol use than if they had not participated in the family programme. With regard to other drugs, one programme produced an effect on the methamphetamine use of students in the twelfth grade. |113| Although intervention effects are valid for girls and boys, as figure 18 indicates, the benefits appear to be even longer lasting for girls. |114|
These interventions may appear to require considerable resources in their implementation, yet they are worthwhile according to cost-effectiveness estimations in the United States. |115| Moreover, less intensive family-oriented efforts have also been shown to initiate preventive changes, though on a smaller scale. Such efforts should actively involve parents as much as possible and include developmental as well as drug-specific topics. |116|
School and education
In drug prevention, the school setting serves as an access path for measures promoting knowledge and personal and social skills of individuals to attenuate individual risk factors of drug use (see figure 15). However, targeting the school system itself also has preventive potential, if it succeeds in promoting school bonding as well as drug-free norms.
FIG. 19. Cannabis use, teenage pregnancy and tertiary education among young adults who participated in a pre-school intervention
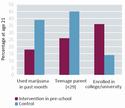
Click to enlargeSource: Campbell and others, "Early childhood education" (2002).
Pre-school development programmes not only improve cognitive skills and school readiness among children from underprivileged backgrounds, they also have an impact on tobacco and cannabis consumption during later adolescent years. Reducing cannabis consumption by between 7 and 23 per cent has been achieved when providing these kinds of interventions to children at risk in kindergarten or preschool programmes. |117| Figure 19 illustrates the results of a study in the United States, |118| in which, at age 21, the rate of current cannabis use was lower among young adults who had participated in a pre-school development programme than among a group of young adults who had a similar childhood but were not involved in the programme.
FIG. 20. Trajectories of internalizing and externalizing problem behaviour among students in Germany who received ongoing personal and social skills training in elementary school
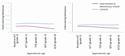
Click to enlargeSource: Maruska and others, "Influencing antecedents of adolescent risk-taking behaviour in elementary school" (2011).
FIG. 21. Probability of subsequent development of a drug-related disorder depending on participation in a classroom behaviour management programme in first grade
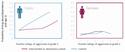
Click to enlargeSource: Kellam and others, "Effects of a universal classroom behavior management program" (2008).
At elementary school children benefit from a series of sessions during which they learn and practise a wide range of personal and social skills to improve mental and emotional well-being, as well as to help them cope with difficult situations. |119| |120| Due to the young age of this non-using, universal population, drugs are not yet mentioned, although preventive effects can be observed on aggressive behaviour and early smoking initiation, which are important predictors of later drug use. Participation in personal and social skills training during elementary school leads to a significant reduction in both these dimensions of childhood problem behaviour |121| compared with students in the control group.
Similarly, programmes that focus on improving the classroom environment yield positive drug-specific preventive outcomes, even if the primary focus is on academic and socio-emotional learning as well as addressing misbehaviour. Teachers are required to implement non-instructional classroom procedures in daily practices with all students, who in turn are rewarded for appropriate classroom behaviour. |122| Figure 21 illustrates that among young male adults from the United States the probability of substance-related disorders in early adulthood was significantly reduced by participation in a classroom behaviour management programme in first grade, particularly if they behaved aggressively at that time. |123| There was no such effect in the case of females.
Psychosocial life-skills education in early and middle adolescence is a prevention approach for a wide range of problem behaviours initiated in adolescence, including drug use. |124| |125| |126| Most programmes include interactive exercises to improve several personal or social skills, such as self-awareness, creative thinking, relationship skills, problem solving, decision-making and coping with stress and emotions. Specifically with regard to substances, awareness of social influences on drug use is enhanced through critical thinking exercises. Creative thinking is used to identify functional alternatives to drug use and communication skills are built so as to increase assertiveness in resisting offers of drugs. Drug information focuses on short-term negative consequences and on normative education (that is, addressing the often exaggerated perception that adolescents have with regard to prevalence of drug use among their peers). Analysis combining the results of studies (meta-analysis calculations) on the effects of school-based illicit drug use prevention programmes estimated 28 per cent less cannabis use as a result of prevention pro-grammes. |127| Greater effects were obtained when programmes targeted adolescents aged 14 or older, included elements from various prevention models incorporating social learning, information and value-clarification, used interactive methods, had more sessions, were of longer duration and were mediated by persons other than teachers. The life-skills approach also serves as an effective drug prevention tool for older adolescents with higher vulnerability for substance use, such as students who are considered at-risk of not graduating at the normal pace. |128|
FIG. 22. Extent of illicit drug use among adolescents who participated in a school-based positive youth development programme at age 12
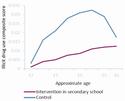
Click to enlargeSource: Shek and Yu, "Longitudinal impact of the project PATHS on adolescent risk behavior" (2012).
Note: Graph shows the extent of illicit drug use among adolescents in Hong Kong, China, who participated at age 12 in a school-based positive youth development programme compared with the extent of illicit drug use among those who did not participate.
These results corroborate the qualitative conclusion of a systematic review suggesting that "programs which develop individual social skills are the most effective form of school-level intervention for the prevention of early drug use" (cannabis and other drug use). |129| In contrast, presenting children with fear-arousing information is ineffective in this particular age group, as is focusing only on building self-esteem or emotional education. |130| It has been estimated that if adolescents aged 10 to 15 years receive a comprehensive programme, per month they drink alcohol on 12 days less and use cannabis on 7 days less than if they receive drug information only. |131| Figure 22 illustrates how a comprehensive positive development programme shaped illegal drug use among participants in Hong Kong, China. |132|
Computer-based universal prevention programmes without any teacher involvement have also been implemented in the school setting and have yielded effects in terms of less smoking and less alcohol use among participants. |133| Fully automated software leads students through a series of sessions in which they identify social influences and are animated to correct their false perceptions of social norms. Internet-based programmes of this kind may work outside the school context as well, but reaching the target group may be a challenge.
FIG. 23. Problem drinking among students with a risk of drug use who participated in a short, tailored skills-based prevention programme
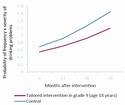
Click to enlargeSource: Conrod and others, "Effectiveness of a selective, personality-targeted prevention program" (2013).
In a study in the United Kingdom, middle-school students with an elevated risk level due to certain personality factors benefited from personal and social skills training tailored to the specific developmental challenges caused by their behavioural tendencies. |134| Figure 23 shows how substance use developed for ninth graders with elevated scores in anxiety sensitivity, hopelessness, impulsivity and sensation seeking and therefore with elevated risk for drug use, depending on whether they were offered a tailored intervention or not. The two-session programme included goal-setting exercises, education about coping strategies typical for those personality traits and healthy alternatives, behavioural management and changing dysfunctional beliefs that often accompany such traits. Although alcohol and drug use were only a minor focus of the intervention, problem drinking was less probable among participants after the intervention.
Apart from implementing individual-oriented interventions, preventive effects can also be achieved by targeting the general climate and drug-specific rules of schools. Feeling left out motivates people to act against conventional norms. As a major socializing agent, the school system has the potential to integrate marginalized students and facilitate positive development. With children at risk, school-bonding activities to improve school attendance and attachment to school, in addition to promoting learning of age-appropriate language and numeracy skills, may have a positive influence in terms of developing important protective factors for students in middle childhood. |135| |136| Overall, interventions that promote a positive school ethos and enhance student participation and commitment to school, conjointly with rules that strongly discourage drug use, may be an effective complement to drug prevention interventions addressing individual knowledge, attitudes and skills. The few existing studies show that this seems to work, especially for boys and for early adolescents. |137| |138| The consistent implementation of jointly developed behavioural standards with regard to drug use for all groups involved in school life, shapes social norms among students. By contrast, there is no evidence of preventive effects from random drug-testing at schools. |139| |140|
A significant number of young adults (the age group with the highest drug use rates in high income countries) can be reached in tertiary education settings. Moving away from home to college is often paralleled by increased substance use (see figure 15). Alcohol prevention measures, which are effective with this at-risk group of young people, are brief interventions. These interventions encourage a person to document and reflect on his or her own consumption patterns and provide feedback on the person's status relative to use of substances by peers. Brief interventions are effective when they are implemented in a face-to-face or computer-assisted format, as well as in individual or group formats. |141| |142| |143| |144| Interventions that challenge expectations of alcohol use are effective, especially with gender-homogeneous groups of college students. |145|
Workplace
Prevention programmes in the workplace typically have multiple components, including drug prevention elements and policies, as well as counselling and referral to treatment. Rigorous prevention effectiveness studies are rare in this setting; some have assessed individual interventions but none have evaluated comprehensive approaches aimed at changing the entire system. |146| Evidence from single studies is available with regard to alcohol use and suggests that alcohol education and stress management interventions, as well as personal or computer-based brief interventions, affect alcohol use or alcohol-related problems among employees. Availability of alcohol in the workplace is associated with alcohol use, so restricting access to alcohol and setting strict and unambiguous alcohol policies may prevent the drinking of alcohol before going to work, on the job and during breaks.
Community
The community can provide a preventive developmental context by setting clear standards with regard to the use of drugs, along with providing opportunities for adolescents to learn skills and to contribute to community life and be recognized for their contribution. Opportunities, skills and recognition strengthen bonding with family, school and community. Tight bonds motivate young people to adopt healthy standards of behaviour.
Community-wide interventions for the general population
Preventive effects were evidenced in programmes that incorporate multiple components in the community, especially when relating to alcohol but less consistently when relating to tobacco and cannabis use. |147| |148| |149| The minimum set-up is a combined approach of a school and a family intervention embedded in the structure of an organized community coalition. The coalition decides which evidence-based programmes to implement in the community. Some programmes do this on the basis of assessing a need that has been indicated by a student survey on risk and protective factors.
FIG. 24. Cannabis use among at-risk students from school districts implementing a family programme in sixth grade and life skills programme in seventh grade
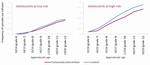
Click to enlargeSource: Spoth and others, "PROSPER community-university partnership delivery system effects on substance misuse" (2013).
Note: High risk among adolescents was initiation of alcohol, cigarette or cannabis use prior to baseline; low risk meant no initiation of substance use at baseline.A universal community prevention model that originated in the United States and has since become international, supports and trains local coalitions of stakeholders to select and implement evidence-based prevention programmes targeting community-specific elevated risks for problem behaviours among adolescents. Six and a half years after the project had begun, youths exposed to this community initiative were 31 per cent less likely to have ever used alcohol, cigarettes or cannabis. |150|
FIG. 25. Extent of methamphetamine use among young adults who participated in a family and a life-skills training programme

Click to enlargeSource: Spoth and others, "Long-term effects of universal preventive interventions on methamphetamine use among adolescents" (2006).
Figure 24 indicates that cannabis use expands less and later during adolescence in university-school-community partnership districts in the United States. These districts provide a family programme in the sixth grade (13 to 14 year-olds) and a life skills, social influence or normative school programme in the seventh grade (14 to 15 year-olds) delivered in the framework of a university-community-school partnership. |151| Figure 25 shows the difference in methamphetamine use in twelfth graders aged 19 to 20 years depending on whether they were involved in both the family and the school programmes or only in the school programme within the community partnership, or were in a school district that was part of the control group.
Multi-sectorial interventions for vulnerable populations
FIG. 26. Differences in drug use among vulnerable boys who participated in a skills training programme for students and their parents
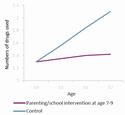
Click to enlargeSource: N. Castellanos-Ryan and others, "Impact of a 2-year mul-timodal intervention for disruptive 6-year-olds on substance use in adolescence: randomised controlled trial", The British Journal of Psychiatry, vol. 203, No. 3 (2013), pp. 188-195.
Family-school approaches without a community component that are specifically designed for children at risk are also effective. The most prominent individual predictor of later substance use disorders in childhood is disruptive behaviour facilitated, inter alia, by poor impulse- and self-control and aggressiveness (see figure 26). From a developmental point of view, these characteristics hamper rewarding situations and relationships at school, in the family and with friends, and thus elevate the risk of alienation from conventional contexts. Alienated adolescents may have a tendency to turn to peers with deviant norms, which then facilitates maladaptive behaviour, including drug use. Therefore, targeting externalization of problems or disorders during childhood represents an important strategy for prevention not only of drug use but also of disruptive, antisocial and delinquent behaviours, as well as for addressing problems related to academic performance and dropping out of school. These training programmes or treatments allow parental or even familial involvement to be effective. Figure 26 shows the effect of social skills training at school with boys aged 7 to 9 years that was combined with parenting training during family visits in late adolescence. Further results of the study suggest that participants reported less drug use because of the programme's support in lessening their impulsivity and antisocial behaviour and promoting making friends with less deviant peers. In addition, increased parental supervision contributed to the preventive effect of the programme.
Alcohol and tobacco policies
As mentioned in the preceding sections, a younger age at first alcohol and nicotine use was related with later initiation of cannabis use; thus, the prevention of alcohol and tobacco use is also relevant to the prevention of drug use. In this context, policies that increase prices (and thus manipulate affordability) and restrict access to these substances have been found to be very effective. From a tobacco price increase of 10 per cent, a reduction of 4 per cent in tobacco consumption can be expected. |152| Similarly, a 10 per cent price increase is estimated to decrease heavy alcohol consumption by 5 per cent among older adolescents and even decrease binge drinking among young adults by between 9 and 35 per cent. |153| In addition, study results in the United States consistently show that raising the minimum legal drinking age and enforcing its regulation reduces alcohol consumption and alcohol-related accidents while lowering the legal drinking age increases use and related problems. |154|
Leisure, sports and entertainment venues
Unlike school and family settings, recommendations for interventions in other areas of community life cannot be made based on the same level of evidence. The effectiveness of specific drug prevention efforts in leisure settings, for example peer education programmes at festivals or activities in sports clubs, has not yet been studied in depth. This may be surprising as peer education programmes are widely used in drug prevention and other prevention domains. |155| Sports clubs have been described as both a setting with great potential for promoting good health and a risk environment for drug use, |156| but effectiveness studies are not available. Furthermore, providing low-resource-intensive leisure activities to children and youths is a popular non-drug-specific prevention intervention, but these activities have not been empirically studied with regard to their effect in attenuating substance use or risk factors of substance use. Theoretically, they may in fact constitute an element of a healthy developmental context. Nevertheless, whether they yield drug use preventive effects remains unknown. Research on the effectiveness of after-school programmes that aim to promote personal and social skills points to the fact that risky behaviours in general, including drug use, can be prevented but only under certain conditions, that is, if they use a connected and coordinated set of activities, as well as interactive methods, have at least one component devoted to developing personal or social skills and explicitly target the skill in question. |157| In this scenario, after-school programmes are more of a setting to deliver life skills education than a separate programme.
Mentoring programmes are another approach among after-school programmes. Lay adults spend structured leisure time with a child or adolescent on a weekly basis. With adolescents at average risk, modest preventive effects were observed for general risk behaviour, including drug use. |158| Mentoring programmes for groups with a high proportion of minority and underprivileged adolescents can be expected to reduce the risk of alcohol use initiation among the mentees by 29 per cent, whereas effects on other drug use are rare. |159|
Most prevention programmes utilizing entertainment venues have multiple components, including different combinations of training of staff and managers on responsible beverage service and management of intoxicated patrons; changes in laws and policies, for example with regard to serving alcohol to minors or to intoxicated persons or with regard to drinking and driving; high visibility enforcement of existing laws and policies; communication to raise awareness and acceptance of the programme and to change attitudes and norms; and offering treatment to managers and staff. Training of staff, policy interventions and enforcement may reduce intoxication. |160| |161| Although community support through training servers of beverages in nightlife settings or of vendors of cigarettes may succeed in educating commercial suppliers of alcohol and tobacco, preventive effects at the community level can only be expected to be successful if regulations are enforced, that is controlled and sanctioned. |162| |163| |164|
Health sector
FIG. 27. Frequency of cannabis use by adolescents and young adults after receipt of a brief intervention in a paediatric emergency room
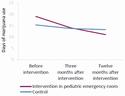
Click to enlargeSource: Bernstein and others, "Screening and brief intervention to reduce marijuana use among youth and young adults in a pediatric emergency department" (2009).
The community health sector can prevent progression to substance use disorders (when it is in touch with individuals already using drugs) by providing brief interventions. In the few, short and structured sessions of these interventions, trained health or social workers first identify whether there is a problem of substance use and then provide basic counselling or referral to additional treatment. Brief interventions work in many settings (school or medical or community-based treatment centres) if they target cannabis use and follow the motivational enhancement approach. |165| |166| It differs from other treatment interventions in that its purpose is not to impart information or skills; rather, it picks the client's general and drug-specific goals as a central theme for promoting ambivalence and readiness to change while supporting the person's autonomy. Figure 27 demonstrates the effectiveness of a brief motivational intervention after 12 months, conducted in the United States by peer educators during a visit to a pae-diatric emergency department, to negotiate abstinence or reductions in cannabis use and its related consequences among 14 to 21 year olds. |167| Adolescents and young adults used cannabis less frequently if they received the brief motivational intervention.
Media
On a societal level, besides availability and afffordability, norms favourable to drug use constitute a risk factor for drug use (see figure 15). As already described, afffordability and availability may be influenced by enforcement of laws and regulations. Laws and regulations may also be understood as formal expressions of social norms. Children, adolescents and young adults face norms of drug use informally by means of approval or disapproval expressed by peers, parents, teachers, neighbours and other community members. Media campaigns are a way to influence these informal social norms. Awareness campaigns or expanding media coverage to increase awareness of and focus on drug-related issues are often one component of state or community programmes and there are positive indications regarding their effect on tobacco consumption. |168| Nevertheless, campaigns cannot be expected to influence drug use behaviour directly. Although observational data suggest that methamphetamine deterrence campaigns in the United States are paralleled by a reduction in current drug use in the teenager cohort, these results are not corroborated by rigorous studies. |169| Anti-illicit-drug public-service announcements in traditional and new media demonstrated no significant effect on drug use in high quality effectiveness studies and may even be harmful by weakening anti-cannabis norms among young target groups. |170|
The way forward
The scientific evidence reviewed and presented in this section illustrates that effective and feasible interventions and policies are available for drug prevention. However, the gaps in both evidence and effectiveness research point to the fact that more evaluation of impact is needed. Reaching those groups with heightened vulnerability remains a challenge, while the question of how to adapt interventions developed in optimal conditions to real-life, local contexts has not yet been fully answered.
Many activities labelled as drug prevention are not evidence-based, their coverage is limited and their quality unknown at best. Among other international organizations, UNODC has tried to fill this evidence gap through its International Standards on Drug Prevention, which clearly identify interventions and policies that work and the characteristics that are linked to positive prevention outcomes. In addition, the EMCDDA European Quality Standards of Drug Prevention provide support in how to implement quality interventions and other remarkable tools have also been developed.
In summary, countries need to move away from a model in which prevention of drug use is delivered by isolated but well-intentioned individuals who improvise in delivering interventions. Based on the specific situation, interventions should employ and expand the use of evidence-based tools systematically, supporting practitioners and policymakers in developing their knowledge, skills and competencies and building a critical mass of genuine prevention specialists capable of promoting the safe and healthy development of children, youth, families and communities through effective prevention of drug use.
Treatment of drug use disorders and dependence
FIG. 28. Global extent of drug dependence treatment services, by region
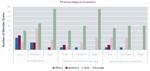
Click to enlargeSource: Annual report questionnaire, part II (Member State responses on treatment of drug dependence in 2013).
FIG. 29. Global extent of drug dependence treatment services, by region
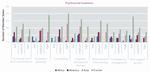
Click to enlargeSource: Annual report questionnaire, part II (Member State responses on treatment of drug dependence in 2013).
FIG. 30. Global extent of drug dependence treatment services, by region
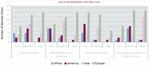
Click to enlargeSource: Annual report questionnaire, part II (Member State responses on treatment of drug dependence in 2013).
With an estimated global average of one in six people who suffer from drug-use disorders or drug dependence receiving treatment each year, it is clear that the accessibility and availability of services for such conditions are limited in most countries. |171| The fact that this figure is approximately 1 in 18 in Africa, compared with 1 in 5 in Western and Central Europe, however, points to large disparities between regions. Not included in these figures is the large proportion of drug users who may not be dependent but may still require interventions to prevent an escalation in their disability and comorbidity related to drug use.
Disparities between regions also exist in the principal drugs for which drug users receive treatment, with cannabis being the principal drug reported in Africa, cannabis, cocaine and to a lesser extent opioids in North America, and cocaine and cannabis in Latin America. In Asia, opi-oids remain the principal drug type for which drug users receive treatment, followed by ATS and cannabis. In Europe, opioids are followed by cannabis, cocaine and ATS, while in Oceania cannabis is followed by opioids and ATS. It should be noted, however, that while treatment demand highlights the main substances of concern, it also reflects the nature of available drug treatment services.
Although regional differences in the availability of different interventions exist, psychosocial interventions, particularly counselling and social assistance services, are more readily accessible and available globally than other interventions. Indeed, more than a third of countries reported the availability of psychosocial, rehabilitation and aftercare services whereas less than a quarter reported the availability of pharmacological interventions (see figures 28-30).
It is difficult to determine the quality of different types of intervention available at the global level, but there is a greater level of pharmacological and psychosocial services and interventions in Europe than in other regions, particularly Western and Central Europe, where higher levels of opioid substitution also reflect the fact that opioids are the major substance for which drug users receive treatment in the region. In other regions, Governments may not yet be ready to address drug dependence with pharmacologically assisted treatment, leading to limited coverage of such programmes.
In Africa, the fact that counselling is more available than other types of intervention could be due to cannabis being the most common substance for which drug users receive treatment. However, most drug treatment services in the region are provided in specialized psychiatric hospitals, which may explain why there is a considerable number of interventions in the treatment of psychiatric comorbidities in Africa, although the lack of other types of intervention in Africa may also indicate limited responses to treatment needs in general.
Not only are available services for the treatment of drug use disorders and dependence limited in most countries, there is an overall lack of provision of a continuum of care in interventions to address drug use disorders and drug dependence adequately among those in need of these interventions. An outline of what drug treatment actually entails, particularly when considered a chronic condition, and how it should be measured for effectiveness is provided in this section.
Philosophy of chronic care versus acute care: continuity of interventions
Scientific evidence indicates that the development of drug use disorders and dependence is a result of a complex multi-factorial interaction between repeated exposure to drugs and biological and environmental factors. In recent decades, important advances have been made in understanding drug dependence as a complex, multifaceted and relapsing chronic condition. Such a condition therefore requires continuing care and interventions from many disciplines. |172|
These findings have led to increased interest in the development of effective prevention and treatment strategies. |173| It is now known that drug use disorder is a preventable and treatable health problem, and effective, comprehensive and multidisciplinary interventions are available to respond to the different needs of affected individuals. |174| It is critically important, however, to appreciate the chronic nature of the disorder, together with the fact that chronic conditions cannot and should not be treated like acute disorders, for which contemporary medical science has provided indisputable evidence. |175|
There are fundamental differences in the philosophies relating to the treatment of acute and chronic conditions. Acute conditions such as bacterial infections, appendicitis and broken bones, tend to have a clearly identifiable cause (for example an infectious agent, physical trauma, etc.) and can be treated in a relatively short period of time. The symptoms of acute disorders may be intense and disruptive, but people who are treated generally recover with no lasting deterioration of functional capabilities. An individual may break another bone or get another infection, but this is considered a new occurrence, not a relapse. Treatment services for acute disorders are typically delivered in a series of isolated activities — screening, admission, single point-in-time assessment, treatment procedures, discharge and brief "aftercare" followed by the termination of the service relationship. The individual, family or community is given the impression at discharge that "cure has occurred", which is often the case. Long-term recovery is then self-sustainable without ongoing professional assistance. |176| |177|
By contrast, chronic health problems such as diabetes, asthma and hypertension are influenced by multiple biological, psychological and social factors, some of which cannot be clearly identified. Lifestyle or personal behavioural choices are often intimately involved in the onset and course of these disorders. |178| There are many effective treatments for chronic disorders, but they tend to be more complex and protracted than acute treatments and do not often result in a "cure" or the same outcome as the treatment of acute conditions. Yet multiple treatment interventions for chronic conditions have been found to be very effective. Treatment of these chronic conditions share three important features: |179|
(a) They can usually remove or reduce symptoms without necessarily removing the root causes of a disease. For example, beta blockers reduce blood pressure and insulin improves the body's ability to digest sugars, as long as the affected individual continues the treatment, i.e., continues taking the medicine;
(b) Treatment of all chronic conditions requires significant changes in behaviour and lifestyle on the part of the patient in order to maximize their benefit. Again, even if individuals with diabetes regularly take their insulin as prescribed, the disease progression will continue if they do not also reduce their intake of sugar and increase physical exercise;
(c) Because of the complexity of the factors that can lead to a chronic illness and the need for ongoing medical care and lifestyle change, it is not surprising that relapses are very likely to occur in all chronic illnesses.
For these reasons, most contemporary treatment strategies in chronic illness involve regular monitoring of medication adherence, coupled with encouragement and support for pro-health behavioural changes as well as support by trained family members, to provide continuing monitoring and assistance for the behavioural changes necessary to sustain good quality of life. Consequently, "nothing less" must be provided or can be effective for the treatment of drug dependence than a qualified, systematic, science-based approach, similar to treatment of other chronic health problems such as diabetes or hypertension.
Is drug treatment better than no treatment?
Effectiveness of treatment
For over four decades scientific research has shown that effective treatment for drug-use disorders has helped drug-dependent individuals to halt their consumption, prevent relapse, reduce their involvement in crime, change other dysfunctional behaviour and make a positive contribution to their family and community. |180| Effective treatment typically incorporates many components — pharmacotherapy, behavioural therapy and social support — each directed towards a particular aspect of the disorder and matching an individual's particular problems and needs. |181|
Treatment programmes for women
Research indicates that current addiction treatment programmes can be effective for different age and gender groups. |182| Studies that have reviewed treatment programmes for women indicate that women who are enrolled in gender-specific programmes, which in addition to pharmacotherapy and behavioural therapy address their unique treatment needs, have better treatment outcomes and improvements in important areas of their lives than those women who are in non-gender-specific programmes. These interventions may include addressing psychosocial issues that are more prevalent among women such as child care and employment support, family issues, psychiatric comorbidities, and psychological issues such as child abuse and trauma, victimization. |183| |184| |185|
Treatment programmes for adolescents
The findings of several large studies |186| |187| clearly indicate that treatment programmes can decrease drug and alcohol use, improve school performance and reduce the nature and extent of problem behaviours. The National Institute on Drug Abuse supported Drug Abuse Treatment Outcome Studies for Adolescents (DATOS-A) reviewed 23 community-based adolescent treatment programmes, which in essence addressed peer relationships, educational concerns and family issues such as parent-child relationships and parental substance use. They also included elements of adult treatment programmes, such as participation in group therapy and in a 12-step programme. Adolescents who participated in these treatment programmes have reported improved psychological adjustment, and longer stays in treatment produced more favourable outcomes in several of the criteria. However, strategies specific to adolescents are needed to improve their treatment retention and completion in order to maximize the therapeutic benefits of drug treatment. |188|
Cost and benefit of treatment
An apparent major benefit of drug treatment, aside from the recovery of the patient and the subsequent health and social implications, is the element of cost, as research studies indicate that spending on treatment is cost-effective. |189| |190| |191| At the least, the ratio of saving to investment is 3:1 (for every dollar invested three are saved), and when a broader calculation of costs associated with crime, health and social productivity is taken into account, the rate of savings to investment can rise to 13:1. |192|
When the cost of each option is weighed up, it can be shown that drug treatment is less expensive than either incarceration or a complete lack of treatment. |193| Drug treatment is cost-effective in reducing drug use along with its associated health and social costs and it is also less expensive than the alternatives, such as not treating addicts or simply incarcerating dependent users. For example, in the United States the average cost of one full year of metha-done maintenance treatment is approximately $4,700 per patient, whereas one full year of imprisonment costs approximately $18,400 per person. |194| In the United Kingdom, it is estimated that, with under 165,000 people in treatment for heroin and/or "crack" dependency, an estimated 4.9 million acquisitive crimes such as burglary, robbery and shoplifting were prevented during 2010-2011. |195|
Although many treatment activities can be initially resource intensive, every dollar invested in treatment yields up to 10 dollars in reduced costs in lost productivity, use of social services and criminality. |196| When savings related to health care are included, total savings can exceed costs by a ratio of 12 to 1. Major savings to the individual and society also come from significant drops in interpersonal conflicts, improvements in workplace productivity and reductions in drug-related accidents.
Why drug treatment is often perceived to be ineffective
The scientific evidence is clear that the best available treatments for individuals with drug dependence are those that are ongoing, able to address multiple problems in numerous life domains — such as medical and psychiatric symptoms and social instability — and are well integrated into the community, making them available and accessible to such individuals.
One major difference in the perception of their inefffec-tiveness is that drug dependence treatments are not provided and evaluated under the same assumptions that pertain to other chronic illnesses. Particularly important in this regard is that drug dependence treatments are rarely delivered under a continuing care model that would be appropriate for a chronic health problem. Indeed, with the exception of methadone maintenance and the 12-step approach, most contemporary treatments for drug dependence are acute care episodes.
It is common for a drug dependent individual to be admitted to a 30 to 90 day outpatient rehabilitation programme, |197| rarely accompanied by medical monitoring or medication. This period of treatment is typically followed by discharge and while the intentions and overall goals of treatment might be conceptualized as ongoing by those in the treatment field, operationally addiction treatments are delivered in much the same way as one might treat a patient with a broken bone or with an acute infection.
Outcome evaluations tend to be conducted 6 to 12 months affter treatment discharge. A major (and sometimes exclusive) measure in all such evaluations is whether patients have been continuously abstinent since leaving treatment. In other words, policymakers and society in general generally ignore the fact that during treatment patients are most likely to experience significant symptom (compulsive drug use) decrease and an improvement in psychosocial functioning, with treatment effectiveness only being measured based on pre- and post-outcomes, an approach that is applicable for the treatment of acute conditions.
If these goals and this treatment/evaluation strategy were applied to a hypothetical hypertension treatment regime, patients who meet diagnostic criteria for hypertension would be admitted to a 30-to-90 day outpatient "hypertension rehabilitation" programme where they might receive medication, behavioural change therapy, dietary education and an exercise regime. Because of some ideological limits and evaluation goals, the medication would be tapered during the final days of the treatment and patients would be referred to "community sources". The evaluation team would re-contact the patient six months later and determine whether the patient continuously had normal blood pressure throughout the post-treatment period. Only those patients who met this criterion would be considered "successfully treated". Clearly, this hypothetical treatment management strategy and its associated outcome evaluation approach would be absurd if applied to any chronic illness, including drug dependence.
As in the case of hypertension, symptoms of drug use disorder remain under control during the course of treatment. However, as the severity of the problem and symptoms reappear once patients are out of treatment, the effectiveness of treatment can only be measured during treatment and not once it is over. How to measure success in treatment
As discussed in the previous section, traditionally treatment of drug dependence has been seen in the context of acute care and a simple recovery/rehabilitation oriented model, which assumed relatively short interventions and services after which the patient is considered successfully treated, discharged and expected to continue their recovery. |198| As noted by McLellan and colleagues: |199| "Typically, the immediate goal of reducing alcohol and drug use is necessary but rarely sufficient for the achievement of the longer-term goals of improved personal health and social function and reduced threats to public health and safety — i.e., recovery." Moreover, as noted by the Betty Ford Institute Consensus Panel on "what is recovery", unlike the term "cancer survivor", for instance, the term "in recovery" has not been clearly defined and may not be well understood by the public. |200|
Consequently, the traditional method of evaluating treatment outcomes has been to contact patients after certain intervals and assess if the person has retained those positive changes, including "cessation of drug use" following discharge. As research has shown, the majority of patients relapse following cessation of treatment, giving rise to the interpretation that available treatment of drug dependence is not effective.
As substance-use disorders are increasingly viewed as chronic conditions, drug dependence treatment services have also adopted models that aim to assess effectiveness of interventions and the impact of the health problem on the person's overall well-being regularly over the course of treatment.
The different treatment outcome domains identified as relevant to both the patient and to society include: |201| |202| |203|
(a) Reduction in substance abuse; increase or improvement in personal health including physical and psychological improvements (including spiritual);
(b) Improvement in social functioning, including employment, family and social relationships;
(c) Reductions in behaviours that are a threat to public health and safety or that are associated with the spread of infectious diseases or with personal and property crimes.
It has therefore been suggested that outcome evaluations of addiction treatment should use clinical and social behavioural indicators with repeated measurement procedures commonly used in chronic medical conditions as part of standard treatment delivery. |204|
Treatment in primary health-care settings
Drug use is one of the top 20 risk factors for poor health worldwide and among the top 10 in developed countries. Drug use disorders are associated with an increased risk of other diseases such as HIV/AIDS, hepatitis, tuberculosis and cardiovascular diseases, as well as suicide and overdose deaths. Injecting drug use is a major conduit of HIV and hepatitis transmission in many regions. |205| Additionally, individuals with drug use disorders have health-care costs that are nearly twice as high as those of patients without such disorders, which contributes to the growing cost of health care. |206|
Despite the availability of effective treatments, most individuals with drug use disorders have never been treated. |207| A big gap exists between the number of people who want or could benefit from treatment for drug use disorders and the number of people who actually receive services. |208|
There are many reasons for this, with one of the key factors being the difficulties in accessing treatment due to insufficient integration of substance use disorder services in mainstream general health-care delivery. This lack of integration is a problem because so many individuals who need drug treatment services also need other health services. This problem is particularly severe for vulnerable groups who have limited or no contacts with health-care providers.
However, the data show that individuals are seldom screened for drug-related problems by their primary-care physicians. |209| The failure of providers to identify drug use issues is typically due to reluctance to deal with these illnesses, and remains one of the most common obstacles to early diagnosis and treatment. |210| Contributing factors include inadequate medical training to deal with drug use disorders, a belief that there is no effective treatment, insufficient time during the visit and a general feeling of inadequacy. |211| |212|
Providing screening and initial services in primary healthcare settings is feasible; |213| |214| and it can reach many more individuals than can reliance on specialized treatment alone, promises better outcomes for patients |215| |216| and can result in reduced overall health-care costs. |217| Early detection of drug-related problems can facilitate treatment and, ultimately, a reduction in the significant disability and comorbidity that accompany these disorders. Therefore, it is critical for primary-care practitioners to recognize and effectively respond to patients with drug use issues.
The first step is screening and assessment that will enable the integration of clinical findings into a potential diagnosis of drug use disorders. The timing of the diagnosis is critical, since early intervention, before severe complications have happened and a patient's relationship with the drug becomes stronger than relationships with family and friends, is the most effective. |218| Once a diagnosis of drug use disorder has been established, an intervention can either be implemented by the primary health-care practitioner, or patients can be referred to the appropriate specialist for treatment. While a specialty treatment programme remains the gold standard, various studies demonstrate that a primary health-care role in early intervention is essential to the success of any treatment. |219| |220| |221| |222|
Targeted brief interventions can be effective primary-care treatment models, as demonstrated by studies on brief office-based interventions. |223| |224| Studies evaluating the effectiveness of integrating primary medical care with addiction treatment have demonstrated cost benefits and improved medical outcomes. |225| For example, patients with primary-care connections were shown to be less likely to seek expensive emergency department and hospital services, |226| while for every dollar invested in evidence-based integrated treatment, up to six dollars are saved in terms of costs for health, security and welfare.
Efforts to integrate substance use disorder services with primary care face significant barriers, many of which arise at the policy level. Integrating drug treatment with mainstream primary health-care delivery, expanding and developing specific competencies in primary health-care practitioners, enabling same-day services, improving access to medications and improving access to specialty care should be the global priorities.
FIG. 31. Global trends in main indicators of drug supply and drug supply reduction, 2005-2014
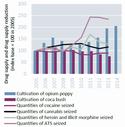
Click to enlargeSource: UNODC, responses to annual report questionnaire and other official sources.
FIG. 32. Distribution of global seizures, by drug and region (number of cases), 2005-2008 and 2009-2013
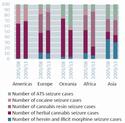
Click to enlargeSource: UNODC, responses to annual report questionnaire and other official sources.
The regions in which the cultivation and manufacture of drugs take place have not changed. Herbal cannabis production occurs in most countries worldwide, while the production of cannabis resin remains confined to a few countries in North Africa, the Middle East and South-West Asia. |227| In South America, three Andean countries continue to account for virtually all global cultivation of coca bush, while the vast majority of illicit opium poppy cultivation worldwide remains concentrated in two countries in Asia. The manufacture of synthetic drugs is difficult to assess in a quantitative way, but there are reports of the manufacture of ATS in all regions. The emergence in recent years of a large number of NPS |228| has increased the range of synthetic drugs available on the market, but it is difficult to ascertain whether these substances are replacing existing drugs under international control.
Cannabis continues to be the most-seized drug worldwide, both in terms of the number of seizure cases and actual quantities intercepted. This is probably due to the fact that the cannabis market is the largest drug market globally with an extremely extensive web of trafficking flows.
With the exception of heroin/illicit morphine and ATS, overall quantities of drugs seized in the past decade have remained relatively stable. A peak in heroin/illicit morphine seizures was reported in 2011, which initiated a period of much higher levels of seizures, driven by increased interceptions in Asia. Interceptions of ATS increased continuously from 2003 to 2013 in all regions, with the exception of Europe, where they remained stable. This may suggest the expansion of the ATS market to locations where some of these substances were not previously available.
INTERPRETING DRUG SEIZURES A direct indicator of counter-narcotics law enforcement activity, drug seizures are the result of those successful operations that end in drug interceptions, and are thus influenced by law enforcement resources and priorities. At the same time, seizures are one of the key elements that help to establish the size of drug markets, drug availability and trafficking patterns and trends, particularly if broad geographical entities are considered and long periods are analysed. For example, the expansion of the cocaine market in Europe from the mid-1990s to the middle of the first decade of the 2000s was reflected in rising cocaine seizures. Similarly, the 2001 "heroin drought" in Australia and the sharp decline in the cocaine market in the United States from 2007 to 2012 were also reflected in falling seizures.
Seizure information can serve as a powerful market indicator, particularly if triangulated with other data such as drug prices and purity. Falling seizures in combination with rising drug prices and falling purity levels may suggest a decline in overall drug supply, while rising seizures in combination with falling drug prices and rising purity levels are usually considered a good indicator of an increase in drug supply. However, rising drug seizures in combination with rising drug prices and falling purity levels may suggest intensified law enforcement activity and thus a potential overall decline in drug supply.
It should be noted that reported seizures relate to events that took place in the past and in specific locations. In an environment where drug traffickers adapt quickly to changing risks and opportunities, drug trafficking patterns and flows derived from seizure data do not necessarily reflect the current modus operandi of traffickers in every detail. At the same time, experience has shown that some of the main drug-trafficking routes, once established, can prove rather resilient to change.
FIG. 33. Quantities of heroin and illicit morphine seized, by region, 2003-2013
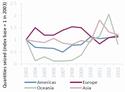
Click to enlargeSource: UNODC, responses to annual report questionnaire and other official sources.
FIG. 34. Quantites of cocaine seized, by region, 2003-2013
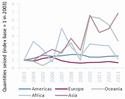
Click to enlargeSource: UNODC, responses to annual report questionnaire and other official sources.
Large variations in average size of drug seizures
FIG. 35. Quantities of herbal cannabis seized, by region, 2003-2013
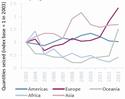
Click to enlargeSource: UNODC, responses to annual report questionnaire and other official sources.
FIG. 36. Quantities of cannabis resin seized, by region, 2003-2013
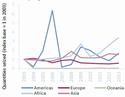
Click to enlargeSource: UNODC, responses to annual report questionnaire and other official sources.
FIG. 37. Average size of heroin/illicit morphine seizure cases, by region, 2003-2013
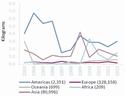
Click to enlargeSource: UNODC, responses to annual report questionnaire and other official sources.
Note: The figures provided between brackets refer to the number of heroin/illicit morphine seizure cases for 2013.With an average size of less than 1 kg per case over the past five years, seizures of heroin/illicit morphine and ATS are the smallest among all the drug types at the global level. The largest are seizure cases involving herbal cannabis (roughly 10 kg on average), while the average size of seizures of cocaine and cannabis resin is 5 kg and 3 kg, respectively. These differences may result from variations in trafficking modus operandi, whereby cocaine and cannabis products are smuggled in larger shipments than other drugs. Law enforcement may also target different levels of the supply chain depending on the drug. However, other elements such as drug price, market size, value and structure, the dynamics and structure of drug supply chains, as well as law enforcement priorities, would have to be explored before drawing clear conclusions on this subject.
The average size of seizure cases of all drugs, except ATS, has decreased in the past decade. This may reflect changes both in the targeting of law enforcement efforts and in trafficking patterns along the supply chain, but may also be the result of improved reporting of small seizure cases in some regions. The average size of seizures of a number of products decreased slightly between 2003 and 2013: heroin/illicit morphine decreased from 0.7 kg to 0.5 kg; cocaine decreased from 6.2 kg to 4.6 kg; and cannabis resin decreased from 4.3 kg to 3.9 kg. However, the average size of herbal cannabis seizures decreased substantially, from 23 kg to 7.8 kg, whereas the average size of ATS seizures doubled over the period, from 0.3 kg to 0.7 kg.
The Americas is the region where seizure cases are the largest on average. In the past five years, seizures of herbal cannabis in the region averaged 41 kg, while seizures of cocaine averaged 13 kg, seizures of ATS averaged 8 kg and seizures of heroin/illicit morphine averaged 3 kg; all significantly larger than in all other regions. It is worth noting, however, that the average size of seizure cases of all drugs in the Americas has decreased in the past decade, as has the number of seizure cases, with the exception of ATS, possibly suggesting an expansion of the ATS market in that region and comparatively greater targeting of ATS trafficking by law enforcement.
At the other end of the scale, the smallest seizures, in terms of their average size, are reported in Europe, irrespective of drug type. In the past five years, seizures of cannabis resin averaged 1.7 kg per case in the region, while seizures of cocaine averaged 0.8 kg, seizures of herbal cannabis averaged 0.6 kg and both heroin/illicit morphine and ATS seizures averaged 0.2 kg. The small size of seizures in Europe may be due to law enforcement focusing more on the middle and lower end of the supply chains of all drug types than on the upper end, but it could simply reflect better reporting of seizure cases in general, and of small cases in particular.
Emergence of new trafficking hubs |229|
South America remains the main departure hub for cocaine to the rest of the world. The cocaine-producing countries, Bolivia (Plurinational State of), Colombia and Peru, serve as departure (and transit) countries for the export of cocaine to the rest of the region. A number of other countries may serve as transit points for trafficking cocaine from Latin America to the major consumer markets in North America and Western and Central Europe, but Brazil (particularly since 2010) and Argentina are the cocaine transit countries most frequently mentioned in major individual drug seizures.
The Netherlands, Morocco and Spain have been mentioned in individual drug seizures as the main departure or transit countries for cannabis over the past decade as a whole and continue to be so when considering more recent trends during the period 2010-2014. Albania and Argentina have emerged respectively as cannabis departure or transit countries in the past five years, confirming that cannabis cultivation and production are dynamic and widespread, and that trafficking routes may be in constant change.
Heroin is produced in three different regions, but while there is information from reports of individual seizures on the trafficking routes for heroin from Afghanistan, available data do not currently allow for the identification of the transit countries used in the trafficking of heroin from Colombia and Mexico or from the Lao People's Democratic Republic and Myanmar. Pakistan is mentioned in individual drug seizure reports more frequently than other countries as a transit country for heroin seized elsewhere. This confirms that Afghan heroin is smuggled southwards from Afghanistan through Pakistan, but it may also suggest that this trafficking route is more successfully targeted by law enforcement in destination countries and/or that data reporting on the last departure country of the shipment seized is comparatively better for this route than for others.
Although opium poppy is cultivated in South-East Asia, individual drug seizures indicate that neither of the opium-cultivating countries in the region, the Lao People's Democratic Republic and Myanmar, appears to be an important heroin trafficking departure hub. This may be due to the fact that Afghan heroin dominates the global market, but it may also reflect the fact that countries that report individual seizures are not markets for heroin produced in South-East Asia.
Most seizures are made on road and rail, but the largest seizures are made at sea and in ports |230|
FIG. 38. Mode of transportation reported in individual drug seizure cases, 2006-2008 and 2009-2014
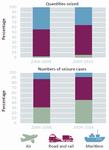
Click to enlargeSource: UNODC, individual drug seizure database.
Note: Distribution of main modes of transport excludes cases in which the mode of transport was unknown, not applicable or specified as "other". This analysis is based on 20,326 cases (1,445 tons) for the period 2006-2008 and on 47,319 cases (3,945 tons) for the period 2009-2014.The frequency of use of different modes of transportation used by drug traffickers has not changed a great deal over the past decade. Accounting for nearly half the reported individual seizures in the 2009-2014 period, trafficking by road and rail is the most common mode of transportation used by traffickers globally, along with trafficking by air. The average size of drug shipments intercepted on road and rail increased substantially from 68 kg between 2006 and 2008 to 107 kg between 2009 and 2014.
Accounting for 8 per cent of all reported cases in the past six years, maritime trafficking remains the least common mode of transportation in terms of individual seizure cases, but maritime seizures tend to be comparatively very large. With an average weight of 365 kg per seizure in the 2009-2014 period (compared with 250 kg in the 2006-2008 period) maritime seizures are by far the largest among the three modes of transportation. This confirms that interdiction of maritime shipments has potentially the greatest impact on the total quantities of drugs smuggled, as well as on trafficking flows and the availability of illicit drugs at the global level. For example, parcel post was the most commonly detected method of drug importation at the Australian borders in 2013, yet just three maritime seizure cases accounted for 74 per cent of the total weight of heroin intercepted that year in the country.
Trafficking by air has become more frequent, but quantities intercepted remain comparatively small. Drugs being trafficked by air seized from 2009 to 2014 accounted for 46 per cent of global seizure cases, but at an average of10 kg the size of the interceptions was much smaller. This represents an increase from the average of 6 kg per case observed in the period 2006-2008 and may reflect an increase in seizures involving trafficking by air cargo as opposed to air couriers.
TABLE 5. Main transit countries as reported by recipient countries in major individual drug seizure cases (above 100 g for heroin and cocaine, above 1 kg for cannabis), by drug, 2005-2014
Cocaine (base, salt and crack) Heroin (base, salt) Cannabis (herb, resin, oil) Transit Countries Total number of times country mentioned as transit point in individual seizures Number of recipient countries reporting transit countries Transit Countries Total number of times country mentioned as transit point in individual seizures Number of recipient countries reporting transit countries Transit Countries Total number of times country mentioned as transit point in individual seizures Number of recipient countries reporting transit countries Argentina 2,101 45 Afghanistan 21 6 Denmark 57 3 Bolivia (Plurinational State of) 530 19 India 44 11 Greece 36 8 Brazil 1,747 56 Kazakhstan 23 1 Morocco 4,308 24 Colombia 1,061 31 Kyrgyzstan 42 3 Netherlands 117 10 Costa Rica 624 34 Netherlands 30 4 Pakistan 76 24 Dominican Republic 1,313 20 Pakistan 3,216 178 Paraguay 117 7 Ecuador 410 22 Spain 29 4 Portugal 28 11 Panama 305 18 Tajikistan 128 4 Saint Vincent and the Grenadines 33 7 Peru 897 25 Turkey 45 7 Spain 846 33 Venezuela (Bolivaria Republic of) 587 27 United Arab Emirates 43 15 Swaziland 32 3 Source: UNODC, major individual drug seizure database. Data presented in the table reflect transit countries as reported by the countries where seizures were made and were not validated by the mentioned transit countries.
Note: Information provided on the main transit countries reported in major individual drug seizure cases is based on 11,441 cases of cannabis, 11,864 cases of cocaine and 4,041 cases of heroin. This tables lists the ten countries with the highest number of mentions as transit. The figures provided refer to the total number of mentions of the country as the last departure/transit point in major individual seizure cases reported to the UNODC over the 10-year period 2005-2014, and to the number of different reporting countries responsible for those mentions. It should be noted that some major consuming countries did not report on transit and departure countries.G. MARKET ANALYSIS BY DRUG TYPE
Key figures
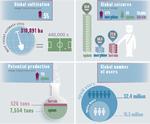
Click to enlargeNote: Data for seizures and number of users are from 2013. Data for cultivation and production are from 2014. Opioids include prescription opioids and opiates (opiates include opium and heroin). The global potential heroin production in 2014 is not comparable with previous years because the conversion ratios were updated in 2014.
Opium cultivation is reaching historic levels; prevalence of use remains stable
FIG. 39. Opium poppy cultivation and eradication in Afghanistan, 1998-2014
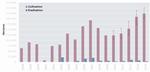
Click to enlargeSource: Period 1997-2002: UNODC; since 2003: national illicit crop monitoring system supported by UNODC.
FIG. 40. Global potential opium production, 1998-2014
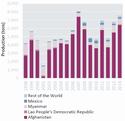
Click to enlargeSource: Period 1997-2002: UNODC; since 2003: national illicit crop monitoring systems supported by UNODC
FIG. 41. Global quantities of heroin seized, by region and in selected countries, 2003-2013
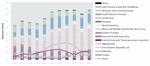
Click to enlargeSource: UNODC, responses to annual report questionnaire and other official sources.
FIG. 42. Global quantities of illicit morphine seized, total and selected countries, 2003-2013
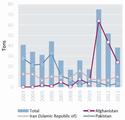
Click to enlargeSource: UNODC, responses to annual report questionnaire and other official sources.
According to the limited information available, at 0.7 per cent and 0.4 per cent of the population aged 15-64 respectively, the global prevalence of use of opioids and opiates has remained stable, representing 32.4 and 16.5 million users. Due to a 7 per cent increase, from 209,000 ha in 2013 to 224,000 ha in 2014, opium cultivation in Afghanistan is now at its highest level since estimates became available, although the increase was actually greater from 2012 to 2013 (36 per cent) (see figure 39). The 63 per cent reduction in poppy eradication in Afghanistan, from 7,348 ha in 2013 to 2,692 ha in 2014, may be a contributing factor.
Following a consistent downward trend between 2000 and 2006, opium poppy cultivation in both the Lao People's Democratic Republic and Myanmar increased steadily to reach roughly 64,000 ha in 2014, of which an estimated 57,600 ha were cultivated in Myanmar and 6,200 ha in the Lao People's Democratic Republic. |231|
Only partial information about the extent of opium poppy cultivation and heroin production in the Americas is available, but Mexico eradicated 14,662 ha of opium poppy in 2013 (7 per cent less than in 2012) and Colombia estimated the area under opium poppy cultivation in 2013 to be 298 ha. Colombia also reported the eradication of 514 ha of opium poppy in 2013 and the dismantling of one heroin laboratory per year over the 2011-2013 period.
Global potential opium production also continued to increase in 2014, reaching 7,554 tons, its second-highest level since the late 1930s (see figure 40). Opium production in Afghanistan accounted for an estimated 85 per cent of that total (6,400 tons) and, at 410 tons of heroin of export purity, 77 per cent of global heroin production (estimated at 526 tons). |232| The remaining 116 tons (heroin of unknown purity) were produced in the rest of the world, but because the conversion ratios were updated in 2014, potential heroin production in 2014 is not comparable with production in previous years.
The majority of the opium and illicit morphine seized in 2013 was concentrated around poppy cultivation areas in Afghanistan and its neighbouring countries, while heroin seizures covered a wider area (see figure 41). Since 2002, Afghanistan, Iran (Islamic Republic of) and Pakistan have consistently accounted for more than 90 per cent of the global quantity of opium seized each year and this pattern continued in 2013 when, with a 13 per cent increase from the previous year, the Islamic Republic of Iran remained the country with the largest quantity of opium seized (436 tons).
Globally, heroin seizures increased by 8 per cent from 2012 to 2013, whereas illicit morphine seizures decreased by 26 per cent (see figure 42). The largest drop in illicit morphine seizures was observed in Afghanistan, where they fell from 44 tons seized in 2012 to 24 tons in 2013. Since 2005, Afghanistan, Iran (Islamic Republic of) and Pakistan have accounted for more than 90 per cent of global morphine seizures each year, but in 2013 the quantity increased in the Islamic Republic of Iran (to 10.4 tons from 7 tons in 2012) |233| and in Pakistan (to 3.8 tons from 1.4 tons in 2012).
Up-to-date information on the use of opiates was available in only a few countries and points to stable global demand for heroin, whereas the non-medical use of prescription opioids has continued to increase in many regions. The markets for opiates in Africa, South-West Asia, parts of East Asia, the Middle East, Europe and Oceania are mainly supplied by South-West Asia (Afghanistan), while some markets in South-East Asia and Oceania are also supplied by South-East Asia (the Lao People's Democratic Republic and Myanmar). The Americas are mainly supplied by Latin America (Colombia and Mexico), with the exception of Canada, which to a significant extent is supplied by Afghan heroin.
Shifts in opiate trafficking routes
MAP 1. Main global trafficking flows of opiates

Click to enlargeSources: UNODC, responses to annual report questionnaire and individual drug seizure database.
Notes: The trafficking routes represented on this map should be considered broadly indicative and based on data analyses rather than definitive route outlines. Such analyses are based on data related to official drug seizures along the trafficking route as well as official country reports and responses to annual report questionnaires. Routes may deviate to other countries that lie along the routes and there are numerous secondary flows that may not be reflected. The boundaries shown on this map do not imply official endorsement or acceptance by the United Nations. Dashed lines represent undetermined boundaries. The dotted line represents approximately the Line of Control in Jammu and Kashmir agreed upon by India and Pakistan. The final status of Jammu and Kashmir has not yet been agreed upon by the parties. The final boundary between the Sudan and South Sudan has not yet been determined.Despite the increase in opium and illicit morphine seizures in the countries neighbouring Afghanistan, the stability of global seizures of heroin from 2008 to 2013 and of overall demand for heroin imply that the increase in estimated global opium and heroin production has not yet been reflected in a significant increase in heroin supply in most regions. There are signs, however, of increases in some heroin-related indicators (such as mortality and health emergencies) in the United States and the United Kingdom, where there are also indications of increased purity and lower prices. Moreover, in South and South-East Asia and West and East Africa, there are indications of increasing trafficking, but the paucity of data makes it difficult to determine whether these subregions are expanding markets for heroin.
The so-called "Balkan route" (through Iran (Islamic Republic of) and Turkey overland via South-Eastern Europe to Western and Central Europe), the so-called "northern route" (through Central Asia to the Russian Federation) and the so-called "southern route" (southwards through Iran (Islamic Republic of) or Pakistan) are the established global trafficking routes of Afghan opiates. These routes are marked, however, by constant changes; for example, two major heroin seizures in Armenia (917 kg) and Georgia (588 kg) reported in 2014 |234| were in stark contrast to the very low levels of seizures made in those countries over the past 15 years. This suggests that drug trafficking networks may be experimenting with new trajectories, although significant seizures continue to be made elsewhere on the Balkan route.
There is no evidence of a decline in the demand for heroin in the Russian Federation, |235| yet heroin seizures along the northern route have actually decreased. Despite a temporary reduction from 2011 to 2013, the fact that heroin seizures in Afghanistan itself have increased in the past decade may show that an increasing amount of opiates are being intercepted before reaching markets outside Afghanistan. On the other hand, several countries reported increasing seizures of heroin trafficked via the southern route (on which heroin is trafficked to Asia and Europe often via African countries) as well as maritime routes, which is consistent with reports |236| of an expansion of traff-ficking along the southern route. In Pakistan, opium seizures increased for the third consecutive year to reach 34 tons in 2013. The strengthening of controls between Afghanistan and Iran (Islamic Republic of) and between Iran (Islamic Republic of) and Turkey may have forced traffickers to move southwards towards the coasts of Iran (Islamic Republic of) and Pakistan. |237|
FIG. 43. Departure areas of heroin seized in Italy, 2011-2013
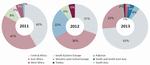
Click to enlargeSource: Italy, Direzione Centrale per i Servizi Antidroga, Annual Report 2013.
The increasing importance of Africa as a transit region for Afghan heroin bound for Europe and other regions has been reflected in increasing seizures of heroin being reported in recent years by some African countries, particularly in East Africa, and in seizures in Europe of African provenance. Since 2010, heroin seizures associated with the southern route have been reported in a number of European countries, including Austria, Belgium, the Czech Republic, Denmark, Finland, France, Germany, Greece, Ireland, Italy, Lithuania, the Netherlands, Portugal, Serbia, Slovenia, Spain, Sweden, Switzerland, Ukraine and the United Kingdom (see table 6 and figure 43). It is not clear whether this is a long-term shift away from the Balkan route or simply a response to opportunities presented by perceived lower levels of law enforcement along the southern route. |238|
TABLE 6. Large seizures of heroin in Belgium and the Netherlands linked to the southern route in 2013 and 2014
Date Amount Method Route Remarks 2013 863 kg Container Mozambique - Belgium -the Netherlands Seized at Antwerp seaport 2013 230 kg Container Pakistan - Belgium - the Netherlands Seized at Antwerp seaport 2014 764 kg Container Iran (Islamic Republic of) - United Arab Emirates -the Netherlands Seized at Rotterdam seaport Sources: UNODC, The Illicit Drug Trade through South-Eastern Europe (March 2014) and the Netherlands, Public Prosecution Service.
FIG. 44. Quantities of heroin seized in Africa, 2003-2013
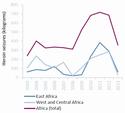
Click to enlargeSource: UNODC, responses to annual report questionnaire and other official sources.
Although suspected for decades, |239| recent seizure data suggest that movements of large shipments of heroin from Afghanistan across the Indian Ocean to East and Southern Africa may have become more common. Dhows (traditional sailing vessels used in the Red Sea and the Indian Ocean) are known to move opiates from Afghanistan to Kenya and the United Republic of Tanzania. |240| In 2014, more than 2,200 kg of heroin were seized on the Indian Ocean by the Combined Maritime Forces, |241| which is more than the total reported heroin seizures for the whole of Africa between 2011 and 2013. In Kenya, 377 kg of heroin and 33,200 litres of liquid heroin were seized in 2014 from a single ship transiting via the Islamic Republic of Iran that was destined for Mombasa, Kenya; in the United Republic of Tanzania, a single record seizure of 1,032 kg of heroin transiting via Pakistan and smuggled to the country by dhow was reported; |242| while in West Africa, Nigeria reported the seizure of 25 kg of heroin bound for North America and Western and Central Europe in 2013. Thus, there are increasing signs of parallels with the phenomenon in the 2000s, when Africa began to play a strategic role in the trafficking of cocaine.
Canada and the United States: different sources of supply in heroin trafficking
Compared with global average prevalence, opioid use remains high in North America (3.8 per cent). In the United States, there are indications of a partial shift in the opioid market towards use of heroin driven, in part, by changes in the formulation of OxyContin — one of the major prescription opioids that is misused — to a controlled-release formulation that cannot be snorted or injected, |243| as well as by an increase in the availability of heroin and a decrease in its price in some parts of the country. A recent household survey in the United States indicated that there was a significant decline in the misuse of prescription opioids from 2012 to 2013. |244|
FIG. 45. Changes in heroin-related indicators in the United States, 2004-2013
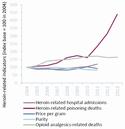
Click to enlargeSource: United States, SAMHSA and 2014 National Drug Control Strategy.
The number of drug-related deaths continues to rise in the United States, with heroin-related cases increasing considerably (from 5,925 deaths in 2012 to 8,257 in 2013) to reach their highest levels in the past decade. |245| Prescription painkiller overdoses also continue to rise, particularly among women. Over the period 2004-2011, emergency room cases related to heroin and other opioid use rose by 183 per cent (see figure 45). |246|
Seizures of heroin in the United States have increased since 2008 (to 6.2 tons in 2013). Authorities have reported increased trafficking of both Mexican- and South American-produced heroin |247| and, in 2014, Mexico reported being a transit country for heroin produced in Colombia and destined for the United States. |248| Indeed, the majority of heroin in the United States is estimated to be supplied by Latin American production. |249| In 2011 and 2012, however, authorities suggested that the availability of Afghan heroin was increasing in the United States, |250| although current estimates of its share of consumer markets have not been made available to UNODC (past estimates pointed to a market share of around 4 per cent). |251| Seizures of Afghan opiates made on the southern route in Africa destined for the United States seem to confirm that organized criminal groups may be trafficking heroin to supply the growing market in the United States. |252|
Unlike all the other countries in the Americas, Canada is not supplied to a large extent by Latin American heroin. According to the Royal Canadian Mounted Police National Intelligence Coordination Center, between 2009 and 2012 at least 90 per cent of the heroin seized in Canada originated in Afghanistan. |253| The southern route was reportedly the major conduit for those shipments, with nearly 50 per cent having transited through India, Iran (Islamic Republic of) and Pakistan. |254| |255|
Australia: a mixed market with constant changes in supply source
Levels of opioid use in Australia and New Zealand remain high (2.9 per cent), mainly because of high levels of misuse of prescription opioids. According to a recent survey in Australia, there has been an increase in the misuse of prescription opioids (from 3.0 per cent in 2010 to 3.3 per cent in 2013), while the prevalence of heroin use has declined from 0.2 to 0.1 per cent. |256|
There are also signs of changes in the heroin market in Oceania. The number of heroin seizures made at the Australian border increased in 2013 from the previous year, with 429 kg being intercepted, confirming the increasing trend since 2004. Most of the heroin seized in Australia in 2013 originated in South-East Asia, while in previous years the supply fluctuated between heroin originating in South-East Asia and South-West Asia (see figure 47). In 2013, by number of seizures, the Netherlands, Viet Nam and Thailand (in descending order) were the primary embarkation points of heroin reaching Australia, while Thailand, Viet Nam, Taiwan Province of China and Malaysia (also in descending order) were the principal last departure points in terms of quantities seized. |257|
FIG. 46. Heroin detections at the Australian border, as a proportion of total weight, by method of importation, 2012-2013
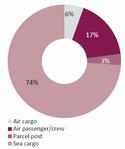
Click to enlargeSource: Australia, Customs and Border Protection Service.
FIG. 47. Geographical origin of heroin samples, as a proportion of analysed border seizures by the Australian Federal Police, 2008-June 2013
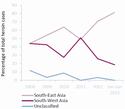
Click to enlargeSource: Australian Federal Police, Forensic Drug Intelligence, 2013.
Europe: a diverging heroin market with emerging supply routes
The heroin market in Europe is marked by variations across subregions. In Western and Central Europe, there are indications of a stable or downward trend in the use of heroin, but in Eastern and South-Eastern Europe, the prevalence of use of heroin remains high.
FIG. 48. Quantities of heroin seized in Europe, 2003-2013
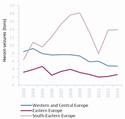
Click to enlargeSource: UNODC, responses to annual report questionnaire and other official sources.
Quantities of heroin seized in Europe accounted for almost 30 per cent of all heroin seized globally in 2013. Heroin seizures in South-Eastern Europe increased slightly in 2013 from the previous year, with Turkey seizing 13.5 tons, slightly more than the 13.3 tons reported in 2012. A recent government report in Turkey |258| highlighted several new developments, including an increase in heroin arriving in Turkey from Iraq rather than exclusively from the Islamic Republic of Iran, the increasing use of sea containers in heroin trafficking and the diversification of the activities of organized criminal groups, which are trafficking not only heroin but also cannabis resin and methamphetamine.
The quantities of heroin seized in Eastern Europe increased slightly in 2013, but remained stable from a long-term perspective. Opioid use in Eastern Europe, in particular in the Russian Federation and Ukraine, remains high, with an estimated 2.37 million (2.29 per cent prevalence), including 291,500 opiate users (0.9 per cent prevalence). Opioid use in the other countries in the subregion remains lower than the global average, although experts in Belarus perceive an increase in opioid use, particularly of acetylated opium and pharmaceutical opioids. Also, in the Russian Federation the replacement of heroin with cheaper alternates such as acetylated opium and desomorphine continues to be reported. |259| A major health consequence of people injecting opioids in Eastern Europe is the high prevalence of HIV, which is estimated to be 24.6 per cent in the Russian Federation and 19.7 per cent in Ukraine, and accounts for a third of the global estimated number of PWID living with HIV in the region. In the Russian Federation, drug-related deaths due mainly to opioid overdose are also reported to be high, at 80 deaths per million of the population.
In Western and Central Europe, seizures of heroin in most countries either remained stable or continued to decline gradually, except in Belgium, where seizures of heroin increased dramatically, from 112 kg in 2012 to 1.2 tons in 2013, as a result of two large seizures. It is important to mention that some large maritime seizures were made in Western and Central Europe, which suggests that significant heroin shipments were not detected at points of departure and transit, whether in South-West Asia, the Middle East or Gulf countries. This also suggests that the ports of Belgium and the Netherlands may play a key role as entry points to Europe for heroin imported from Afghanistan via the southern route. |260|
FIG. 49. Purity-adjusted price per gram of heroin the United Kingdom, 2003-2013
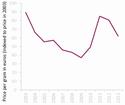
Click to enlargeSource: Charlotte Davies and Rosemary Murray, 2013 National Report (2012 Data) to the EMCDDA (London, United Kingdom Focal Point on Drugs, 2014).
Other opioids, such as buprenorphine, fentanyl and methadone, are available in illicit markets in Western and Central Europe. For example, fentanyl and buprenorphine are the main opioids used in Estonia and Finland, respectively. In some instances, these substances account for a significant proportion of overdose deaths, as in the case of fen-tanyl in Estonia. On the other hand, injecting heroin has been declining in Western and Central Europe, |261| as has the number of heroin users entering treatment for the first time, resulting in an ageing cohort of heroin users currently in treatment.
In the United Kingdom, following a decrease in 2011, there was an increase in heroin-related deaths in 2013. This increase may be partially explained by an increase in heroin purity which, having been low in 2011 and 2012, rose to almost its 2010 level in 2013. The average wholesale price of heroin in the United Kingdom decreased slightly from �30,000 per kilogram in 2012 to �28,000 in 2013, |262| which may indicate an increase in the heroin supply and may also be related to the increase in production in Afghanistan.
Heroin is trafficked to Europe via the Balkan route and the northern route, but heroin shipments from Iran (Islamic Republic of) and Pakistan are also entering Europe by air or sea, either directly or transiting through countries in East and West Africa. The quantity of heroin seized in Europe over the past decade has varied greatly and, since 2010, supplies of heroin to the United Kingdom from Afghanistan via the Balkan route have decreased. Belgium and the Netherlands remain important transit points for heroin trafficking to the United Kingdom via heavy goods vehicles and ferries. |263|
Increase in heroin seizures in East and South-East Asia
FIG. 50. Trends in registered drug users and the proportion of registered drug users, by drug type in China, 2002-2013
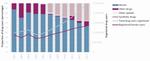
Click to enlargeSource: UNODC, responses to annual report questionnaire and other official sources.
FIG. 51. Number and weight of annual Afghan heroin seizures in China, 2009-2013
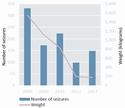
Click to enlargeSource: "Afghan opiate trafficking on the southern route: statistics, seizures and recent trafficking trends in China", presentation by the National Narcotics Control Commission of China, UNODC regional workshop on Afghan opiate trafficking on the southern route, Vienna, March 2014.
In the absence of any recent reliable data on the extent of the use of opioids in most parts of Asia it is difficult to determine a trend, although, based on expert perceptions, it is considered to be generally stable. Expert perceptions of trends in drug use indicate that opioid (including heroin) use is perceived to be decreasing in China, where, although the total number of registered heroin users increased by 6 per cent in 2013, to 1.32 million heroin users, the proportion of heroin users among all registered drug users decreased. This was because of an increase in the proportion of users of synthetic opioids, which may also include opiate polydrug users (see figure 50).
Historically, the southern route has been a marginal conduit for Afghan opiates trafficked to East and South-East Asia, as opiates produced in Myanmar tend to feed that market. There have been various reports, however, that Myanmar may be unable to meet regional demand, and that heroin is trafficked to East and South-East Asia from Afghanistan. |264| It is quite likely that a portion also travels north from Afghanistan overland via Central Asia to China, |265| the primary consumer in the Asia region. |266|
Amounting to 11.8 tons in 2013, seizures of heroin in East and South-East Asia increased for the third consecutive year. China continued to account for the majority of heroin seizures in the region, with annual seizures of 8.5 tons, up from 7.3 tons in 2012. The authorities in China reported that northern Myanmar remained the main source of heroin in the Chinese market, but also noted some cases of seizures of opiates originating in Afghanistan. |267|
Africa: possible increase in heroin use
Although information on the extent of drug use in Africa is limited, according to UNODC the prevalence of use of opiates is estimated at 0.3 per cent of the population aged 15-64 (an estimated 1.88 million users). Moreover, the increasing importance of Africa as a transit area for Afghan heroin bound for markets in other regions may have led to an increase in heroin use locally.
Key figures
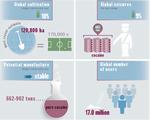
Click to enlargeNote: All data are from 2013.
Lowest levels of coca bush cultivation on record
Coca bush cultivation continued to decline in 2013, reaching its lowest level since estimates from the mid-1980s. The decline in 2013 was driven mainly by an 18 per cent decrease in coca bush cultivation in Peru (from 60,400 ha in 2012 to 49,800 ha) and by a 9 per cent decrease in the Plurinational State of Bolivia (from 25,300 ha to 23,000 ha).
Coca bush cultivation in Colombia, on the other hand, remained stable in 2013, although it remained at historically low levels. In addition to the figure collected on 31 December 2012, available information for Colombia on the presence of coca bush cultivation shows that prior to eradication 89,215 ha were under cultivation at some point in 2013, 34 per cent less than in 2012. |268| The potential production of pure cocaine in Colombia was estimated at 290 tons, |269| the lowest level since 1996. The combination of a decrease in cultivation in all the main coca bush cultivating countries has led to a decline in the estimated global production of cocaine. It should be noted that the illicit extraction of cocaine alkaloids from coca leaves, the first step in the manufacture of cocaine, continues to take place almost exclusively in the three coca-producing countries, which also accounted for the majority of cocaine hydrochloride manufactured worldwide.
Cocaine markets: the impact of decreasing production
MAP 2. Main global trafficking flows of cocaine
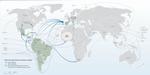
Click to enlargeSource: UNODC, responses to annual report questionnaire and individual drug seizure database.
Notes: The trafficking routes represented on this map should be considered broadly indicative and based on data analyses rather than definitive route outlines. Such analyses are based on data related to official drug seizures along the trafficking routes as well as official country reports and responses to annual report questionnaires. Routes may deviate to other countries that lie along the routes and there are numerous secondary flows that may not be reflected. The boundaries shown on this map do not imply official endorsement or acceptance by the United Nations. Dashed lines represent undetermined boundaries. The dotted line represents approximately the Line of Control in Jammu and Kashmir agreed upon by India and Pakistan. The final status of Jammu and Kashmir has not yet been agreed upon by the parties. The final boundary between the Sudan and South Sudan has not yet been determined.The global supply of cocaine may originate in Bolivia (Plurinational State of), Colombia and Peru, but the largest cocaine markets and highest rates of prevalence of cocaine use are reported in North and South America and Western and Central Europe. Estimated at 0.4 per cent of the global adult population aged 15-64, the annual prevalence of cocaine use has shown a declining trend in Western and Central Europe and North America, particularly the United States, over the past few years, but cocaine use still remains at high levels in those subregions, while information for most of Africa and Asia remains sporadic.
FIG. 52. Coca bush cultivation, 2003-2013
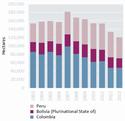
Click to enlargeSource: UNODC, responses to annual report questionnaire and other official sources.
FIG. 53. Cocaine seizures, by mode of transportation (number of cases and quantity), 2006-2008 and 2009-2014
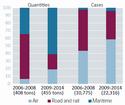
Click to enlargeSource: UNODC, individual drug seizure database.
Note: Excludes cases in which the mode of transportation was unknown, not applicable or specified as "other".Cocaine is usually trafficked northwards from the Andean countries of South America to North America and across the Atlantic to Europe via the Caribbean or Africa, by a variety of means, including air and sea. Individual drug seizure cases reported to UNODC show that maritime trafficking has increased as a means of transporting large quantities of cocaine in recent years, accounting for 60 per cent of the total quantities seized (see figure 53). Accounting for more than 50 per cent of actual seizure cases, trafficking by air is very frequent but the quantities intercepted are comparatively small (average of 6 kg per case in the period 2009-2014) (see figure 54).
The fact that coca bush cultivation continued to decrease in 2013, reaching its lowest level in the past three decades, may partially explain the shrinking of some cocaine markets and the reduction in the availability of cocaine in, for example, the United States and, more recently, in Canada. Successful law enforcement efforts and conflicts between transnational criminal groups have also had an impact on the availability of cocaine. |270|
Following the increase observed between 2011 and 2012, cocaine seizures have remained stable (687 tons seized in 2013 compared with 684 tons in 2012), despite a decrease in seizures in the two main cocaine markets, the United States (65 per cent decrease, from 104 to 37 tons) and Western and Central Europe (18 per cent decrease, from 71 to 58 tons) (see figure 55). The only region where cocaine seizures increased in 2013 was Central America and the Caribbean, up to 162 tons in 2013 from 78 tons in 2012.
FIG. 54. Average size of cocaine seizures, by mode of transportation, 2006-2008 and 2009-2014
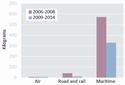
Click to enlargeSource: UNODC, individual drug seizure database.
Note: Excludes cases in which the mode of transportation was unknown, not applicable or specified as "other". The values in the figure are based on 4,714 seizure cases by air, 5,817 cases by road and rail and 244 maritime cases, for 2006-2008. For 2009-2014, the figures are based on 13,058 seizure cases by air, 8,415 cases by road and rail and 843 maritime cases.FIG. 55. Global quantities of cocaine seized, by region and in selected countries, 2003-2013
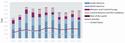
Click to enlargeSource: UNODC, responses to annual report questionnaire and other official sources.
CONTINUED INCREASE IN COCA ERADICATION AND THE DISMANTLING OF LABORATORIES
Cocaine-type laboratories dismantled, 2011-2013
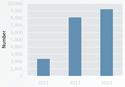
Click to enlargeSource: UNODC, responses to annual report questionnaire and other official sources.
The manual eradication of coca bush in the Plurinational State of Bolivia continued to increase in 2013, reaching 11,407 ha, while seizures of coca leaf dropped significantly compared with 2012. The authorities in Peru eradicated over 23,900 ha of coca bush crops in 2013, with most of it focused on the Palcazu-Pichis-Pachitea area and the Monzon Valley, which had the highest rates of expansion in the area used for cultivation and which serve as key points for the production of illicit coca derivatives produced both locally and elsewhere. Because of eradication efforts and the subsequent decrease in the supply of coca leaf, the average price of dried coca leaf in Peru increased by 30 per cent in 2013. Authorities reported� that state eradication efforts in recent years have caused drug trafficking organizations to shift illicit cultivation to increasingly scattered and isolated areas. In Colombia, supply reduction activities in 2013 included the aerial spraying of over 47,000 ha of coca bush and the manual eradication of over 22,000 ha.
Clandestine cocaine-processing laboratories also exist outside the main cocaine-producing countries. In 2013, a number of countries in South America, including Argentina, Chile, Ecuador and Venezuela (Bolivarian Republic of), reported the detection of clandestine laboratories processing coca leaf derivatives, but the overall number of laboratories dismantled has decreased since 2011. Two European countries also reported the detection of clandestine laboratories processing coca leaf derivatives; however, cocaine laboratories detected outside South America are usually secondary extraction laboratories for extracting cocaine from other materials, such as clothing or plastics, used for trafficking and concealment purposes. In the Plurinational State of Bolivia, the number of cocaine hydrochloride laboratories destroyed by authorities increased by 81 per cent to 67 in 2013. During 2013, the authorities in Colombia destroyed a total of 2,128 laboratories for the extraction of coca paste or cocaine base, as well as 208 cocaine hydrochloride laboratories.
� Country report submitted by Peru to the Twenty-fourth Meeting of Heads of National Drug Law Enforcement Agencies, Latin America and the Caribbean.
In 2013, Colombia again reported the largest annual cocaine seizures by a single country worldwide, even though its seizures of cocaine base, paste and salts decreased from 243 tons in 2012 to 226 tons in 2013. Authorities in Colombia reported frequently meeting resistance when conducting supply reduction activities, such as monitoring coca bush cultivation and cocaine production, which may have had an impact on seizures.
North America: shrinking cocaine market
FIG. 56. Cocaine use in the United States, 2002-2013
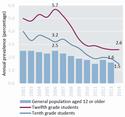
Click to enlargeSource: United States, SAMHSA.
Supply reduction measures may have led to a reduction in the size of the cocaine market in some areas of the world, reflected in the decrease in the number of seizures made and in the decline in the prevalence of cocaine use. Compared with previous years, there was a decrease in the amount of cocaine seized while entering Canada in 2013. Most cocaine seizures came from the Caribbean, Central and South America and, to a lesser extent, the United States, via air cargo, mail and passenger luggage, with most cocaine entering Canada via the major sea ports. Some of the possible explanations for the shrinking of the cocaine market in Canada are changes in consumer preferences and a shift in tactics and routes by criminal organizations in an attempt to avoid law enforcement detection.
In 2013, the prevalence of cocaine use in the United States was estimated to be 1.6 per cent of the population aged 12 and older, and this has remained stable over the past few years, although it is still signifcantly lower than in 2006. Cocaine use among high-school students has been declining, with annual prevalence nearly halving since 2006, when it was reported to be 3.5 per cent, to 1.8 per cent in 2013. The proportion of young people who perceive that cocaine is easy to obtain has also declined in recent years.
South America: increase in cocaine use
Long-term trends show that the quantity of cocaine seized globally has remained stable, with South American countries continuing to account for the majority of cocaine seizures made worldwide. In South America, the annual prevalence of cocaine use was estimated to have increased from 0.7 per cent in 2010 (1.84 million users) to 1.2 per cent in 2012 (3.34 million users), three times the global estimated average level of consumption and it remained at the same level in 2013. Experts in Chile and Costa Rica perceived an increase in cocaine use in previous year data, but the increase in cocaine use in the subregion is driven by increasing use in Brazil, which is the largest cocaine market in South America. While no recent survey has been undertaken in Brazil, extrapolating data from a survey among university students, UNODC estimates a prevalence of use of cocaine of 1.75 per cent among the adult population of the country. Because of its geographical position, Brazil plays a strategic role in the trafficking of cocaine, seizures of which doubled in the country in 2013 to over 40 tons. Cocaine enters Brazil by air (small aircraft), land (car, truck and bus) and river (boat across the Amazon and its tributaries), before being shipped overseas, mainly to Europe, either directly or via Africa (roughly 30 per cent of the cocaine seized in the country is intended for external markets), |271| using containers and aircraft.
TABLE 7. Cocaine indicators in Brazil, most recent data
Seizures 42 tons Treatment Majority of cases in treatment are polydrug users (all substances) and 20 per cent of drug users in treatment are for cocaine use only Seizures of cocaine (base, paste and salts) decreased in Bolivia (Plurinational State of), Peru and Venezuela (Boli-varian Republic of) in 2013. In the Plurinational State of Bolivia, cocaine seizures reached their lowest level since 2007. In Peru, seizures of cocaine paste peaked in 2012, but decreased to 10.8 tons in 2013, while seizures of cocaine salt rose slightly to 13.3 tons in 2013. In the Boli-varian Republic of Venezuela, cocaine seizures decreased to 20.5 tons in 2013 (from 27.6 tons in 2012). According to authorities in the Bolivarian Republic of Venezuela, the country remains a transit point for cocaine, particularly cocaine trafficked by air in private aircraft, but newly introduced legislative changes related to air traffic control have decreased the entry and exit of uncontrolled aircraft, which has led to a decrease in drug trafficking by air. |272| Three European countries |273| listed the Bolivarian Republic of Venezuela as a significant departure or transit country for cocaine in 2013.
Australia: more people are using cocaine but with less frequency
In Australia, while the use of drugs such as cannabis, "ecstasy", methamphetamine and amphetamine has generally declined since 2004, the number of people using cocaine has been increasing since that time (see figure 57). The frequency of use of cocaine by recent users has decreased, however, with a lower proportion using it in the past month (18 per cent) and a higher proportion using it only once or twice a year (71 per cent). There was an increase in the proportion of people who were offered or had the opportunity to use cocaine in 2013 (up to 5.2 per cent from 4.4 per cent in 2010), despite increases in the retail price in recent years. Users' perceptions about the harmfulness of the substance have decreased to 3.6 per cent of people considering cocaine the drug of most serious concern, which may partly explain the increase in the number of people having tried cocaine. |274|
FIG. 57. Indicators of cocaine use in Australia
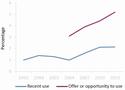
Click to enlargeSource: Australian Institute of Health and Welfare, National Drug Strategy Household Survey, detailed report 2013.
FIG. 58. Frequency of cocaine use by recent users in Australia, 2010 and 2013
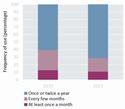
Click to enlargeSource: Australian Institute of Health and Welfare, National Drug Strategy Household Survey, detailed report 2013.
In New Zealand, the cocaine market remains very limited, with a little over 228 g of cocaine seized in 2013, and its use seems to rarely come to the attention of health agencies.
Europe: stable cocaine market
FIG. 59. Trends in cocaine use in high-prevalence countries in Europe
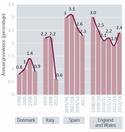
Click to enlargeSource: UNODC, responses to annual report questionnaire and other official sources.
Cocaine use remains high in the main markets of Western and Central Europe (around 1.0 per cent of the population aged 15-64). There are some signals, however, of a decreasing trend in countries with high levels of use, such as Denmark, Italy and Spain, whereas the United Kingdom reports a rising trend in cocaine use in the past year (see figure 59) and most of the remaining countries report stable or declining trends in cocaine use. There is also a declining trend in treatment demand for cocaine use, which may indicate a decline in the European cocaine market.
Based on seizure data, cocaine continues to be the third most trafficked drug in Europe, after herbal cannabis and cannabis resin. In recent decades, with the development of new routes, cocaine trafficking (and use) in Europe has evolved and become more complex. The quantities of cocaine intercepted in Europe increased from the mid-1990s, reaching a peak in 2006 (121 tons) before declining to an average of 62 tons between 2008 and 2013. Seizures in the Iberian Peninsula, which is used as a major entry point for cocaine to Europe, reached a peak in 2006, before falling until 2012. However, quantities seized in 2003 increased, possibly reflecting a change in law enforcement priorities or a change in the modus operandi of traffickers. As cocaine is often perceived to be an elite drug, the economic climate may account for the decrease in seizures and a possible related decrease in cocaine use.
Eastern Europe has seen an increased number of cocaine interdictions in recent years, although of small quantities, which may suggest that the cocaine market is moving east-wards. |275| Expert perceptions of trends in the use of cocaine in the Russian Federation point to an increase, while it is perceived to be stable in the other countries in the subregion.
Central America and the Caribbean: transit points for cocaine trafficking
The prevalence of use of cocaine remained high in Central America and the Caribbean in 2013, and the subregion continued to be reported as a transit area for cocaine trafficked to Europe. Trafficking patterns in Central America appeared to be relatively stable, with Panama (41 tons) and Costa Rica (20 tons) seizing the largest quantities of cocaine in the region in 2013. Costa Rica reported that it had changed from being primarily a transit country to a country of both transit and temporary storage. Trinidad and Tobago seized 2.3 tons of cocaine in 2013, surpassing the previous annual record of 1.9 tons in 2005. Law enforcement authorities have observed a change in trafficking patterns in which drug traffickers and smugglers cancel confirmed flights at the last minute then make hasty bookings in an attempt to avoid detection during passenger screenings.
Africa: still a transit hub for cocaine trafficked to Europe
FIG. 60. Quantities of cocaine seized in Africa, 2003-2012
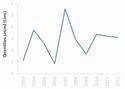
Click to enlargeSource: UNODC, responses to annual report questionnaire and other official sources.
Information about the extent of cocaine use and trafficking in Africa is limited, but prevalence estimates of cocaine use for Southern Africa and West and Central Africa indicate a high prevalence of use (0.7 per cent annual prevalence in 2013). The use of the African continent as a trans-shipment region for cocaine trafficking to Europe continues, with countries in West Africa being reported as transit countries. Nigeria reported the seizure of 290 kg of cocaine in 2013, while Ghana reported a record 901 kg seized and Cote d'Ivoire reported the seizure of 20 kg in 2013, down from 27 kg in 2012. Between 2010 and 2012, reported cocaine seizures in Eastern Africa increased significantly, most notably in the United Republic of Tanzania. There is a change in trafficking modus operandi suggested by official authorities in the United Republic of Tanzania, where, since 2013, traffickers have been smuggling cocaine in smaller amounts to avoid detection. |276|
THE ENVIRONMENTAL BURDEN OF COCAINE PRODUCTION
Deforestation due to coca bush cultivation in Colombia, 2001-2013
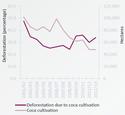
Click to enlargeSource: National illicit crop monitoring system, supported by UNODC Country Office in Colombia.
Illicit coca bush cultivation and coca leaf transformation into cocaine lead to serious environmental damage. Coca bush cultivation takes place in the northern-Andean ecosystem, a biodiversity hotspot� and the most species-rich region on Earth,b where coca bush cultivation has devastating effects. Deforestation is the most researched aspect of the impact on the environment.c Recent studies using satellite imagesd have given a clearer picture of the damage caused to vegetation. In Colombia alone, roughly 290,000 ha of forest were lost directly to coca bush crops between 2001 and 2013.e The slash-and-burn technique is used to clear new plots using fire,f which destroys the vegetative matter that would otherwise protect the soil. Besides forest loss, this also leads to increased erosion. As farmers move to undeveloped areas, additional land is cleared to establish subsistence crops. Thus, even though coca bush cultivation has decreased, the percentage of deforestation caused by the cultivation has increased. Recent studies have found that proximity to coca bush crops increases the probability of forest loss, and that deforestation is "contagious" in areas where coca bush is grown.g Moreover, the presence of coca bush cultivation in natural parksh increases the negative impact on biodiversity.
Further environmental damage is caused by the herbicides and fertilizers used in cultivation and by the chemicals employed in the transformation of coca leaf into cocaine, although there is far less evidence in this regard. What is known, however, is that in 2005 alone, 81,000 tons and 83,000 barrels of fertilizers, pesticides and herbicides, many of them considered highly toxic, were used for coca bush cultivation in Colombia. These, together with the gasoline, alkaline bases, sulphuric acid, ammonia and potassium permanganate required to transform coca leaf into cocaine, end up in the soil and water table.
a Andrew V. Bradley and Andrew C. Millington, "Coca and colonists: quantifying and explaining forest clearance under coca and anti-narcotics policy regimes", Ecology and Society, vol. 13, No. 1 (2008).
b UNODC, Coca Cultivation in the Andean Region: a Survey of Bolivia, Colombia and Peru (June 2006), part 2.
c Liliana M. Dávalos and others, "Forests and drugs: coca-driven deforestation in tropical biodiversity hotspots", Environmental Science and Technology, vol. 45, No. 4 (2011), pp. 1219-1227; UNODC, Colombia: Coca Cultivation Survey 2014; Coca Cultivation in the Andean Region: a Survey of Bolivia, Colombia and Peru and Bradley and Millington, "Coca and colonists: quantifying and explaining forest clearance under coca and anti-narcotics policy regimes".
d Ibid.
e Colombia Coca Cultivation Survey 2013.
f A. Gomez and others, "Examining the potential of using information on fire detected by MODIS and socio-economic variables to highlight potential coca cultivations in forest areas in Colombia", The Open Geography Journal, vol. 6 (2014), pp. 18-29.
g Ricardo Rocha and Hermes Martinez, "Coca y deforestacion en Colombia", Serie Archivos de Economia, documento No. 375, (Bogota, 2011); Davalos and others, "Forests and drugs: coca-driven deforestation in tropical biodiversity hotspots".
h Coca Cultivation in the Andean Region: a Survey of Bolivia, Colombia and Peru, part 2; Colombia: Coca Cultivation Survey 2014 and Bolivia: Coca Cultivation Survey 2014.
Asia: stable but limited cocaine use
Mostly limited to countries in East and South-East Asia and the Near and Middle East, cocaine use in Asia remains comparatively low at a prevalence of 0.05 per cent among the population aged 15-64 (an estimated 1.3 million users). Quantities of cocaine seized have remained stable over the past three years, with some 2 tons intercepted in the region in 2013. However, exceptionally large amounts of cocaine are reported each year in some Asian countries; for example, roughly 1 ton was seized in Pakistan in 2013. Larger than amounts seized in the past, this suggests that cocaine is trafficked in the region and that pockets of use may be emerging in parts of Asia.
Key figures
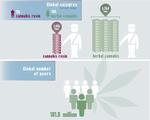
Click to enlargeNote: Data for seizures and number of users are from 2013.
Cannabis cultivation: a global phenomenon
Cannabis plants are grown almost everywhere in the world, making global levels of cannabis cultivation and production difficult to estimate. Herbal cannabis is produced in almost every country, while the production of cannabis resin is confined to a few countries in North Africa, the Middle East and South-West Asia. Morocco reported 47,196 ha of cannabis cultivation in 2013, a slight decrease compared with the 52,000 ha reported in 2012, while Mongolia reported 15,000 ha of land covered by cannabis. With 10,000 ha under commercial cannabis plant cultivation in 2012, producing some 1,400 tons of cannabis resin, one of the largest producers of cannabis resin is Afghanistan, where cannabis cultivation is linked to opium poppy cultivation: 38 per cent of villages where opium poppy is grown also report cannabis plant cultivation, compared with only 5 per cent of non-poppy-growing villages. |277|
Increasing cannabis seizures, with regional differences
FIG. 61. Global quantities of cannabis resin seized, by region and in selected countries, 2003-2013
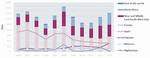
Click to enlargeSource: UNODC, responses to annual report questionnaire and other official sources.
FIG. 62. Global quantities of herbal cannabis seized, by region and in selected countries, 2003-2013
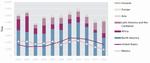
Click to enlargeSource: UNODC, responses to annual report questionnaire and other official sources.
FIG. 63. Modes of transportation of seized cannabis, 2009-2014

Click to enlargeSource: UNODC, individual drug seizure database.
Cannabis plant cultivation sites range from small-scale, home-growing sites to large-scale industrial farms. Cannabis plant cultivation techniques and equipment have seen an increase in professionalism and innovation, resulting in an increase in the capacity of cannabis plant growers to avoid detection by law enforcement; yet 2013 data show an increase in quantities seized of both herbal cannabis and cannabis resin worldwide (see figure 61 and figure 62). This bucks the declining trend in seizures of herbal cannabis that began in 2011 and may point to increased law-enforcement activities and/or an increase in cannabis production and trafficking, albeit with geographical variations.
Individual drug seizure cases reported to UNODC show that trafficking by land accounted for more than 60 per cent of the total quantities seized and number of cases, with an average of 190 kg per seizure case in the period 2009-2014. Maritime trafficking is the second most common method of transportation, but the quantities intercepted are comparatively larger, with an average of 387 kg per seizure case in the same period (see figure 63).
TABLE 8. Reported eradication of cannabis plants, 2013
Eradication (outdoor) Eradication (indoor) Plants (no.) Sites (no.) Plants (no.) Sites (no.) United States 4,024,605 6,376 United States 361,183 2,747 Philippines 2,013,678 451 Germany 93,771 n.a. Guatemala 2,000,000 n.a. Czech Republic 66,279 276 Costa Rica 1,461,747 199 Ireland 28,851 391 Brazil 900,744 n.a. New Zealand 21,202 783 Italy 884,612 1,100 Latvia 14,220 14 Trinidad and Tobago 597,100 117 Italy 10,262 622 Ukraine 483,000 n.a. Iceland 6,652 323 Belgium 393,888 1,107 Belgium 2,870 105 New Zealand 105,321 n.a. Source: UNODC, responses to annual report questionnaire and other official sources.
Note: n.a. = not available.The trend in Europe and Latin America and the Caribbean never actually underwent a decline. The contribution of Latin America and the Caribbean to total global quantities of herbal cannabis seized increased from 20 per cent to 30 per cent in 2013, but the largest quantities of herbal cannabis were seized in North America (47 per cent). The global increase in quantities of cannabis resin seized in 2013 was mainly driven by the rise in Pakistan, from 166 tons in 2012 to 314 tons in 2013, which counteracted the marked decrease in the quantities of cannabis resin reported as seized in Afghanistan. Quantities intercepted in North Africa increased by 31 per cent, mainly owing to increases in Algeria (from 157 tons in 2012 to 212 tons in 2013) and Egypt (from 12 tons to 84 tons), and despite a decrease in Morocco from 137 tons in 2012 to 107 tons in 2013. Spain accounted for 23 per cent of global quantities of cannabis resin seized in 2013.
The Americas: increase in cannabis use and related problems in the United States
With an annual prevalence of use of 8.4 per cent among the population aged 15-64, cannabis is the most widely used illicit substance in the Americas, driven mainly by the high level of use in North America (11.6 per cent). The most recent data point to an increase in the prevalence of cannabis use in the United States, which, because of ongoing changes in legislation in some states, has drawn special attention.
FIG. 64. Cannabis use in the United States, 2002-2013
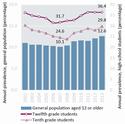
Click to enlargeSource: United States, SAMSHA.
Cannabis use among high-school students in the United States increased in 2013 (from 24.7 per cent in 2012 to 25.8 per cent annual prevalence in 2013), but there has been a significant decline in the use of synthetic cannabis to an annual prevalence of 6.4 per cent in 2013 from 8 per cent in 2012, when it was first included in a school survey. |278| Available data show an increasing trend in cannabis-related treatments in the past decade, along with increasing cannabis-related hospital admissions. |279|
FIG. 65. Quantities of herbal cannabis seized in the United States and respective contribution to global seizures estimate
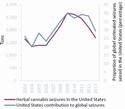
Click to enlargeSource: UNODC, responses to annual report questionnaire and other official sources.
Although the largest quantities of herbal cannabis were still seized in North America (47 per cent), the United States reported decreases in seizures between 2009 and 2013 (see figure 65). Seizures in Mexico followed a similar trend, decreasing between 2010 and 2013. Despite these recent decreases, the United States and Mexico still account for the majority of global herbal cannabis seizures. |280| Mexican authorities report the production of herbal cannabis for both local consumption and for trafficking to the United States, mainly over land, in private vehicles and buses, using various methods of concealment. |281|
Recent data show an increase in cannabis use in South America, especially in Chile (7.5 per cent annual prevalence of use) and Colombia (3.3 per cent), while herbal cannabis seizures increased sharply from 821 tons in 2012 to 1,308 tons in 2013, owing to significant seizures in Paraguay (462 tons), |282| Colombia (408 tons) and Brazil (222 tons). It is noteworthy that, in the context of international police cooperation in this region, Brazil and Paraguay conduct joint operations to eradicate marijuana in Paraguay. The Brazilian Federal Police also perform eradication operations in the northeast of Brazil. |283|
Europe: increase in cannabis market indicators, but prevalence of use remains stable
Europe is one of the world's largest consumer markets for cannabis resin, yet the market in Western Europe may now be dominated by herbal cannabis. Of the estimated 2,050 tons of cannabis consumed in the European Union and Norway in 2012, 1,280 tons were estimated by EMCDDA to be herbal cannabis, the use of which is more evenly spread across European countries than the use of cannabis resin, which is concentrated in a few countries. |284|
FIG. 66. Number and quantity of cannabis seizures in Europe, 2003-2013

Click to enlargeSource: UNODC, responses to annual report questionnaire and other official sources.
The quantity of herbal cannabis seized in Europe increased from 284 tons in 2012 to around 362 tons in 2013, primarily due to seizures in South-Eastern Europe. Seizures of cannabis resin also increased in Europe from 480 tons in 2012 to 560 tons in 2013, again primarily due to seizures in South-Eastern Europe, specifically in Turkey, where seizures of cannabis resin increased from 27 tons in 2012 to 94 tons in 2013. However, quantities of cannabis resin seized in Spain, where cannabis resin seizures are the largest in Europe, have decreased for five consecutive years; almost all of the cannabis resin that enters the country continues to be of Moroccan origin and the main mode of transportation is by sea, in speedboats, sailboats and fishing vessels.
In recent years, the price and potency of cannabis products in Europe has increased. |285| In countries with available information, there has been an increase in both the cultivation of cannabis plants and the reported eradication of cannabis plants and production sites. The cannabis market in Europe is marked by high demand and a variety of products, the production of which is sometimes linked to violence and other criminal activities, |286| as organized criminal groups have become involved in the trafficking of cannabis.
Even though domestic production of cannabis is widespread, there are still signs that it may not be sufficient to meet European market demand. For example, in the United Kingdom seizures at the border of both herbal cannabis and cannabis resin are increasing, while seizures of locally grown cannabis plants (sinsemilla) are decreasing. On the one hand, such trends may suggest that domestic production is not sufficient to satisfy demand, which may increasingly rely on imported products. On the other hand, the detection of cannabis plant cultivation sites, usually indoors, may have become a growing challenge for law enforcement, as there is an increasing tendency for criminal groups to run numerous small-scale cultivation sites rather than few large-scale plantations in order to mitigate the risk of detection. |287|
Although the prevalence of cannabis use remains high in Western and Central Europe (5.7 per cent), there is evidence of stabilizing or decreasing trends, especially in countries with long and established cannabis use. Information on the use of NPS in Europe is not comprehensive and does not establish whether the decrease in cannabis use is associated with the emerging use of synthetic can-nabinoids or other NPS.
Asia: cannabis consumption remains below global levels
Cannabis consumption in Asia seems to continue to be below global levels, although reliable estimates of prevalence of use are available for only a few countries. Cannabis is the most common illicitly used substance in the region, with an annual prevalence of use among those aged 15-64 of 1.9 per cent. Experts perceive an increase in its use, but the quantities of herbal cannabis seized remained stable overall in most parts of Asia in 2013, totalling 292 tons. South Asia continued to account for the majority of the quantities of cannabis resin intercepted in the subregion, but countries in the Near and Middle East/South-West Asia reported that seizures of cannabis resin originating in Afghanistan were increasing. This trend continued in 2013, marking the increasing importance of Afghanistan in the global supply of cannabis resin and highlighting the fact that the same trafficking routes are being used for the smuggling of different substances. In 2013, Pakistan reported seizures of almost twice the quantity seized in 2012, mentioning Afghanistan as the source country for all the cannabis resin seized.
Oceania: high levels of use, fed by domestic cultivation
Information about drug use in Oceania is limited to Australia and New Zealand, where there are high levels of cannabis use (10.7 per cent annual prevalence of use). With a high frequency of cannabis experimentation and use within the general population, cannabis is the most widely used illicit drug in New Zealand and accounts for most illicit-drug-related hospital admissions. Cannabis cultivation remains a predominantly domestic matter in New Zealand, with no evidence of large-scale imports or exports of cannabis or any of its derivatives.
Cannabis is also the most common drug used (both past-year and lifetime use) in Australia, with prevalence and frequency of use having remained stable between 2010 and 2013. The median age of cannabis users rose from 27 in 2001 to 30 in 2013, suggesting the existence of an ageing cohort of drug users in Australia, while perceptions regarding cannabis supply suggest an increased general tolerance to cannabis use. |288|
FIG. 67. Cannabis use in Australia
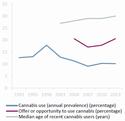
Click to enlargeSource: Australian Institute of Health and Welfare, National Drug Strategy Household Survey, detailed report 2013.
FIG. 68. Forms of cannabis used, recent users in Australia aged 14 years or older (past-year use)
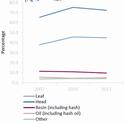
Click to enlargeSource: Australian Institute of Health and Welfare, National Drug Strategy Household Survey, detailed report 2013.
Herbal cannabis continues to be the most seized illicit drug in Oceania. The quantity of herbal cannabis seized in Australia in 2013 was the highest reported in the past decade, |289| whereas in New Zealand, it remained relatively stable. In Australia, the retail cannabis price has remained stable while THC content is thought to have increased in the past decade, |290| suggesting a potential increase in the availability of the drug.
Africa: increases in cannabis cultivation and production
Cannabis cultivation, production, trafficking and use occur in all parts of Africa. |291| There is only limited information available on the drug use situation in Africa, but the prevalence of cannabis use in the region is estimated to be high (7.5 per cent of the population aged 15-64) compared with the global average (3.9 per cent), and is particularly high in West and Central Africa (12.4 per cent). In 2013, Egypt, Morocco and Nigeria each reported seizing over 200 tons of cannabis herb. Between 1990 and 2011, Morocco reported the largest annual quantities of cannabis resin seized in North Africa and continued to seize significant quantities of cannabis resin in 2012 and 2013 (137 tons and 107 tons, respectively). Since 2012, however, with 157 tons intercepted in 2012 and 212 tons in 2013, Algeria is now reporting the largest annual quantities of cannabis resin seized in North Africa, which the country attributes to law enforcement efforts. |292|
IS CANNABIS BECOMING MORE HARMFUL? Measured in terms of THC (9-tetrahydrocannabinol) content, cannabis potency is often linked to how harmful cannabis may be. Higher THC content has been associated with anxiety, depression, an increased risk of dependence, psychotic symptoms and effects on the respiratory and cardiovascular systems, particularly among regular users, although anxiety or psychotic symptoms may also occur in recent and inexperienced users.� A recent study in south London suggests the risk of psychosis is three times higher in users of high-potency herbal cannabis ("skunk") than in non-users.b,c
The presence in cannabis of CBD (cannabidiol), a cannabinoid with anti-psychotic properties,d,e may partially counterbalance the harm caused by THC. This interaction should be taken into account when analysing cannabis potency, yet CBD is not frequently monitored, which leads to difficulties in assessing the harm caused by cannabis and public health implications. Globally, cannabis potency data is very scarce, but in countries with available information there are signs of an increase in THC content, particularly in the past decade, and in cannabis-related health problems. A systematic review of THC content in herbal cannabis has suggested that it is increasing, although the increase is not constant and does not exceed 5 per cent globally.f
Trends in mean potency (percentage of THC) of cannabis products sold in "coffee shops" in the Netherlands, 1999-2014
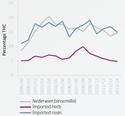
Click to enlargeSource: Trimbos Institute.
Trends in median CBD content of cannabis products sold in "coffee shops" in the Netherlands, 2005-2014
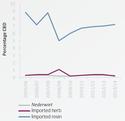
Click to enlargeSource: Trimbos Institute.
Reporting an average potency of over 10 per cent in 2012,g most European countries experienced an increase in THC content, mainly in herbal cannabis, from 2006 to 2012. In the past two decades, there has also been a change in users' preferences in Europe, most notably in the Central and Western part of the region, where cannabis markets are the largest. Data suggest a shift from cannabis resin to herbal cannabis, with increasing use of domestic, as opposed to imported, products, particularly sinsemilla (unfertilized female plants), characterized by high levels of THC and very low levels of CBD.h
The past decade has seen rapid advancement in cannabis plant cultivation techniques in some European countries, leading to the spread of domestic (indoor) cultivation, thereby reducing reliance on imported cannabis products.i Indoor cannabis plant cultivation, using controlled growing conditions and genetically selected strains, has led to an increase in the number of harvests, as well as in yield and potency. Selective breeding, which mainly focuses on achieving high THC content, has also resulted in the selection of varieties containing less CBD.j
Data on cannabis samples sold in "coffee shops" in the Netherlands show that the THC content of the two most consumed cannabis products — imported cannabis resin and domestically produced (Dutch) herbal cannabis or nederwiet (mostly sinsemilla) — has stabilized at high levels (around 15 per cent) in recent years, while CBD content has remained low (under 1 per cent) in nederwiet but comparatively high in imported resin (7 per cent).k
Even within a specific strain of cannabis there may be great variability in content, suggesting that users may be unwittingly exposed to very different levels of THC and CBD.l Moreover, the change in users' preferences, from traditional (seeded) herbal cannabis to sinsemilla, suggests an increased level of risk exposure in Europe.
Despite evidence of stabilizing or decreasing trends in the prevalence of cannabis use in Europe, particularly in countries with established levels of cannabis use, there are indications of increases in cannabis-related health problems. Between 2006 and 2012, the number of individuals (first admissions to drug treatment) seeking help for cannabis use in Europe rose from 45,000 to 59,000, nearly half of whom (49 per cent) were daily users; and cannabis has become the most frequent drug reported as the main reason for first-time entrants for treatment."m Moreover, cannabis-related emergency episodes have seen an increase in Europe, particularly in countries with the highest prevalence of use.
THC and CBD content in cannabis samples, cannabis-treatment admissions and marijuana-related hospital emergencies, United States, 1993-2013
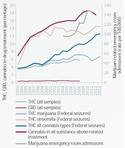
Click to enlargeSources: Z. Mehmedic and others, "Potency trends of Δ9-THC and other cannabinoids"; and SAMHSA.
In Oceania, recent data also suggest that the THC content of cannabis may be increasing. A first systematic analysis of the potency of cannabis at the street level in Australia was carried out in 2013 and showed high levels of THC content. Analysis of samples taken from recreational users in possession of up to 15 g of cannabis revealed an average THC content of just under 15 per cent and a CBD content of 0.14 per cent. The shift towards increasing use of cannabis with high THC and low CBD content has also been linked to an increase in drug treatment demand and in the risk of cannabis dependence and vulnerability to psychosis, but there is little evidence of the direct impact of potency.n In New Zealand, there have also been suggestions of an increase in the THC content of herbal cannabis in the past two decades.o
The THC content of cannabis in the United States increased from less than 3.4 per cent in 1993 to 8.8 per cent in 2008, whereas CBD content remained low and invariable over time (0.4 per cent in 2008).p Federal seizure data show that the THC content of marijuana has increased in the past two decades, from 3.7 per cent in 1993 to 12.6 per cent in 2013, reflecting a higher proportion of sinsemilla in the market (with a THC content of 14.5 per cent in 2013). Available data in the United States show an increasing trend in cannabis-related treatments in the past two decades, from 6.9 per cent in 1993 to 17.5 per cent in 2012, along with increasing cannabis-related hospital admissions.q
� W. Hall, "What has research over the past two decades revealed about the adverse health effects of recreational cannabis use?", Addiction, vol. 110, No. 1 (2015), pp. 19-35.
b Marta Di Forti and others, "Proportion of patients in south London with first-episode psychosis attributable to use of high potency cannabis: a case-control study", The Lancet Psychiatry,
vol. 2, No. 3 (2015), pp. 233-238.
c It should be noted that this is specific to "skunk", as other can-nabis products may result in different risks.
d A. W. Zuardi and others, "Cannabidiol, a Cannabis sativa constituent, as an antipsychotic drug", Brazilian Journal of Medical and Biological Research, vol. 39, No. 4 (2006), pp. 421-429.
e A. Englund and others, "Cannabidiol inhibits THC-elicited paranoid symptoms and hyppocampal-dependent memory impairment", Journal of Psychopharmacology, vol. 27, No. 1 (2013), pp. 19-27.
f F. Cascini, F. C. Aiello and G. L. Di Tanna, "Increasing delta-9-tetrahydrocannabinol (-9-THC) content in herbal cannabis over time: systematic review and meta-analysis", Current Drug Abuse Reviews, No. 5, vol. 1 (2012), pp. 32-40.
g EMCDDA, Statistical Bulletin 2014.
h EMCDDA, Cannabis Production and Markets in Europe, EMCDDA Insights Series No. 12 (Luxembourg, Office for Official Publications of the European Union, 2012).
i Phenomenon of "import substitution" referred by Jansen A. M. (2002), "The economics of cannabis cultivation in Europe", paper presented at the 2nd European Conference on Drug Trafficking and Law Enforcement, Paris 26-27 Sept. 2002. Available at: www.cedro-uva.org/lib/jansen.economics.html.
j EMCDDA (2012), Cannabis Production and Markets in Europe. EMCDDA Insights Series No.12 (Luxembourg, Office for Official Publications of the European Union, 2012).
k S. Rigter and R. Niesink, THC-concentraties in wiet, nederwiet en hasj in Nederlandsecoffeeshop, 2013-2014 (Utrecht, Netherlands Institute of Mental Health and Addiction (Trimbos Institut), 2014).
l D. J. Potter, P. Clark and M. B. Brown, "Potency of Δ9-THC and other cannabinoids in cannabis in England in 2005: implications for psychoactivity and pharmacology", Journal of Forensic Sciences, vol. 53, No. 1 (2008), pp. 90-94.
m EMCDDA, European Drug Report 2014.
n Swift and others, "Analysis of Cannabis Seizures in New South Wales, Australia: cannabinoid profile and implications", PLOS ONE (2013).
o G. Knight and others, "The results of an experimental indoor hydroponic Cannabis growing study, using the 'Screen of Green' (ScrOG) method-Yield, tetrahydrocannabinol (THC) and DNA analysis", Forensic Science International, vol. 202, Nos. 1-3 (2010), pp. 36-44.
p Mehmedic and others, "Potency trends of Δ9-THC and other cannabinoids in confiscated cannabis preparations from 1993 to 2008" (see footnote 279).
q Ibid.
REGULATED COMMERCIAL CANNABIS� MARKETS: WHAT CAN WE LEARN FROM THE STATE OF COLORADO? Recent changes in cannabis policy
In the United States, following the recent implementation of commercial marijuana markets in the states of Coloradob and Washington,c the states of Alaskad and Oregone passed laws in 2014 that make legal the "production, sale, and use of marijuana" for persons aged 21 and older, while the District of Columbia voted to remove criminal and civil penalties for adult possession of marijuana and personal marijuana cultivation.f Outside the United States, the parliament in Jamaicag recently passed a law allowing for possession of 2 ounces or less, personal cultivation of five or fewer plants and the legal use of marijuana by Rastafarians for religious purposes.h Uruguay is currently in the process of implementing the commercial regulation of cannabis following changes to the law in 2012.
United States, state of Colorado: the first year of a regulated commercial marijuana market
The right to purchase marijuana legally in the state of Colorado occurred gradually. In 2000, voters approved a measure to make medical marijuana legal for the treatment of certain conditions,i but the commercialization of medical marijuana did not become widespread until 2009.j Three years later, in 2012, Amendment 64 regulated marijuana similarly to alcohol and, as of 1 January 2014, Colorado became the first state to implement retail sales of marijuana for recreational use to adults aged 21 years or older.k One year later, 502 licensed medical marijuana dispensaries and 322 retail marijuana stores were operating throughout the state.l
According to recent marijuana prevalence estimates for Colorado, adjusted for population growth and underreporting,m there were an estimated 686,000 adult residents in 2014 who used marijuana at least once per year. A 2014 reportn estimated the total market demand of this population and non-residents to be some 130.3 tons (range: 104.2-157.9).� Compared with the current estimated supply of 77 tonsp (42 per cent of which is consumed for medical use), the demand for cannabis is far greater than licit supply can meet. It is thus likely that an estimated 53 tons would need to be supplied by personal home production and by unlicensed or out-of-state producers.
In addition to inhaled or smoked forms of cannabis herb and resin, the commercial marketplace has made available a wide range of THC-containing food products, or "edibles", which may increase the risk of accidental ingestion, acute intoxication, psychosis, poisoning and intoxication-related injury or death.q In contrast to inhaled THC-containing products, which take effect after a few seconds or minutes, oral consumption has a delayed effect of between 30 and 90 minutes that lasts from 4 to 12 hours, far longer than psychotropic effects from inhalation, which last around 2 to 3 hours. This may lead to ingestion of greater quantities of THC than desired.r
Health impacts
Prevalence of past-year marijuana use (aged 12 or older) in the United States, 2006-2013
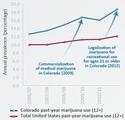
Click to enlargeSource: United States, National Survey on Drug Use and Health, SAMHSA.
According to the results of the United States National Survey on Drug Use and Health, the prevalence of marijuana use in Colorado is higher, and is increasing faster, than the national average. There is no causal evidence to connect legislation to prevalence of use, but peaks in past-year prevalence appear to coincide with laws easing restrictions on personal consumption.
Mirroring trends in prevalence of use of marijuana in Colorado, the number of primary treatment admissions per 100,000 is high and growing among persons aged 12 or older, and has exceeded the national average since 2003.
Drug treatment admissions for marijuana, by number of admissions and per 100,000 of the population aged 12 or older in the state of Colorado and in the United States as a whole, 2001-2012
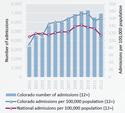
Click to enlargeSource: United States, Treatment Episode Data Set (2001-2012), SAMHSA.
Reaching an average of 18.7 per cent, according to the laboratory responsible for state-mandated testing, the THC concentration of legally sold cannabis in Colorado is relatively high.s Perhaps serving as an early indicator of the acute effects of increased access to high-potency marijuana and THC-containing products, calls to the Rocky Mountain Poison and Drug Center concerning marijuana doubled between 2013 and 2014. In addition, emergency room data indicate that there has been a number of severe burns from attempted THC extraction from cannabis plants and cyclic vomiting caused by the ingestion of high THC-content products (cases doubled following medical marijuana legalization), and unintentional marijuana ingestion among children (from zero in the five years prior to medical liberalization, to 14 between 2009 and 2011, among admissions to the Children's Hospital of Colorado).t
Moreover, according to the Colorado State Patrol, marijuana was related to 12.2 per cent of all citations for driving under the influence of any substance in 2014, while among road accidents involving fatalities the number of drivers who tested positive for marijuana doubled from 37 in 2006 to 78 in 2012. It will, however, be several years before any change specifically attributable to retail marijuana sales and traffic deaths is evident.
Monthly revenue (United States dollars) from sales tax, excise tax, licences and fees for retail and medical marijuana, and total monthly tax revenue, United States, state of Colorado, 2014
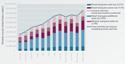
Click to enlargeSource: United States, Colorado Department of Revenue.
Criminal justice
As expected, arrests for possession (2 ounces or less) and cases brought to state court declined significantly from 2012 to 2013 across Colorado, freeing law enforcement resources otherwise spent on making marijuana-related arrests, whereas marijuana-related arrests in the border counties of the neighbouring state of Nebraska have increased significantly.u Arrests at Colorado schoolsv for marijuana charges have also increased, although only slightly, from 273 in 2012/13 to 289 in 2013/14, but several years of data will be required before the impact of commercially available marijuana on youth behaviour can be properly interpreted.
State revenues
Following strong growth in 2014, monthly tax revenues from the retail and medical marijuana markets in the state of Colorado ended at nearly triple the revenue earned in January, bringing in over $8.5 million in the month of December alone. In revenue from sales, licences and fees in both the medical and retail marijuana markets, the state is poised to net approximately $76 millionw in the 2014 calendar year.
� To be consistent with legal language from bills pertaining to cannabis as "marijuana" throughout the Americas, the term marijuana in the present section of the report refers to all cannabis products and in some cases tetrahydrocannabinol (THC) containing products.
b Data from Amendment 64: Use and Regulation of Marijuana (United States, Constitution of the State of Colorado, art. XVIII, sect. 16).
c United States, State of Washington, Initiative Measure No. 502.
d United States, State of Alaska, Ballot Measure No. 2: 13PSUM An Act to Tax and Regulate the Production, Sale, and Use of Marijuana.
e United States, State of Oregon, Measure 91: Control, Regulation, and Taxation of Marijuana and Industrial Hemp Act.
f United States, District of Columbia, Ballot Initiative No. 71, which took effect in July 2014, will allow up to 2 ounces of marijuana and cultivation of up to six plants. As the District of Columbia does not have statehood, thereby falling under Federal governance, this initiative may not fall under the same provision as those of states.
g Jamaica, Dangerous Drugs (Amendment) Act, 2015.
h "Jamaica poised to relax cannabis laws", The Guardian (London), 22 January 2015.
i United States, Constitution of the State of Colorado, 0-4-287, art. XVIII, miscellaneous art. XVIII.
j See United States, Department of Justice, "Memorandum for selected United States attorneys on investigations and prosecutions in states authorizing the medical use of marijuana", 19 October 2009.
k In November 2012, Colorado voters passed Constitutional Amendment 64, which legalized marijuana for recreational purposes for anyone over 21 years of age. Retail stores opened on 1 January 2014.
l United States, State of Colorado, Department of Revenue, Enforcement Division, MED Licensed Facilities (Medical marijuana facilities, Retail Marijuana Facilities).
m Demand estimates for 2014 were based on the prevalence of past-year users estimated by the National Survey on Drug Use and Health (NSDUH) 2010 and 2011 survey results, stratified by frequency of use and adjusted for population growth (5.3 per cent) and underreporting (22.2 per cent adjustment among users who use 20 days or less per month and 11.1 per cent for those who use more frequently), see Miles K. Light and others, "Market size and demand for marijuana in Colorado" (July 2015), prepared for the Colorado Department of Revenue, p. 15.
n Light and others, "Market size and demand for marijuana in Colorado" (July 2015), prepared for the Colorado Department of Revenue.
o The total amount estimated for use (130.3 tons) includes an estimated 121.4 tons for residents and 8.9 tons for visitors. The quantity of marijuana in demand for the estimated 184,000 residents under the age of 21 who reported use in the past year was not included.
p Light and others, "Market size and demand for marijuana in Colorado" (see footnote 210).
q T. S. Ghosh and others, "Medical marijuana's public health lessons: implications for retail marijuana in Colorado", New England Journal of Medicine, vol. 372, No. 11 (2015), pp. 991-993.
r F. Grotenhermen, "Pharmacokinetics and pharmacodynamics of cannabinoids", Clinical Pharmacokinetics, vol. 42, No. 4 (2003), pp. 327-360.
s "State mandated testing of retail marijuana in Colorado", presentation made by Andy LaFrate from Charas Scientific to the 249th American Chemical Society National Meeting and Exposition, Denver, Colorado, March 2015.
t A. A. Monte and others, "The implications of marijuana legalization in Colorado", Journal of the American Medical Association, vol. 313, No. 3 (2015), pp. 241 and 242.
u J. M. Ellison and R. Spohn, "Colorado's legalization of medicinal marijuana: the effects on Nebraska's law enforcement and local jail system" (Nebraska Center for Justice Research, University of Nebraska at Omaha, 2015).
v United States, Denver Police Department Versadex and OSI databases.
w United States, Colorado Department of Revenue.
SYNTHETIC DRUGS: |293| amphetamine-type stimulants and new psychoactive substances
Key figures
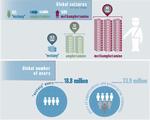
Click to enlargeNote: Data for seizures and number of users are from 2013. Amphetamines include both amphetamine and methamphetamine.
MAP 3. Methamphetamine flows as perceived by recipient countries, 2011-2013
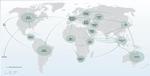
Click to enlargeSource: UNODC, responses to annual report questionnaire, 2011-2013.
Note: The origins of the flow arrows do not necessarily indicate the source/manufacture of methamphetamine. These arrows represent the flows as perceived by recipient countries. Flow arrows represent the direction of methamphetamine trafficking and are not an indication of the quantity trafficked. The boundaries shown on this map do not imply official endorsement or acceptance by the United Nations. Dashed lines represent undetermined boundaries. The dotted line represents approximately the Line of Control in Jammu and Kashmir agreed upon by India and Pakistan. The final status of Jammu and Kashmir has not yet been agreed upon by the parties. The final boundary between the Sudan and South Sudan has not yet been determined.The global market for synthetic drugs, which for the purposes of the present report includes amphetamine-type stimulants (ATS) and new psychoactive substances (NPS), continues to be dominated by methamphetamine, with East and South-East Asia accounting for the largest seizures reported worldwide. The market for methamphetamine is becoming increasingly diversified. In addition to the established and growing market for methamphetamine in East and South-East Asia, there are also indications of increasing use in parts of North America and Europe. Seizure data for "ecstasy" and its precursor chemicals point to the growing availability of "ecstasy" in East and South-East Asia.
Regarding the large numbers of NPS |294| which have emerged in recent years, it remains unclear whether they are displacing existing drugs under international control, in either the short or long term, or whether they are diversifying the range of synthetic drugs available on the market. Although prevalence figures for synthetic can-nabinoids in the United States and mephedrone in the United Kingdom suggest declining use of these substances, a growing number of countries has been reporting a wider range of emerging NPS and worrying developments such as the injecting use of NPS. Up to December 2014, a total of 541 NPS were reported to the UNODC early warning advisory by 95 countries and territories, through data submissions from Member States and national drug testing laboratories participating in the international collaborative exercises programme. |295| While there are large numbers of NPS available on the synthetic drugs market globally, emergence and persistence patterns of these substances show significant differences between countries and regions.
Methamphetamine is driving the increase in ATS seizures
FIG. 69. Total seizures of amphetamine-type stimulants reported worldwide, 2009-2013
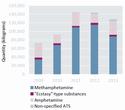
Click to enlargeSource: UNODC, responses to annual report questionnaire, 2009-2013.
Note: The category "non-specified ATS" includes seizures reported to UNODC as ATS without indicating a specific substance and excludes prescription stimulants.Surging seizures since 2009 point to a rapid expansion of the global ATS market, with ATS seizures almost doubling to reach over 144 tons in 2011 and 2012 — the highest ATS seizure amounts since UNODC systematic monitoring began — before decreasing slightly in 2013 (see figure 69). The increase from 2009 is primarily attributable to the growing amount of methamphetamine seized, which increased from 34 tons in 2009 to 88 tons in 2013. The growing importance of methamphetamine is a rather recent feature of the global ATS market. Over the years, global amphetamine seizures have fluctuated, ranging between about 20 tons and 33 tons annually since 2009. Global "ecstasy" seizures were low compared with amphetamine and methamphetamine seizures and remained under 5 tons annually between 2009 and 2013.
Increasing interconnections in the methamphetamine market
While methamphetamine continues to be primarily trafficked within regions, significant increases in metham-phetamine seizures observed in the past five years would seem to indicate the establishment of new trafficking routes linking previously unconnected regional metham-phetamine markets (see map 3). New international supply channels linking major methamphetamine markets in North America and East and South-East Asia have been observed. In addition, methamphetamine trafficking routes to East and South-East Asia have emerged from several parts of Africa and the Americas. West Africa in particular appears to have become an established source of methamphetamine trafficked to East and South-East Asia via South Africa or Europe. Turkey may have emerged as a transit point for methamphetamine smuggled from Western Asia to Western and Central Europe. Recently, there have also been reports of methamphetamine trafficking from Western and Central Europe to North America, South America and East and South-East Asia.
New trends in methamphetamine use
Methamphetamine use continues to be a major problem in large parts of East and South-East Asia and accounts for a large share of people receiving drug treatment in a number of countries in the subregion. In 2013, people receiving treatment for methamphetamine use accounted for the majority of people treated for drug use in many countries. |296| |297|
Methamphetamine use in the United States displays a stable trend, with annual prevalence of methamphetamine use among the general population aged 15-64 having remained in the range of 0.5 to 0.6 per cent between 2010 and 2013. However, there are recent indications of increases in methamphetamine use in certain parts of the United States. In Minneapolis/Saint Paul, a 19 per cent increase in the number of people treated for methamphetamine use between 2011 and 2012 was reported. |298| In the state of Ohio, there was a 34 per cent increase in the number of people receiving treatment for methampheta-mine use between 2009 and 2012. |299| In San Diego, deaths related to methamphetamine use have increased by more than 70 per cent between 2008 and 2012. |300|
In Europe, while amphetamine and "ecstasy" continue to account for the bulk of ATS seizures, there appears to be increasing availability of crystalline methamphetamine, including in countries where reports on the use of methamphetamine have not been common in the past. According to the Federal Criminal Police Office in Germany, the number of first-time crystalline methamphetamine users increased by almost 7 per cent to 2,746 users in 2013, crystalline methamphetamine seizure cases rose by about 10 per cent to 3,847 cases and the quantity of the drug seized increased by 88 per cent to 75.2 kg in the same year. |301| The results of a survey in Frankfurt, Germany, found high methamphetamine use among people in the techno-party scene in 2012. |302| According to EMCDDA, there have been new reports from Greece and Turkey of the smoking of methamphetamine. |303| In Greece, crystalline methamphetamine seizures increased from only 1 kg in 2012 to 15 kg in 2013 and, according to the Turkish National Police, crystalline methamphetamine makes up the majority of methamphetamine seizures in the country. |304| EMCDDA also reports an emergence of crystalline methamphetamine smoking among people who inject opioids in southern European countries. |305|
For some years, methamphetamine has dominated the market in the Czech Republic and Slovakia. However, in 2013, methamphetamine seizures not only accounted for the largest share of ATS seizures reported in the Czech Republic and Slovakia, but also in some countries in the Baltics and Eastern Europe, such as Belarus, Latvia, Lithuania and the Republic of Moldova, as well as Cyprus, Greece and Portugal.
A diversified market for methamphetamine in East and South-East Asia
The methamphetamine sold in East and South-East Asia is presented in two main forms: methamphetamine tablets and crystalline methamphetamine. In both cases, meth-amphetamine is available in salt form, most frequently as methamphetamine hydrochloride, which, in principle, can be smoked, nasally insufflated, orally ingested and injected. Methamphetamine tablets, commonly known as "yaba" in the subregion, are small pills, typically of low purity, which are available in many different shapes and colours. In addition to methamphetamine, such tablets often contain a large portion of caffeine, plus a range of adulterants. In the case of methamphetamine tablets, both ingestion and smoking of the crushed tablets are common. Crystalline methamphetamine, also called "crystal meth", "ice" or "shabu", is usually of much higher purity than the tablet form. It is encountered on the illicit drug market as (crushed) colourless crystals of different sizes. In the case of crystalline methamphetamine, smoking, nasal insufflation and injecting are typical forms of consumption. |306|
FIG. 70. Crystalline methamphetamine and methamphetamine tablet seizures reported in East and South-East Asia, 2009-2013
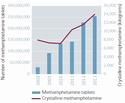
Click to enlargeSource: Drug Abuse Information Network for Asia and the Pacific.
Information on seizures and use indicate that the market for both forms of methamphetamine is expanding. Seizures of methamphetamine tablets and crystalline meth-amphetamine generally increased in East and South-East Asia between 2008 and 2013 (see figure 70). Crystalline methamphetamine seizures in the region almost doubled over this period, while methamphetamine tablet seizures have risen at a more rapid rate resulting in an eight-fold increase.
Unlike methamphetamine tablets, which, by and large, have remained a feature of the Mekong region, crystalline methamphetamine has become geographically widespread across East and South-East Asia. |307|
Methamphetamine tablets are mainly manufactured in the Mekong region of East and South-East Asia, with seizure reports indicating that such tablets are mostly intended for markets within that subregion. Myanmar is perceived to be the main country of origin for methamphetamine tablets seized throughout the Mekong region and in some other parts of East and South-East Asia. Reports of meth-amphetamine tablets originating in Myanmar and seized in China and Thailand indicate that increasing quantities are being trafficked from Myanmar across the shared borders of those countries. |308|
Crystalline methamphetamine: increased interconnectedness
Although crystalline methamphetamine continues to be manufactured on a large scale in East and South-East Asia, a complex international trafficking pattern of crystalline methamphetamine originating in other parts of the world has evolved in recent years. For a number of years, crystalline methamphetamine has been trafficked from Africa to countries in East and South-East Asia, such as Cambodia, China, Indonesia, Japan, Malaysia, Thailand, Viet Nam and more recently the Philippines. |309| Recently, East and South-East Asian countries have also reported crystalline methamphetamine seizures perceived to have originated in Western Asia. |310| Since 2013, shipments of crystalline methamphetamine seized in East and South-East Asia and Oceania have been perceived to have originated in Mexico. In particular, large consignments, perceived to have originated in Mexico, totalling more than 0.4 tons and 0.2 tons of crystalline methamphetamine, were reported to have been seized in Japan in 2013 and 2014, respectively. |311| In 2013, Australia, the Philippines and the Republic of Korea also reported the seizure of crystalline methamphetamine perceived to have originated in Mexico. |312|
In North America, there may be an increase in crystalline methamphetamine trafficking from Mexico to the United States. According to the United States Drug Enforcement Administration, between 2012 and 2013 the amount of methamphetamine seized in powder and crystalline form along the south-west border of the United States increased by 18.5 per cent. |313| Moreover, increasing trafficking to the United States of methamphetamine in liquid form for later conversion to crystalline methamphetamine was reported. |314| In 2013, Mexico also reported the seizure of more than 3.3 tons of liquid methamphetamine. However, not all of the crystalline methamphetamine manufactured in North America may be intended for the region. For instance, methamphetamine trafficked from Mexico to Japan is perceived to have increased in 2013, which further points to a more globalized crystalline methamphetamine market.
Regional shift in the "ecstasy" market?
In 2012, "ecstasy" seizures in East and South-East Asia and Oceania surged to almost 2 tons, just under the 2.3 tons seized in Europe, but much higher than the 0.7 tons seized in the Americas. East and South-East Asia and Oceania may be becoming an emerging driver of the global market for "ecstasy", while seizures in the Americas have declined, dropping by 81 per cent between 2009 and 2012. Although "ecstasy" seizures in East and South-East Asia and Oceania declined to 1 ton in 2013, seizures continued to be at a higher level than in 2008-2011, and in 2014 multi-ton seizures were reported by law enforcement authorities in Australia |315| and Myanmar. |316|
Insufficient data are available to establish the size of the "ecstasy" market based on use figures for East and SouthEast Asia and Oceania. Nevertheless, data on specific population groups suggest widespread use in certain countries. In Indonesia, a national survey among transportation workers in 2013 found that, at 1.4 per cent annual prevalence of use, "ecstasy" was the second most used drug after cannabis at 4.9 per cent. |317| At 1.3 tons, Indonesia reported the largest quantity of "ecstasy" seizures in the world in 2012, which was reportedly intended in its entirety for supplying the domestic market. This points to the presence of a large amount of "ecstasy" in the country in that year.
There have also been indications of "ecstasy" use emerging in the Mekong region. According to expert perceptions in 2012, "ecstasy" use had increased in Cambodia, Thailand and Viet Nam. Although low levels of "ecstasy" seizures were reported in Cambodia and Thailand, seizures in Viet Nam increased to almost 0.2 tons in 2012.
FIG. 71. Number of times countries in East and South-East Asia and Oceania have been identified as countries of origin for "ecstasy" seized in other regions worldwide, 2007-2013
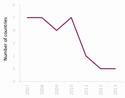
Click to enlargeSource: UNODC, responses to annual report questionnaire, 2007-2013.
The large amount of MDMA chemical precursors recently seized in East and South-East Asia and Oceania implies that there may be considerable "ecstasy" manufacture in these subregions. Based on commonly used MDMA manufacturing methods, as outlined by the International Narcotics Control Board, the almost 66,000 litres of safrole and 3,4-MDP-2-P seized in the region in 2011 and 2012 could theoretically have been sufficient to produce about 44 tons of "ecstasy". |318| This amount far exceeds the total "ecstasy" seized worldwide in both 2011 and 2012, which amounted to 9 tons. Although "ecstasy" is manufactured in East and South-East Asia and Oceania, a decreasing number of "ecstasy" trafficking attempts from these countries are being intercepted in other parts of the world (see figure 71).
Links and interaction between new psychoactive substances and other drugs
In the past few years, a growing number of NPS have been sold on illicit drug markets. NPS available on the market may or may not share effects and profiles similar to the substances under international control that they are designed to mimic. |319|
FIG. 72. Annual prevalence of cannabis and synthetic cannabinoid ("spice") use among twelfth-grade students in the United States, 2011-2014
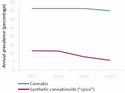
Click to enlargeSource: United States, National Institute on Drug Abuse, Monitoring the Future survey, national survey results on drug use, 1975-2014.
FIG. 73. Annual prevalence of "ecstasy" and mephedrone use among people aged 16-24 years in the United Kingdom, 2010/11-2012/13
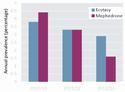
Click to enlargeSource: United Kingdom, Home Office, Drug Misuse: Findings from the 2012/13 Crime Survey for England and Wales (July, 2013).
Only limited data series are available that allow the comparison of prevalence of use trends of NPS and other drugs. The annual prevalence of cannabis use among twelfth-grade students in the United States remained stable at 36.4 per cent between 2011 and 2013 and declined only slightly in 2014 to 35.1 per cent, while synthetic can-nabinoid ("spice") use almost halved from 11.4 per cent in 2011 to 5.8 per cent in 2014 (see figure 72). The perceived harmfulness of synthetic cannabinoids among secondary school students (twelfth grade) increased between 2012, the first year of measurement, and 2014, which may have contributed to the decline in use. |320| Data from a recent qualitative study suggest that use of both herbal cannabis and synthetic cannabinoids may not be uncommon. Users may choose one or the other depending on the situation, for example preferring synthetic cannabi-noids when trying to avoid a positive drug test result. |321|
For some time, the market for "ecstasy" has been on the decline in several European countries and mephedrone and other NPS may have been serving as a substitute for "ecstasy". However, annual prevalence data for the United Kingdom show that mephedrone use may have fallen below that of "ecstasy" in recent years (see figure 73). |322| Between 2010 and 2013, annual prevalence rates of both "ecstasy" use and mephedrone use among people aged 16-24 in the United Kingdom have been on the decline. Mephedrone use among this population segment fell by almost two thirds from 4.4 per cent in 2010/11 to 1.6 per cent in 2012/13, while "ecstasy" use declined only from 3.8 per cent to 2.9 per cent over the same period. Although the prevalence of mephedrone use among people aged 16-24 in 2010/11 was 0.6 percentage points higher than that of "ecstasy", by 2012/13 "ecstasy" use was almost twice as high as mephedrone use.
Despite a possible decline in the overall demand for mephedrone in the United Kingdom, high levels of use have been observed among some segments of the population. Mephedrone use appears to be particularly common in London dance clubs. Indeed, in the Crime Survey for England and Wales in 2012/13, at 4.4 per cent the highest mephedrone use rate was found among adults who had visited a nightclub on four or more occasions in the past month. |323| Similarly, another survey of visitors to nightclubs in Rome in 2013 found that NPS were being used in addition to drugs such as cocaine. |324| Polydrug use can involve unpredictable effects and poses a serious challenge for health-care providers.
According to EMCDDA, there has been a decline in the injecting of illicit drugs in Europe, but there have been recent reports of the injecting of NPS, particularly synthetic cathinones. |325| For instance, based on reports from the treatment and needle and syringe programmes in Hungary, synthetic cathinone injecting has increased since 2010, while injecting heroin use has declined. By 2012, the number of people in Hungary treated for injecting synthetic cathinone use accounted for about 34 per cent of people in that programme. |326| Moreover, a needle and syringe programme in Bucharest reported in 2012 that 51 per cent of people in the programme injected NPS (primarily synthetic cathinones), 44 per cent injected heroin and 5 per cent injected both NPS and heroin. |327| In Austria, a survey among people receiving treatment for drug use in Graz in 2010 identified that almost 60 per cent of people were injecting mephedrone; |328| and the use of the synthetic cathinone 4-MEC |329| by people who inject drugs in Paris was reported in 2012. |330| EMCCDA has also reported that injecting use of synthetic cathinones has emerged among specific population segments in Austria, Belgium, the Czech Republic, France, Germany, Ireland, Poland, Romania, Spain and the United Kingdom. |331|
Use data for NPS at the substance level are still limited. Among the reasons for this are that there is a large number of different NPS available on the market, and some of them are sold under street names that could imply a variety of different substances. For instance, the term "spice", often used in reference to the use of synthetic cannabi-noids, does not relate to a specific substance and could instead refer to a large variety of substances. Given that users can often not identify their actual substance of use, other sources of information gain in importance. Information emerging from early warning systems on NPS has helped to identify the use of NPS and associated health risks at an early stage. |332| In Sweden, for example, a toxico-vigilance system documented widespread use of many different NPS mainly by adolescents and young male adults. |333| Based on its European early warning system on NPS, EMCDDA has undertaken an increasing number of risk assessments of NPS (eight in 2014 alone, compared with only two in the period 2009-2013), documenting the presence of NPS associated with serious negative health consequences in the region. |334| Early warning systems on NPS have also been established in a number of other countries to make information available on the emergence of NPS, health risks associated with their use and best practices to respond to those risks.
Number of new psychoactive substances reported
FIG. 74. Number of countries and territories reporting new psychoactive substances, 2008-2014
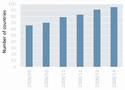
Click to enlargeSource: UNODC, early warning advisory on NPS, 2008-2014.
FIG. 75. Number of new psychoactive substances reported, 2009-2014
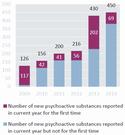
Source: UNODC, early warning advisory on NPS, 2009-2014.
Note: This graph represents only the number of different NPS reported during the respective reporting year. Not all NPS reported in one year were necessarily reported in the following year(s).By December 2014, 95 Member States and territories had reported the emergence of NPS to the UNODC early warning advisory under the global Synthetics Monitoring: Analysis, Reporting and Trends (SMART) programme, with notable variations in the number and type of NPS encountered (see figure 74). |335| The four countries or territories that reported for the first time in 2014 were the Cayman Islands (Americas), Montenegro (Europe), Peru (Americas) and Seychelles (Africa). The majority of countries and territories that reported the emergence of NPS up to December 2014 were from Europe (39), Asia (27), Africa (14), the Americas (13) and Oceania (2).
Up to December 2014, a total of 541 NPS had been reported to the UNODC early warning advisory (see figure 75). In 2014, 450 substances were reported, an increase from the 430 substances reported in 2013. Although this does not indicate a major increase, it is noteworthy that of the 450 substances reported in 2014, 69 were reported to the advisory for the first time. The large increase in NPS reported to the advisory between 2012 and 2013 was due to the expansion of data sources and data completeness in the system as well as increasing laboratory capacity to identify NPS.
FIG. 76. Number of new psychoactive substances reported, by substance group, 2014
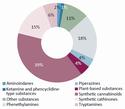
Click to enlargeSource: UNODC, early warning advisory on NPS, 2014.
In 2014, synthetic cannabinoids continued to account for the majority of NPS reported (39 per cent), followed by phenethylamines (18 per cent) and synthetic cathinones (15 per cent) (see figure 76). More synthetic cannabinoids and, to a lesser extent, synthetic cathinones were reported in 2014 than in 2013, with the majority of the other NPS substance groups remaining stable. Some decreases have been identified regarding NPS belonging to ketamine and phencyclidine-type substances, with only half the number reported in 2013 being reported in 2014 and a slight decrease in the number of reports for tryptamines. Of all reported substances in 2014, 69 were reported to the UNODC early warning advisory for the first time, including 25 synthetic cannabinoids, 16 phenethylamines and synthetic cathinones, 8 other substances and 2 aminoindanes and tryptamines.
Using the early warning advisory for NPS, different patterns in the emergence and persistence of these substances have been identified. There is frequently heterogeneity in the emergence of NPS at the country level, even within regions; that is, the overlap between different NPS found in one country and in a neighbouring country within a given period of time can be small. Some NPS have an established presence on the market and have been reported by a large number of countries over several years. These include ketamine (58 countries), khat (51 countries), mephedrone (46 countries) and JWH-018 (44 countries). More than a quarter of all countries reporting the emergence of NPS worldwide have reported only one substance, most of which were reports of plant-based NPS and ketamine. About 47 per cent of countries reporting the emergence of NPS have identified 10 substances or less, while approximately 18 per cent have identified more than 100 different NPS since 2008.
Synthetic cannabinoids: the challenge of diversity
Synthetic cannabinoid receptor agonists, commonly referred to as synthetic cannabinoids, constitute the largest, most diversified and fastest growing group of NPS on the market. Since 2004, many different synthetic cannabinoids have been detected in herbal smoking blends sold on the Internet and in specialized shops under a variety of brand names. These products typically contain dried and shredded plant material with no intrinsic psychoactive properties, but which is soaked in or sprayed with one or several synthetic cannabinoids.
In 2014, 177 different synthetic cannabinoids were reported to the UNODC early warning advisory. The emergence of products containing synthetic cannabinoids on the market is not a new phenomenon; however, it is only since 2008 that their use has gained increasing popularity as "legal cannabis substitutes". Since then, the emergence of hundreds of products containing different synthetic cannabinoids has been reported to the advisory by 58 countries and territories, and the attention of the international community has been drawn to their clandestine manufacture, the serious risks they pose to public health and society and the challenges for drug control.
Since the discovery of the cannabinoid receptors CB1 and CB2 in the 1980s, there has been continued growth and evolution of a series of chemical families of synthetic can-nabinoids. Their emergence on the NPS market has been characterized by the introduction of successive structural modifications seemingly to keep their legal status ambiguous. This can be illustrated by the emergence of naphthoy-lindoles (e.g. JWH-018) and the more recent emergence of naphthoylindazoles (e.g. THJ-018) and indazole car-boxamides (e.g. AKB-48). |336|
The structural diversity and rapid development of new derivatives of synthetic cannabinoids pose serious challenges to legislative control at the national and international levels. In response to these challenges, innovative legal approaches complementing the traditional control of drugs have been adopted at the national level by some countries to protect the population from health risks caused by the open sale of synthetic cannabinoids. An example of this approach is the control of synthetic can-nabinoids based on their effect on the brain recently used in some countries, including the United States and Luxembourg. The United States introduced the neurochemical approach to control synthetic cannabinoids or "cannabi-mimetic agents", under the Synthetic Drug Abuse Prevention Act 2012 and defined them as "any substance that is a cannabinoid receptor type 1 (CB1 receptor) agonist as demonstrated by binding studies and functional assays" within defined structural classes. The definition includes a group of substances with possible chemical variations, but which have a specific effect through binding to the CB1 receptor.
During its fifty-eighth session, in March 2015, the Commission on Narcotic Drugs decided to place 10 NPS under international control, among them two synthetic cannabinoids, JWH-018 and AM-2201, which were added to Schedule II of the Convention on Psychotropic Substances of 1971.
The transient nature of new psychoactive substances
Although a growing number of NPS are being reported by a larger number of countries every year, some NPS are found to be transient. For instance, of the 541 NPS reported up to December 2014, 16 substances had not been reported since 2012 and 49 had not been reported since 2013. Several NPS have only been reported by a small number of countries in a particular year and some substances seem to have disappeared from the market entirely. For example, the tryptamine 5-MeO-DPT |337| was reported by eight countries between 2009 and 2012, but since then there have been no further reports of its availability by countries submitting to the UNODC early warning advisory. Other substances such as the synthetic cannabinoid CP-series have shown large variations in market availability since 2009. For example, the CP-47,497 series was first reported by four countries in Europe in 2009, but in 2012 only two countries in Europe reported its presence to the advisory, whereas 10 countries reported its presence in 2013, as did six countries in 2014. Compared with other synthetic cannabinoids (e.g. aminoalky-lindoles), the synthesis of non-classical cannabinoids such as the CP-series is elaborate and complicated, which may have influenced this pattern. |338|
Enhancing efforts for an integrated response
The market for synthetic drugs is expanding and is becoming increasingly interconnected. Moreover, the synthetic drugs market has become increasingly diversified with a growing number of NPS available worldwide and an expanding market for crystalline methamphetamine in the United States and Europe. Further information and data are needed, however, to improve analysis of the relationship between NPS and substances under international control, while continuing to monitor emerging developments in the NPS market. Data on recent developments in polydrug use and injecting drug use involving NPS also remain limited. As these particular forms of drug use pose a serious challenge for treatment and health-care providers, information exchange and enhanced cooperation at the national and regional levels is crucial for establishing an effective response. Given the rapidly changing nature of the synthetic drugs market, there is a continued need for analysis of the scope and magnitude of the synthetic drugs problem based on forensic and scientific data and qualitative information.
Drug-use prevention and treatment: a change of perspective
New data remain insufficient to determine if substantial changes have occurred in the magnitude of drug use globally. Information is available only for western countries and does not reflect the situation in the highly populated regions of Asia and Africa. Yet the fact that an estimated 27 million people worldwide suffer from drug-use disorders shows that a large population is in need of health interventions, although only one in six of these people has access to treatment. A growing body of research has highlighted that drug-related health interventions can be effective and State and non-State actors now have the scientific basis for planning appropriate interventions.
Research shows the need to rethink drug-prevention strategies and shift the focus from counter-productive, ffear-arousing messages to a more positive approach recognizing that children and youth start to use drugs in the context of personal or environmental vulnerabilities that are largely out of their control. Effective drug prevention can provide children and youth with the skills and opportunities to develop safe and healthy behaviour in their families, schools and communities.
There is no cure-all remedy for problem drug use. Drug use is a multi-faceted chronic health condition that requires long-term and continued care. Likewise, there is a need to revisit how success in drug treatment is measured, as treatment effectiveness on a person's overall well-being can be evaluated only when the treatment is ongoing, not before or after treatment.
Where are increased quantities of opiates going?
The cultivation and production of opiates has been steadily increasing since 2009, reaching record levels in 2014. But existing data on seizures and opiate use do not yet reveal a big shift in the global opiate market beyond the United States, where a resurgence in the heroin market is currently under way. The apparent stabilization in traff-ficking and demand for opiates can be explained by the fact that opiates may take a few years to reach destination countries, or that changes in the demand for opiates are going undetected. For example, Africa is being increasingly targeted by traffickers as a transit hub for heroin from Afghanistan and may be developing into a non-negligible consumption market.
Afghanistan is supplying 90 per cent of Canada's heroin and may be increasingly supplying the United States. Seizures indicate that heroin from Afghanistan currently accounts for relatively few cases in the United States, but this may be changing. The reach of organized criminal networks is increasingly global and organized criminal groups are increasingly sophisticated and versatile, posing new challenges for national law enforcement agencies, whose strategies and interventions need constant revision. A prime example is the dark net, an anonymous online marketplace used for the illicit sale of a wide range of products including drugs. International cooperation and inter-agency collaboration has proved crucial in countering drug trafficking on the dark net but, as dark web technology grows and becomes increasingly accessible, and drug trafficking moves increasingly into the dark markets, such interventions may need to be rethought.
Changing the perception of cannabis
Amid the growing public debate on the advantages and disadvantages of the legalization of cannabis, and in the context of its actual legalization in some States, there is growing evidence that it is time to change the widespread perception of cannabis as an illicit drug without serious health consequences. The current cannabis market is far more complex and sophisticated than in the past and there is a far larger variety of cannabis products on the market than ever before, some of which appear to be more harmful than their predecessors. Highly potent strains of herbal cannabis, such as sinsemilla, which have high THC content (the main psychoactive ingredient) coupled with low CBD content (a cannabinoid with anti-psychotic properties), are becoming increasingly popular in some markets. Given that there is growing evidence of links between cannabis use and some forms of mental illness, these developments may lead to even greater morbidity; an issue worthy of close monitoring.
New psychoactive substances: taking a pragmatic approach to the problem
Different countries report that NPS continue to proliferate in the marketplace, in terms of both quantity and diversity, although some are of a transient nature and disappear as quickly as they materialize. However, the paucity of data on the harmffulness and prevalence of use of NPS makes it difficult to facilitate risk assessment at the international level. There is an overriding challenge requiring enhanced efforts by some countries to understand whether or not certain NPS are replacing other "traditional" drugs, either in the short or the long term, or if they are merely supplementing the range of existing drugs under international control. There is also a need to identify the most prevalent, most persistent and most dangerous of the some 500 potentially harmful NPS that require action at the international level. Little may be known about the size and nature of the increasingly diversified NPS market, but given that injecting NPS poses a particular health threat to users, this rapidly evolving and dynamic phenomenon requires an adequate response.
Time to consider prison health an integral part of public health
Drug use, including injecting drug use, takes place in the prison environment. In some countries, there is clear evidence that drug use is higher among prison populations than in the community outside. Prison is a high-risk, controlled environment where drug use is prohibited but it can occur and often does so in unsafe conditions. Prison environments are characterized by high levels of infectious diseases (in particular HIV, but also hepatitis C and tuberculosis) as well as limited access to prevention and treatment, which increases the risk of contracting blood-borne viruses. The rapid turnover of a large number of people between the prison environment and the wider communities outside prison calls for strategies that consider prison health an integral part of public health, with a corresponding level of continuity of care. Equality of care for people held in prisons is a basic right guaranteed under international law.
Premature deaths remain unacceptably high among people who inject drugs
Among all people who use drugs, PWID face some of the most negative health outcomes. In spite of the fact that effective, evidence-based interventions are available for preventing overdose deaths and for the prevention, treatment and care of PWID living with HIV, premature death is common among this group. Considering that overdose deaths are preventable, continued efforts could address this through a number of interventions. Prime among these is the administration of naloxone, which can immediately reverse the effects of opioid overdose. Making naloxone available and easily accessible, and empowering first aid workers and drug users' peers and family members with the necessary skills to administer naloxone, is a life-saving intervention. The health consequences of injecting drug use go beyond the risk of overdose and in many regions and countries PWID experience high levels of HIV infection. There is therefore an urgent need to scale up evidence-based comprehensive harm reduction services to reach the goal of ending AIDS by 2030.
CHAPTER II
ALTERNATIVE DEVELOPMENTOrigin of alternative development
As one of the three pillars of the international community's "balanced approach" towards drug control, alternative development, along with crop eradication and interdiction, has been a key supply reduction strategy for several decades. At its twentieth special session, devoted to countering the world drug problem together, the General Assembly defined alternative development as a "process to prevent and eliminate the illicit cultivation of plants containing narcotic drugs and psychotropic substances through specifically designed rural development measures in the context of sustained national growth and sustainable development efforts in countries taking action against drugs, recognizing the particular sociocultural characteristics of the target communities and groups, within the framework of a comprehensive and permanent solution to the problem of illicit drugs". |1|
While this definition is used at the international level, different definitions reflecting new strategies and approaches towards alternative development have been developed by a wide variety of implementing countries, donors and practitioners. Alternative development is a concept in constant flux, as can be seen by the amount of international conferences, expert working groups and seminars at which ways to refine the concept and approaches of alternative development have been analysed and discussed in recent years. |2| At these events, best practices and lessons learned from implementing alternative development programmes while improving current alternative development policies and approaches have been identified and shared. At the same time, such events have sought to broaden the involvement of States Members of the United Nations in discussions on alternative development, satisfying the growing interest in this issue area in recent years. The adoption by the General Assembly of resolution 68/196, on the United Nations Guiding Principles on Alternative Development, was an important step in this process. An increasing number of countries are supporting or implementing alternative development interventions, and the importance of alternative development is reconfirmed each year through resolutions adopted by the Commission on Narcotic Drugs. During the Presidency of Germany of the Group of Seven in 2015, alternative development will be among three priorities in the field of fighting organized crime and terrorism, along with combating wildlife trafficking and countering the financing of terrorism.
As mentioned above, the other mutually reinforcing elements in the "balanced approach" to a reduction in drug supply are crop eradication programmes and law enforcement measures to counter illicit cultivation, production, manufacture and trafficking. |3| Alternative development should be implemented in concert with broader drug control strategies of that nature, taking into account demographic, cultural, social and geographic considerations. But while such strategies are implemented at the national, regional or subregional levels, alternative development is predominantly aimed at small-scale farmers. Alternative development is aimed at identifying and helping to address not only the driving factors, but also the underlying root causes of the cultivation of illicit crops — lack of development, marginalization, poverty and, thus, overall human insecurity — and to do so in a sustainable way.
Alternative development continues to be relevant as long as drug crops are grown illicitly and development and security challenges that are specific to areas where drugs are cultivated remain. However, it offers no quick-fix solution to the supply side of the illicit drug economy as a stand-alone strategy. Previous evaluations of alternative development have already shown that success is very situation specific and that there are few, if any, practices that can be plugged into a template. As was noted in the Report of the International Narcotics Control Board for 2005, "there is no manual or definitive guidelines for alternative development". |4| However, with the adoption of the United Nations Guiding Principles on Alternative Development, a set of general guidelines that contain good practices for planning and implementing alternative development now exist.
Purpose of alternative development
Alternative development is sometimes described as "conventional rural development applied to a drug-producing area", "development in a drugs environment" or "development-oriented drug control". |5| This does not mean that the purpose of alternative development is limited to purely counter-narcotics objectives. National strategies may vary, but the specific purpose of alternative development in its present, broader meaning is to contribute to economic development (especially in rural areas) in order to target the underlying factors and root causes of illicit drug economies.
In contrast to development in general, the alternative development objectives of strengthening the economic and social development of the target areas are not, on the whole, an end in themselves; they are a way of approaching the objectives of reducing the supply of raw material for producing drugs and for re-establishing a legal economy in drug-producing areas. The way that the dual purpose of alternative development is approached differs from context to context. Some areas without illicit drug cultivation, but with a serious risk of developing it, may require a focus on traditional rural development. Such interventions have been included in alternative development programmes under the banner of "preventive alternative development", showing how close alternative development and traditional rural development can be. Alternative development is aimed at contributing to an enabling environment for long-term rural development without illicit cultivation. Through its holistic approach, it plays the role of catalyst in boosting development in areas with particular challenges related to the illicit drug economy (drug trafficking, violence, weak rule of law, etc.), which are areas where few international development agencies operate.
The present chapter focuses on the strategy of alternative development and its relation to illicit crop cultivation and supply reduction. It begins with a review of how the approach and terminology surrounding alternative development have evolved since the 1970s, together with the implications of these changes, and strategic elements that have contributed to the success of alternative development interventions are identified and analysed. Special attention is dedicated to reviewing the indicators used to evaluate alternative development programmes and the findings of such evaluations, including with regard to how a programme can effectively contribute to an enabling environment in which illicit cultivation disappears over time, human development prospers and general economic development benefits both the individual and the community. Lastly, it is highlighted in this chapter how the alternative development approach relates to the rule of law, how it addresses the broader economy linked to illicit markets and how it relates to the wider development agenda. It is intended that this will provide a thorough contribution to the discussion on how alternative development can be taken forward in coming years.
Emerging in the late 1980s from the more narrowly focused crop substitution initiatives of the 1970s and the integrated rural development approach of the 1980s, the concept of alternative development has been implemented around the world for over 40 years. Its evolution effectively began in Thailand in the 1960s, but it has also been implemented in the Andean region since the early 1980s, in the Lao People's Democratic Republic, Lebanon, Morocco, Myanmar and Pakistan since the early 1990s and Afghanistan since the late 1990s.
The concepts of "crop substitution", followed by "integrated rural development" and subsequently "alternative development", were promoted by the United Nations Fund for Drug Abuse Control (UNFDAC), |6| one of the predecessor organizations of the United Nations International Drug Control Programme (UNDCP) and the United Nations Office on Drugs and Crime (UNODC), |7| which further refined the concept of alternative development. Alternative development initiatives are now applied in most of the main countries of illicit opium or coca production and to a lesser extent in areas where cannabis is cultivated.
There is no universal consensus on the precise meaning of the different concepts relating to alternative development. Overlap exists, official definitions are scarce, and individual authors emphasize different elements. In the first decade of the new millennium, some alternative development projects were called "alternative livelihood" projects, |8| emphasizing the human dimension of those interventions. Others were categorized as "development-oriented drug control", |9| "rural development in drug-producing areas", |10| "regional development" |11| or "food security" |12| projects. Despite the variety of names employed, this chapter uses the term "alternative development", which is the term generally accepted among States Members of the United Nations. It is the term used in the definition presented in the introduction and in the discussion below of the broad concept, which evolved to incorporate several new elements.
Crop substitution
The concept of crop substitution can be traced back to its origin in opium poppy-producing countries of South-East Asia and, later, South-West Asia. It was mainly a reaction to the unintended consequences of forced eradication. |13|
One unintended result of forced eradication was that in some areas growers who received no assistance developed opposition to the Government and came under the greater influence of drug traffickers and insurgent groups, thus posing a potential risk to national security. |14|
Against that background, countries facing the problem of illicit opium poppy cultivation started to experiment with direct compensation schemes, that is, direct subsidies to farmers to keep them growing licit crops or encourage them to give up opium poppy cultivation. That approach largely failed as farmers migrated and started cultivating opium poppy elsewhere. |15| Governments also started implementing crop substitution programmes. For example, Thailand started to adopt this approach in the late 1960s, introducing alternative crops and allowing for transition periods of six to eight years before undertaking eradication. |16| The first crop substitution programme involving the United Nations started in Thailand in 1971, in line with the country's National Socioeconomic Development Plan, which was later followed by similar projects in Bolivia (Plurinational State of), the Lao People's Democratic Republic, Myanmar and Pakistan. In the 1980s, Colombia and Peru introduced compensation schemes.
The initial methodology promoted crops that would generate a level of income for the farmer that was similar to that earned from illicit crops, but that initial focus was very restrictive. The target areas were primarily traditional growing areas where subsistence economies prevailed. No provisions were made to link the production chain with value-added activities and markets. As new illicit crop production areas emerged, several of the underlying hypotheses were not valid or were only partially valid. Moreover, the initial successes of the narrow "crop substitution" approach often turned out to be of limited duration. |17| It also became clear that without additional assistance to farmers to increase their participation in the value-added chain, alternative products were, in most cases, not competitive enough to create sustainable alternative livelihoods.
Integrated rural development
The initial approach was broadened in Asia in the 1980s, taking the form of the concept of "integrated rural development". At the international level, UNFDAC could be considered a pioneer in steering the concept of an "integrated approach". Recognizing the need for a comprehensive and balanced approach, in the late 1980s, UNFDAC was the first agency to make use of the concept of master plans for drug-producing countries. |18| By that time, countries were able to benefit from the lessons already learned to address some of the limitations of crop substitution. For example, in Colombia, the first interventions in the southern part of the Department of Cauca (1985) and the northern part of the Department of Narino (1989) sought to incorporate a dual focus on crop substitution and integrated rural development. |19| The early interventions in Peru, from 1985 onward, were not limited to crop substitution either, as the Andean countries, with support from UNDCP, were able to benefit from lessons learned in other countries. The Plurinational State of Bolivia gradually shifted from a crop substitution approach to a broader, integrated rural development approach from 1983 onward, complementing interventions focusing on the quality of life and investments in social and road infrastructure. |20|
In the integrated rural development approach, there was a need to enable farmers in areas of illicit crop production to effectively compete, with their licit products, with well-established networks for production, distribution and marketing. Thus, economic and technical provisions had to be made to ensure the marketing, storage and transport of new products. The new concept of integrated rural development also sought to improve the overall quality of life of the target population by addressing not only income but also education, health, infrastructure and social services. |21|
That concept also sought to redress the narrow emphasis on crop substitution and instead promote the overall integration of traditional areas of cultivation into the economic and social mainstream. It combined relatively heavy infrastructure investment, such as road construction, to overcome the inaccessibility of certain areas, with a wide range of other inputs aimed at opening up remote and underdeveloped areas of traditional cultivation. |22| In doing so, it consolidated crop substitution by combining it with a number of other initiatives, such as food-for-work schemes; various other new income-generating opportunities; social development initiatives aimed at improving education, health, access to potable water and sanitation; and infrastructural projects to improve access to markets. |23| An interesting example is the Thai-German Highland Development Programme implemented between 1981 and 1998, which is widely considered a success. |24|
Alternative development
At the local level, integrated rural development proved successful to an extent, not only in Asia but also in several coca-producing areas of the Andean countries. However, from a broader perspective, it could be observed in the late 1980s that illicit drug crop production was being relocated from areas typically affected by illicit cultivation to many new areas of cultivation, prompting a further reappraisal and refinement of the approach taken. It became clear that any narrow, microeconomic approach would be insufficient. |25| Instead, a broader rural development approach was required to address the factors driving cultivation in illicit drug economies, the lack of marketing infrastructure, public services and agricultural know-how, and the relative profitability of illicit crops compared with licit crops in these circumstances.
This resulted in an even broader strategy of "alternative development", developed at the international level by UNFDAC in the second half of the 1980s, which sought to improve the integration of regional development assistance with law enforcement initiatives, |26| while promoting the appropriate coordination and sequencing of those interventions. Flexible law enforcement in countering illicit cultivation — with law enforcement interventions being carefully timed in order to be supportive of the development effort, and undertaken once the basic conditions for acceptable alternative living standards had been achieved — was considered to be an integral and fundamental part of alternative development. Alternative development interventions sought to have a more sustainable impact by creating local organizations and farmers' associations to facilitate the production, distribution and marketing of products.
The alternative development approach also emphasized the need to integrate local alternative development activities into regional and national development efforts, in recognition of the fact that drug crop cultivation was intertwined with various development, security and governance-related issues that went well beyond the microeconomics and agronomy of coca, opium poppy and cannabis cultivation. |27| Against that background, a number of initiatives were developed in the attempt to integrate drug control, including alternative development, into broader national development plans, revive and expand the legal sectors of the economy and provide a framework for sound economic policies to generate demand for diversified economic growth and job creation.
Some alternative development programmes, in Thailand for example, had already successfully implemented such broader approaches from the 1970s onward under royally initiated projects and other programmes. In Colombia, a broader alternative development approach was initiated in 1990 in the departments of Guaviare, Caqueta and Putumayo under the auspices of UNDCP. |28| In Peru, the adoption of the alternative development approach started in 1995, building on the 10 years of lessons learned since the first crop substitution projects in 1985. |29| By the early 1990s, the Plurinational State of Bolivia had developed alternative development projects, based on lessons learned in the Chapare Region. |30|
Alternative livelihoods
In the first decade of the new millennium, alternative development projects were sometimes also called "alternative livelihood" projects in an attempt to change the focus and emphasize the human dimension in the alternative development process. This concept became particularly popular in Afghanistan after the end of the Taliban regime (2001-2002) and was officially adopted in the 2006 Afghan National Drug Control Strategy. The aim of the alternative livelihood approach, as stated in the Strategy, was to strengthen and diversify alternative livelihoods that freed farmers and other rural workers from dependence on opium poppy cultivation and encourage the growth of the licit economy. |31| In 2012, the National Alternative Livelihood Policy, developed by the Ministry of Counter Narcotics in collaboration with UNODC, was endorsed by the Government of Afghanistan and the international community. In other places, such as in the Andean region, the term "alternative livelihood" has not been widely adopted and "alternative development" is the name most commonly used to describe the approach taken, but that does not mean that the philosophy indicated by the term "alternative livelihoods" has never been introduced in Latin America.
Although very similar to "alternative development", the concept of "alternative livelihoods" could be considered to put special emphasis on identifying the motivations and factors influencing household decisions before designing interventions. Broad-based rural development is necessary, but it does not in itself sufficiently address the specific drivers of opium poppy cultivation. |32| While income generation is important, the alternative livelihood approach also looks at other "livelihood assets" such as health and education, access to land and water, livestock and forest resources, access to credit, tools, equipment, infrastructure and community support. Like alternative development, as that approach has been used in the past decade, the alternative livelihoods approach stresses integrating local development efforts and counter-narcotics objectives into broader national development strategies and programmes in an attempt to better respond to the underlying causes of drug-crop cultivation and to create links with the wider State-building agenda.
A concept in flux
In practice, the distinction between the alternative development and the alternative livelihoods approach is not always clear-cut. Several of the new ideas found in the alternative livelihoods approach have found their way into projects that continue to be called "alternative development". At the same time, many of the interventions officially labelled as "alternative livelihood" interventions have, in practice, had approaches similar to alternative development interventions, |33| as they consisted of single-sector development initiatives. The 2006 Afghan National Drug Control Strategy made a specific reference to alternative livelihoods as the main approach to addressing illicit cultivation. |34| Meanwhile, other strategies, such as the approaches adopted by the European Union, Colombia and Peru, continue to use the concept of alternative development to address underlying drivers of illicit cultivation (for example, marginalization and poverty) in a way that is very similar to the alternative livelihoods approach. |35| This confirms that in practice the distinction between the two concepts is increasingly blurred.
Geographical location of alternative development
MAP 4. Member States implementing domestic alternative development projects (as reported to the United Nations Office on Drugs and Crime), 2010-2013
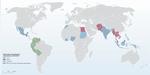
Click to enlargeSources: UNODC annual report questionnaire and UNODC alternative development projects. Only countries providing sufficient information on the implementation of alternative development projects are included.
Note: The boundaries shown on this map do not imply official endorsement or acceptance by the United Nations. Dashed lines represent undetermined boundaries. The dotted line represents approximately the Line of Control in Jammu and Kashmir agreed upon by India and Pakistan. The final status of Jammu and Kashmir has not yet been agreed upon by the parties. The final boundary between the Sudan and South Sudan has not yet been determined.A total of 23 countries reported to UNODC that they had implemented alternative development programmes during the period 2010-2013. |36| Those countries include all of the main coca-producing countries (Bolivia (Plurinational State of), Colombia and Peru), the two main opium-producing countries (Afghanistan and Myanmar) and a number of other countries with illicit opium production (including Egypt, the Lao People's Democratic Republic, Pakistan, Thailand and Viet Nam). Alternative development initiatives were also implemented in some of the cannabis-producing countries (notably Morocco and, to a lesser extent, Indonesia and the Philippines).
That number also included other countries in South America (Ecuador and Venezuela (Bolivarian Republic of), which reported mostly "preventive alternative development"), in Central America (El Salvador and Guatemala), the Caribbean (Trinidad and Tobago), Asia (Malaysia) and a few countries in Africa. In addition, Albania, Côte d'Ivoire, India, Mexico and Nigeria have plans to implement alternative development activities. Map 1 shows the countries that implemented domestic projects during the period 2010-2013.
Resources allocated to alternative development
Beneficiaries of alternative development
There are numerous challenges in identifying the budgets allocated to alternative development interventions and in calculating the number of their beneficiaries. A further problem, in comparing data at the international level, is that the definition of alternative development differs from country to country. Moreover, in a number of cases, alternative development projects form part of broader rural development programmes and/or are implemented by various national and international organizations. As a result, it is often the case that data of this nature are not collected in a comprehensive manner at the national level. Although alternative development programmes today are increasingly supported by national strategies and national budgets, data that quantify the magnitude of alternative development interventions are scarce.
Table 1 reflects the limited information available on national budgets allocated to alternative development in 2013 and on beneficiaries. Intended beneficiaries of alternative development received, on average, direct and mainly indirect in-kind benefits of an annual value of a few hundred dollars for each family cultivating illicit crops. The percentage of national budgets allocated to alternative development, in the main coca-producing countries, ranged from the equivalent of 5 per cent to almost 30 per cent of the income derived from illicit cultivation.
TABLE 9. Beneficiaries of alternative development programmes, estimated number of households that illicitly cultivate drug crops, farmers' income from illicit crops, and national alternative development budgets, 2013 (unless otherwise indicated)
Country Estimated number of households involved in illicit cultivationa Farmers' total income from cultivation of coca or opium (millions of dollars) Beneficiaries of alternative development (number of households)� Domestic budget for alternative development (millions of dollars) Domestic alternative development, as percentage of illicit crop income A. Asia (illicit opium production) Afghanistan b 950 - - - Myanmar - 540 - - - Lao People's Democratic Republic - 42 - - - B. Latin America (illicit coca production) Peru 121,000 (2013) 496 72,000 (2013) 48 10 Colombia 61,700 (2013) 313 156,000c (2003-2013) 92 29 Bolivia (Plurinational State of) - 313 60,000d (2009-2014) 14 5 Sources: UNODC, Afghanistan Opium Survey 2013 (Vienna, December 2013); UNODC, Southeast Asia Opium Survey 2013; UNODC, Perú Monitoreo de Cultivos de Coca 2013, June 2014; UNODC, Colombia Coca Cultivation Survey 2013 (June 2014); UNODC, Estado Plurinacional de Bolivia Monitoreo de Cultivos de Coca 2013 (June 2014).
� Showing year of estimate in parenthesis.
b No data were available for 2013; latest available data were for 2010 (248,700 households); between 2010 and 2013 the areas under opium cultivation increased, however, by 70 per cent and by more than 80 per cent by 2014.
c This total includes beneficiaries of preventive alternative development (households not directly involved in coca cultivation) during the period 2003-2012.
d As reported by the Vice-Ministry of Coca and Integral Development; in the light of the number of households that live in coca-producing regions, this figure suggests that practically all farmers living in areas of coca cultivation benefited from alternative development interventions.
General overview of donor contributions to alternative development
MAP 5. International assistance to alternative development, 1998-2013: average annual commitments made by donor countries for alternative development, and the main recipient countries
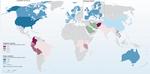
Click to enlargeSources: OECD Creditor Reporting System Aid Activities database and UNODC annual report questionnaires. The map indicates only those countries receiving assistance valued at more than $100,000 per annum.
* In addition to individual EU Member States, the European Union is also a major donor of alternative development assistance.
Note: The boundaries shown on this map do not imply official endorsement or acceptance by the United Nations. Dashed lines represent undetermined boundaries. The dotted line represents approximately the Line of Control in Jammu and Kashmir agreed upon by India and Pakistan. The final status of Jammu and Kashmir has not yet been agreed upon by the parties. The final boundary between the Sudan and South Sudan has not yet been determined. A dispute exists between the Governments of Argentina and the United Kingdom of Great Britain and Northern Ireland concerning sovereignty over the Falkland Islands (Malvinas).Over the past four decades, alternative development has largely been funded by external donors, including countries of the Organization for Economic Cooperation and Development (OECD) in North America, Europe and Oceania, and non-OECD countries such as China, Iran (Islamic Republic of), Saudi Arabia and Thailand (see map 2). In recent years, there has been a trend towards more project funding by countries that were traditionally recipients of such assistance, such as Bolivia (Plurinational State of), Colombia, Peru and Thailand.
Magnitude of funds allocated to alternative development by donors
The level of funds allocated by donors to alternative development can be considered an indication of the importance that the international community has attached to this strategy.
FIG. 77. Trends in global commitments to providing development assistance and alternative development made by donor countries of the Organization for Economic Cooperation and Development, 1998-2013

Click to enlargeSource: OECD, International Development Statistics online database (data extracted on 19 December 2014).
Most available financial data on alternative development are currently provided by OECD donor countries. However, those data only partially reflect the overall efforts undertaken in this area as there are additional donors from among non-OECD countries, and national efforts made by the recipient countries are not included in those statistics. That latter factor does not create much of a problem in the analysis of alternative development activities in lowincome countries, but in middle-income countries the discrepancies between donor-funded and overall alternative development activities can be substantial.
According to the OECD International Development Statistics, |37| in the period from 1998, when the Political Declaration and its associated Action Plan on International Cooperation on the Eradication of Illicit Drug Crops and on Alternative Development were adopted by the General Assembly, to 2013, global commitments by OECD countries for providing alternative development in developing countries amounted in total to, on average, $219 million per year (as expressed in 2012 dollars), of which 89 per cent was for agriculture-related alternative development and 11 per cent was for non-agriculture-related alternative development activities such as income opportunities in other sectors, social and physical infrastructure and non-agricultural training and capacity-building. The statistics cited above do not include alternative development projects funded by non-OECD countries, such as China, Thailand and some of the Gulf countries.
Despite decades of discussion about alternative development being a key pillar of drug control at the national and international levels, the overall amounts committed by OECD countries for alternative development in the period 1998-2013 were very low in comparison to the amounts committed as part of general development cooperation. Alternative development commitments accounted for just 0.2 per cent of overall global development assistance ($133 billion per year), or 3.6 per cent of assistance directed towards agriculture, and they were the equivalent of 12.3 per cent of the amount committed to rural development.
The funds actually spent were of a magnitude similar to the commitments. Data in that regard, however, were available for a more limited time frame, with $245 million per year having been spent by OECD donors over the period 2002-2013, equivalent to 0.2 per cent of all disbursements related to development assistance.
Data on donor commitments show that the agreement reached by countries in the Political Declaration adopted by the General Assembly at its twentieth special session and the Action Plan on International Cooperation on the Eradication of Illicit Drug Crops and on Alternative Development had a tangible impact in promoting the allocation of donor resources for alternative development. Global alternative development commitments made by the OECD countries rose more than five-fold between 1998 and 2008. However, the subsequent Political Declaration and Plan of Action on International Cooperation towards an Integrated and Balanced Strategy to Counter the World Drug Problem, adopted by the General Assembly in 2009, was not followed by a similar increase: financial commitments fell by 51 per cent between 2009 and 2013 (see figure 1). That decline cannot be attributed to any general decline in resources made available by OECD donors because overall OECD donor commitments continued to increase during that period. As a consequence, the proportion of overall development assistance that was alternative development assistance, which had increased from 0.1 per cent in 1998 to 0.3 per cent in 2008, fell back to 0.1 per cent of overall development assistance by 2013.
FIG. 78. Trends in gross disbursements of alternative development provided by donor countries of the Organization for Economic Cooperation and Development, 2002-2013
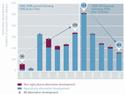
Click to enlargeSource: OECD, International Development Statistics online database (data extracted on 19 December 2014).
Data on actual disbursement of funds show a trend similar to that on commitments (see figure 2). Two possible explanations for that trend are: (a) that the initial momentum created for alternative development in 1998 was not maintained after 2009; and (b) that alternative development assistance was — as actually requested in the 2009 Political Declaration — partly mainstreamed and integrated into broader regional development plans and thus some interventions might no longer have been categorized as "alternative development". Annual commitments designated for the category of "rural development" in the period 2009-2013 were 50 per cent greater than in the period 1998-2008. That increase may have compensated for the decrease in the resources allocated to the category of "alternative development" between 2009 and 2013.
A decrease in assistance from external donors does not necessarily result in a decrease in a country's overall financial resources for alternative development. For example, Bolivia (Plurinational State of), Colombia and Peru substantially increased their allocation of national resources to alternative development and, through that increased domestic funding, countered the decline in donor resources, thus maintaining sustained financial support for alternative development on their own territory.
Average annual development assistance reported by OECD donor countries, as related to "narcotics control" |38| (excluding alternative development), was far lower in the period 2009-2013 than the period 1998-2008 (89 per cent lower) (see figure 3), mainly reflecting a downward trend that began in 2007.
Principal alternative development donors
FIG. 79. Trends in global commitments by donor countries of the Organization for Economic Cooperation and Development to providing funds for rural development, alternative development and narcotics control, 1998-2008 and 2009-2013

Click to enlargeSource: OECD, International Development Statistics online database (data extracted on 19 December 2014).
Identifying the principal donors of alternative development assistance is challenging, as statistics may be affected by the different categories that countries use for their allocation funds. Statistics in this regard should therefore be used only to identify the largest donors in this area, rather than be taken as an exact measurement.
According to OECD international aid statistics (its Creditor Reporting System), of the 28 countries belonging to the OECD Development Assistance Committee, |39| 19 countries provided "agricultural alternative development" over the period 1998-2013, totalling, on average, $195 million per year for the OECD donors, compared with the assistance provided by 14 OECD countries over the period 1998-2008 totalling $176 million per year. The major donors appear to have been the United States, followed by European Union institutions, Canada and some individual European countries, notably the Netherlands and Germany. A similar picture emerges with respect to funds actually disbursed.
The amounts spent on assistance designated as "non-agricultural" |40| alternative development over the period 1998-2013 amounted to $23.2 million per year, which was significantly less than the amounts spent on "agricultural alternative development". The annual amounts spent on "non-agricultural alternative development" over the 2009-2013 period were almost 40 per cent lower than over the 1998-2008 period. The major contributors were the United Kingdom of Great Britain and Northern Ireland and the United States, followed by European Union institutions, Finland and Australia.
Main recipients of agricultural alternative development funds
FIG. 80. Agricultural alternative development assistance committed by donor countries of the Organization for Economic Cooperation and Development, by recipient country, annual average in the combined period 1998-2013
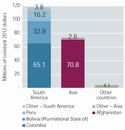
Click to enlargeSource: OECD, International Development Statistics online database (data extracted on 19 December 2014).
Based on OECD development aid statistics on funds committed to agricultural alternative development assistance over the period 1998-2013, the largest shares of donor assistance, as shown in figure 4, were committed to countries in South America (118 million constant 2012 dollars or 60.4 per cent of the total), notably Colombia (33.3 per cent), Peru (16.8 per cent) and the Plurinational State of Bolivia (8.3 per cent), followed by countries in Asia (37.6 per cent), most notably Afghanistan (36.2 per cent). Statistics on disbursements (i.e. funds actually spent) show a similar pattern. Far smaller amounts were received by the Lao People's Democratic Republic, Myanmar and Thailand. While the Lao People's Democratic Republic and Myanmar are largely dependent on foreign assistance, Thailand has been able to finance the bulk of its requirements for alternative development from local resources, and some of its alternative development projects have even become economically self-sufficient.
Comparing the period 2009-2013 (following the 2009 Political Declaration and Plan of Action) to the period 1998-2008 (following the twentieth special session of the General Assembly), funds committed by international donors to agricultural alternative development increased in Afghanistan (from $64 million per year in the period 1998-2008 to $85 million per year in the period 2009-2013) and in Colombia (from $52 million to $94 million), while they decreased in Peru (from $35 million to $28 million) and the Plurinational State of Bolivia (from $17 million to $14 million).
Gross disbursements for agricultural alternative development decreased by two thirds between 2009 and 2013 in the four main recipient countries (see table 2), with the strongest decline in the Plurinational State of Bolivia (98 per cent). In some countries, the resources allocated to alternative development projects did not decrease, however, as additional domestic funds (particularly in the Andean region) compensated for some of the decline in funds from external donors.
TABLE 10. Gross disbursements for agricultural alternative development assistance by donor countries of the Organization for Economic Cooperation and Development, 2009-2013, and of alternative development assistance by national authorities in 2013
Agricultural alternative development disbursement from external sources
(millions of constant 2012 dollars)Alternative development reported by national authorities (2013)
(millions of constant 2012 dollars)2009 2010 2011 2012 2013 Average 1999-2013 Percentage of total Afghanistan 266.4 161.2 104.6 86.8 43.1 132.4 46.8 - Colombia 118.2 73.1 51.1 58.0 77.8 75.7 26.7 92 Peru 28.1 29.6 28.6 27.8 25.6 27.9 9.9 48 Bolivia (Plurinational State of) 37.8 36.7 21.3 8.3 0.6 21.0 7.4 14 Subtotal 450.6 300.6 205.7 180.9 147.0 257.0 90.8 Other developing countries 55.4 21.7 27.7 17.9 7.9 26.1 9.2 All developing countries 506.0 322.3 233.4 198.7 155.0 283.1 100.0 Sources: OECD, International Development Statistics online database (data extracted on 19 December 2014); UNODC, annual reports questionnaire; Colombia, Ministry of Justice and Law, Division for Programmes to Combat Illicit Cultivation, Administrative Unit for Territorial Consolidation, October 2014.
TABLE 11. Gross disbursements for agricultural alternative development assistance made by Organization for Economic Cooperation and Development donor countries, expressed as a proportion of gross domestic product, period 2009-2013, and alternative development from domestic sources, expressed as a proportion of gross domestic product, 2013
Agricultural alternative development assistance Alternative development assistance From external sources (percentage of recipients' gross domestic product) From domestic sources (percentage of recipients' gross domestic product) 2009 2010 2011 2012 2013 Average 1999-2013 2013 Afghanistan 2.10 1.17 0.72 0.52 0.25 0.88 - Colombia 0.05 0.03 0.02 0.02 0.03 0.03 0.03 Peru 0.02 0.02 0.02 0.02 0.02 0.02 0.08 Bolivia (Plurinational State of) 0.25 0.23 0.13 0.05 0.00 0.12 0.08 Subtotal 0.12 0.07 0.05 0.04 0.03 0.06 - Other developing countries 0.0004 0.0002 0.0002 0.0001 0 0.0002 - All developing countries 0.004 0.002 0.002 0.001 0.001 0.002 - Sources: OECD, International Development Statistics online database (data extracted on 19 December 2014) and World Bank, World Development Indicators (data extracted on 30 December 2014) and reports by national authorities to UNODC.
Putting donor assistance into perspective
Amounts received from external sources and allocated for alternative development purposes have so far been rather modest when compared with the gross domestic product (GDP) of recipient countries and overall alternative development assistance provided by the domestic authorities in drug-producing countries. Expressed as a proportion of overall economic activity, gross donor disbursements of agricultural alternative development funds amounted, on average, to just 0.06 per cent of GDP in the four main recipient countries over the period 2009-2013, with the largest proportion reported in Afghanistan (0.9 per cent of GDP). Moreover, the proportion in all four main recipient countries declined from an average of slightly more than 0.1 per cent of GDP in 2009 to 0.03 per cent in 2013 (see table 3).
Expressed as a proportion of overall development assistance, "agricultural alternative development" accounted for an average of 3 per cent of all development assistance in the four main coca-producing and opium-producing countries in the period 2009-2013 (see table 4).
TABLE 12. Gross disbursements for agricultural alternative development assistance provided by donor countries of the Organization for Economic Cooperation and Development as a proportion of total development assistance, 2009-2013, as a percentage of total development assistance
Gross disbursements (percentage of total development assistance of recipient country) 2009 2010 2011 2012 2013 Average 2009-2013 Afghanistan 4.6 2.4 1.6 1.3 0.8 2.1 Colombia 11.8 7.4 4.9 7.2 8.9 8.0 Peru 4.1 3.7 3.6 4.9 4.8 4.1 Bolivia (Plurinational State of) 5.2 4.1 3.0 1.2 0.1 2.8 Subtotal 5.5 3.2 2.3 2.1 2.0 3.0 Other countries 0.04 0.02 0.02 0.01 0.00 0.02 Total 0.4 0.2 0.2 0.1 0.1 0.2 Source: OECD, International Development Statistics online database (data extracted on 19 December 2014).
Gross disbursement of alternative development funds in the six main opium-producing and coca-producing countries amounted to close to $150 million in 2013. This was equivalent to 6 per cent of farmers' total income from opium and coca production ($2.6 billion) in those six countries in 2013 (varying from 0.1 per cent in Myanmar to 25 per cent in Colombia). In some cases, assistance provided to the beneficiaries of alternative development interventions was sufficient to make a difference, although the data also indicate that when the value of interventions lay below certain thresholds, they had insufficient impact.
C. ANALYSIS OF NATIONAL ALTERNATIVE DEVELOPMENT STRATEGIES
National alternative development strategies
The review of national alternative development strategies shows that the evolution of alternative development at the country level is dynamic and versatile. Yet not all countries that implement or support alternative development have separate, stand-alone alternative development strategies or action plans. Most countries, in fact, make alternative development one of the pillars of a broader drug control strategy. Based on country-specific information provided to UNODC through the annual report questionnaires for the period 2010-2013, and other communications, table 5 shows, by category, countries that support, plan to support or implement alternative development projects in one way or another. Summary tables of national strategies can be found in the annex of the online version of this report.
When it comes to national strategies, almost all countries state that the impact of programmes is assessed in terms of the eradication of extreme poverty, gender equality and women's empowerment, and environmental sustainability (as reported in the annual report questionnaires, 2010-2013). All national strategies — characterized by cross-ministerial engagement — are embedded in or linked to broader national development strategies, albeit in different ways. For example, in Afghanistan, the strategy is linked to the National Development Strategy, but it falls under the counter-narcotics strategy. In Colombia, the strategy for alternative development is embedded in the National Policy of Territorial Consolidation and Reconstruction, implemented by the Administrative Unit for Territorial Consolidation. Colombia's current national strategy has a cross-cutting focus combining supply reduction (reduction of illicit crops), alternative development and environmental management. |41| This allows for the incorporation of new policy elements — and therefore more government institutions join the efforts to reduce illicit cultivation — in the search for an increasingly integral drug control policy. |42|
In Ecuador, alternative development is embedded within the national strategy of equality and solidarity. In the Lao People's Democratic Republic, the drug control strategy is closely related to the overarching objective of poverty reduction. In Morocco, where alternative development falls under national drug control strategy, I'Initiative Nationale de Développement Humain contributes to the improvement of development indicators in the areas concerned. In the Plurinational State of Bolivia, the strategy for alternative development is embedded within the broader rural development plans, but with the specific objective of limiting coca cultivation to designated areas for the legal use of coca leaves. In Germany, the support strategy for alternative development is completely embedded within a broad strategy of social economic development in rural areas.
TABLE 13. Countries involved in alternative development, 2010-2013�
Countries with alternative development programmes or projects on their soil Afghanistan, Bolivia (Plurinational State of), Colombia, Indonesia, Lao People's Democratic Republic, Myanmar, Morocco, Peru, Philippines and Thailand Countries with a strategy or national plan to support ; alternative development abroadb Bolivia (Plurinational State of), Canada, China, Denmark, Ecuador, Finland, Germany, Iran (Islamic Republic of), Italy, Japan, Lithuania, Netherlands,c New Zealand, Peru,d Saudi Arabia, Thailand, United Kingdom and United States Countries that implement or support preventive alternative development Afghanistan, Canada, China, Colombia, Denmark, Ecuador, Finland, France, Italy, Indonesia, Japan, Morocco, Peru, Thailand, Trinidad and Tobago, Tunisia, United Kingdom, United States, Uruguay, Venezuela (Bolivarian Republic of) and Viet Nam Countries with a stand-alone national alternative development strategy Bolivia (Plurinational State of), China, Ecuador, Germany, Guatemala, Indonesia, Morocco, Pakistan, Peru, Philippines and Thailand Countries with an alternative development strategy within a broader national economic development plan Colombia, Mexico, Myanmar, Trinidad and Tobago and Viet Nam Countries planning to implement or support alternative development interventions Albania, Côte d'Ivoire, Guatemala, India, Mexico, Nigeria and Russian Federation � Only countries that provided some details about their alternative development strategy, programme, plan or activities have been included.
b Canada, Denmark, Finland, Iran (Islamic Republic of), Lithuania and the United Kingdom all report that at least part of this support is to address illicit opium poppy cultivation in Afghanistan.
c The Netherlands has no specific alternative development strategy but contributes to various projects that are part of wider economic development programmes to improve security and stability in regions with illicit cultivation.
d Peru supports countries abroad through the regional framework of the Andean Community.
In line with the Millennium Development Goals, all country strategies address food security and quality of life in terms of broader socioeconomic indicators. They all focus in one way or another on establishing farmers' organizations and include local communities in the design, planning, implementation and evaluation of programmes and often have a specific focus on ethnic minorities or indigenous peoples.
On a broader level, all national strategies or plans reviewed in this section clearly have a balanced approach, complementing alternative development with other supply reduction strategies (particularly law enforcement and interdiction), but also with drug demand reduction strategies (prevention, treatment and rehabilitation). Other commonly integrated strategies — sometimes as a cross-cutting theme or as a separate policy — are promoting good governance and strengthening State institutions or the rule of law, as found in the strategies of 12 countries.
The objectives of national strategies are in line with international documents. They sometimes relate to crop substitution or other agricultural production-related elements such as marketing (found in at least seven countries), or to policies for crop eradication and prevention and addressing the drivers of illicit cultivation (in nine countries). Some strategies also introduce new approaches and link alternative development to quality of life, human rights, the rule of law or environmental protection (seven countries).
Overall, national strategies are in line with the definition of alternative development found in the Action Plan on International Cooperation on the Eradication of Illicit Drug Crops and on Alternative Development, adopted at the twentieth special session of the General Assembly. However, countries set very different priorities and use very different approaches, both within and beyond their drug control components. This leads to the development of very different projects and interventions that are tailored to existing and new challenges that require multidimensional, multifaceted responses.
The wide range of national strategies and the variety of ways they are implemented on the ground confirm that the evolution of alternative development is driven at the country level or even the local level. At the international level, a process of connecting "local to global" is currently taking place, in which best practices and lessons learned from local experiences within national strategies — which will probably continue to be very different in years to come — are exchanged. That process reinforces efforts by UNODC, the Commission on Narcotic Drugs and other entities to foster more South-South cooperation, as also recommended in the United Nations Guiding Principles on Alternative Development. |43|
PREVENTIVE ALTERNATIVE DEVELOPMENT IN ECUADOR In Ecuador, preventive alternative development consists of measures to enhance the inclusion of the local community in productive, socioeconomic and environmental protection projects, so as to reduce the vulnerabilities that lead to their involvement in illicit activities. At present, Ecuador has preventive alternative development projects in six regions. For example, in Engunga, in the Province of Santa Elena, preventive alternative development is focusing on reactivating the cultivation of shrimp on six shrimp farms (covering 29 ha). The income generated for 840 families has also made it possible to invest in three microprojects — a community shop, a recreational centre and a pharmacy — while investing in tourism (tours using small boats). The next steps are to scale up the shrimp farms, create a brand (and certification of the status of "preventive alternative development") and enter the national and international markets for frozen shrimp.
Another project consists of establishing a cacao-processing plant in the area of 18 de Noviembre in the Province of Sucumbfos. The first step was the creation of a farmers' association of 100 founding members and the placing of 1 ha of land in the name of the association to build the plant, which is currently at the financing stage. A collection centre will also be created so that the processed cacao can be sold directly to private companies without going through intermediaries in the marketing chain. It is expected that 1,800 families will benefit from the plant, and that the cacao, which is certified as a product of "preventive alternative development", will reach both national and international markets.
In 2012, Ecuador made a presentation to the Commission on Narcotic Drugs on the concept of introducing a global stamp for products of alternative development, which would strengthen international marketing opportunities for alternative development products bearing the stamp. Products marketed under the global stamp could benefit from special marketing regimes, similar to those for Fairtrade and organic products, stressing the product's origin and its links with strategies for addressing illicit cultivation and/or environmental protection.
Preventive alternative development
Some countries have a particular focus on preventive alternative development. However, the policy of Ecuador focusing on rural development is, for example, very different from the preventive policies of Trinidad and Tobago targeting urban youth within the prevention strategy linked to drug trafficking and other crimes. Elsewhere, the link between alternative development and drug trafficking in Indonesia is interesting as it moves the alternative development strategy away from the general focus on farmers in rural areas. Another example of an alternative development intervention that does not target farmers who cultivate coca, but rather adopts preventive alternative development strategies, is the assistance given to communities in the Cienaga Grande of Santa Marta in Colombia. Largely dependent on fishing and fish farming |44| and located on strategic routes for trafficking Colombian cocaine to the Caribbean Sea, these communities have been the victims of conflict between paramilitary and guerrilla forces, and members of the communities have been recruited, sometimes by force, by drug traffickers and/or illegal armed groups. The aim of preventive alternative development interventions is to prevent such situations, in addition to boosting socioeconomic development.
D. CHALLENGING CONTEXT OF ALTERNATIVE DEVELOPMENT
Expectations about the impact of alternative development programmes should take into account the limitations of such programmes, which are characterized by relatively modest funding and a limited scope and which face challenges that general rural development programmes normally do not. One such challenge is the nature of the locations where alternative development programmes are implemented: marginalized, isolated areas with limited government control, unclear land rights and lack of infrastructure. Another is the poor conditions of beneficiaries (conditions of poverty and marginalized communities with low socioeconomic indicators, whose members sometimes live in fear of violence, along with other tensions) and the lack of understanding or trust between beneficiaries and other involved parties, such as governmental agencies. These conditions are very relevant as they would generally disqualify such areas as targets for traditional rural development initiatives.
Marginalization and poverty
Alternative development programmes often involve beneficiaries that are marginalized — socially, economically or geographically — from the main societal groups and suffer from poor socioeconomic conditions. This may involve a "marginalized zone within a marginalized region", such as the municipality of La Asunta in Los Yungas de la Paz, in the Plurinational State of Bolivia, which is poor, difficult to access and highly dependent on coca cultivation. |45| It may also involve marginal ethnic groups in isolated areas, such as the Hmong, Karen, Akha and Lisu ethnic groups in the Highlands of Thailand, a country in which alternative development has been accompanied by a State policy of integrating such ethnic groups into society through development and better access to education, health care and other necessary infrastructure. |46| Similarly, in Colombia, the Kogui, Arhuaco, Kankuamo and Wiwa indigenous communities, among others, are or have been beneficiaries of alternative development. In addition, many beneficiaries of alternative development programmes are migrants or the descendants of migrants. Thus, problems associated with migration need to be considered when programmes are implemented. For example, a survey conducted in the coca-producing valleys of Peru in 2013 found that only 38.4 per cent of the heads of beneficiary households were born in the region, while 61.6 per cent of beneficiaries were from other regions. |47|
MYANMAR: REDUCING THE IMPORTANCE OF OPIUM AS A SOURCE OF INCOME BY BALANCING SHORT-TERM FOOD SECURITY NEEDS WITH LONG-TERM SUSTAINABILITY In Myanmar, the average area of poppy cultivation per opium poppy-growing household more than doubled, from 0.17 ha in the period 2002-2003 to 0.43 ha in 2013, which implies an increased dependency on opium
cultivation. Socioeconomic village surveys conducted in connection with the annual opium poppy survey show that significantly higher proportions of households are in debt and are exposed to food insecurity in opium poppy-growing villages than in non-poppy-growing villages. Opium cultivation provides a means of earning cash income to purchase food in months when a household's food resources have been depleted. Moreover, wages earned from labour related to opium poppy cultivation are an important source of additional income for many households. That fact should be taken into account when designing alternative development projects, because a reduction in opium poppy cultivation not only results in a loss of income from opium production but also removes an opportunity to generate income from wage labour.�
While previous interventions mainly addressed food insecurity, the recently developed UNODC alternative development project in South Shan, Myanmar,b has shifted the focus to a longer-term sustainable approach that balances the cultivation of permanent crops in agroforestry systems with the production of high-value food crops and reforestation activities to ensure environmental sustainability. Lessons learned and successful experiences from other parts of the world, in particular Peru and Thailand, were instrumental in defining this new approach.
The strategy will include a land registration and titling process to assure the long-term investment of farmers in the project. To improve and assure food security for beneficiary farmers, permanent crop systems will be implemented, together with short-term food crops. Productive activities will be oriented towards high-quality products so as to reach premium markets, and farmer enterprises will be set up so that farmers can assume future processing and commercializing activities themselves. The project will be carried out in former or ongoing conflict areas, and the planned alternative development work is also intended to contribute to a peacebuilding process in the respective areas.
� UNODC, Southeast Asia Opium Survey 2013 (Bangkok, 2013).
b UNODC project proposal on alternative development in South Shan townships affected by opium poppy cultivation, 2015-2017.
While not all illicit cultivation is driven by poverty, most areas where illicit crops are grown are characterized by poverty. |48| This applies to coca-producing countries in South America, cannabis resin-producing countries such as Morocco, and opium-producing countries in Asia, notably Afghanistan, the Lao People's Democratic Republic, Myanmar and Pakistan. Beneficiary populations are rarely homogeneous but they often consist of people who can be considered to be "those at the bottom of the social pyramid". |49| They tend to be small-scale subsistence farmers working on small plots of land (a few hectares or less) that they do not legally own, artisanal fishermen, handicraft workers or land labourers. |50|
In the short term, alternative development is also about food security. A beneficiary in the Sierra Nevada of Santa Marta, Colombia, says: "One of the conditions was substituting illicit crops with food crops and rearing small animals such as pigs and chickens; we all started to plant plantain, cassava, squash, papaya, caster bean and cacao." |51| A farmer in the Lao People's Democratic Republic who actively participated in project activities in Oudomxay Province that were aimed at improving rice production |52| explains, in answer to a question on whether he would continue to adopt the techniques introduced under the project and plant hybrid rice even though he found it not as tasty as the local variety: "Definitely, I will adopt and sell the rice for profit, then buy for our consumption, it's not that difficult. The most important thing is that we have high production so that we have enough rice for the year round." In remote areas of Myanmar, opium is primarily cultivated as a cash crop to compensate for financial shortfalls and is often grown because few alternative crops are available and due to the need to provide basic necessities for families. |53| Overall income levels in the northern part of the Lao People's Democratic Republic and northern Thailand (the main opium-producing areas in those two countries) are lower than in other parts of the countries. Similarly, the main cannabis cultivation areas in Morocco are located in the Rif Region, one of the country's poorest regions, where farmers cultivating cannabis were found to earn less than the average income. |54| In Peru, the Human Development Index, which combines statistics on life expectancy, education and income, showed that indices of development were, on average, 60 per cent higher in non-coca-cultivating districts than in coca-cultivating districts in 2012. Moreover, overall improvements as measured by the Human Development Index were stronger in districts without coca cultivation than in corresponding areas of coca cultivation (0.08 points). |55| In the Plurinational State of Bolivia, the main coca-producing centres, Yungas de La Paz and Tropico de Cochabamba, are also located in provinces with below-average incomes. Similarly, in southern Afghanistan, where the country's opium production is concentrated, the overall per capita income of farmers was below the national average in 2013. |56|
Isolated areas with limited government control, often affected by tension, insecurity and conflict
One of the key particularities and difficulties of alternative development in comparison to development efforts in general is that the illicit cultivation of drugs often takes place in areas with weak rule of law and where there is a "need to achieve socioeconomic pacification and stabilization of the areas affected by the domination and violence of drug traffickers" or illegal armed groups. |57| As many areas of illicit cultivation are isolated and often plagued by ethnic and other conflicts or political instability, government control over them is limited. This means that people in such areas have limited or no access to basic services including education, sanitation and health care. |58| According to one evaluation report, "conflict deriving from social decomposition [is] endemic to communities with illicit crops, but overt violent conflict deriving from the drug trade and criminality, or from insurgent movements, is not uncommon". |59|
It is therefore often difficult to justify development assistance on purely economic grounds in such isolated areas. |60| Alternative development activities are sometimes the only institutionalized development interventions in such regions. By bringing in a State presence and development assistance, alternative development can open the door to the introduction — or reintroduction — of the rule of law in areas outside national government control. A good example is Thailand, where many of the initial interventions in highland tribe areas were prompted by national security concerns, and thus had as a key initial objective to "instil a feeling of loyalty to Thailand among the hill tribes" |61| through development programmes to integrate marginalized populations into mainstream society. Over the subsequent decades, the economic well-being of the hill tribes clearly improved, partly due to alternative development, as did the rule of law situation in those regions. |62| Similarly, a household survey among farmers in Peru, done as part of global evaluation of alternative development, found that peace and security, two preconditions of effective rule of law, were the most often-cited major long-term impacts of alternative development (88 per cent). The thematic evaluation of alternative development in Colombia indicated that alternative development actually helped create and sustain a "culture of legality" in the intervention areas. |63|
In areas where there is violence in the context of organized crime or armed conflict by groups aimed at bringing down the government and/or controlling territory (such as the Shining Path in Peru, the Revolutionary Armed Forces of Colombia (FARC), ethnic insurgent groups in Myanmar and Taliban and other non-State armed groups in Afghanistan), the effectiveness of alternative development has been questioned. |64| As a result, since 2007, the Government of Colombia has paid more attention to the role of illicit drugs as an instrument used by illegal armed groups to maintain control over territories where the State has no presence. Part of the rationale behind the new policy was the perceived lack of sustainability of both crop eradication and alternative development efforts. |65| The Colombian Government deemed that those efforts had suffered from weak State presence and support |66| and that the problem was not so much a result of the ineffectiveness of crop eradication or alternative development in itself, but due more to the fact that citizens were unable to exercise their rights and benefit from basic services of the State. |67| Similar experiences have been reported in Afghanistan. A recent evaluation report found the following:
The counter-narcotics and development effort in Nan-garhar has also fallen into disarray. Since 2013 eradication has been all but impossible in many of the southern districts where the crop has been concentrated. The kind of strategy used in each of the previous bans imposed in Nangarhar, where farmers were deterred from planting using a combination of negotiation, the promise of development assistance and the show of force through the roll-out of security personnel and infrastructure, is no longer an option. The failure to deliver on past promises, the harmful impact that successive bans had on large sections of the rural population, and a perception that government forces do not have sufficient coercive power to impose their will without the support of United States military forces, has rendered this approach unworkable, especially in the unruly southern districts where the Afghan State does not have a history of control. |68|
The new drug control model in Colombia provides an interesting example of the role that alternative development may play in such difficult areas. In 2007, the Mac-arena Integral Consolidation Plan was implemented as a pilot project for what would later become the national policy for territorial consolidation and reconstruction. The pilot project treated the control of territory, by illegal armed groups in particular, as the root of the problem. |69| In areas where there is a lack of State presence and control, armed groups can use their control over territories in a predatory manner by illegally exploiting communities and economic resources.
Another important factor that can explain the link between conflict and illicit cultivation is that beneficiaries may be migrants who have voluntarily migrated or been forcibly displaced from other areas because of threats, violence or conflict and have had to find livelihoods in new areas. Alternative development interventions subsequently have to take into account the weak social fabric and lack of trust found in such areas. As explained in an evaluation of alternative development in the South American Andes:
This historical dynamic, steeped in violence, has given rise to an individual psychology whose essence is fear and deep mistrust ... directed not only at the "outsider", which includes a State that has long neglected its rural citizens, but also at others in the community. |70|
The existence of indirect and direct linkages between conflict and illicit drug cultivation, whether related to social strife, migration or the presence of illegal armed groups, means that alternative development must also deal with conflict mitigation or resolution. Depending on the local context, this may mean that the support strategy of alternative development helps households and communities cope with the causes and consequences of conflict.
E. DRIVERS OF ILLICIT CULTIVATION
No single factor can explain why farmers grow illicit crops. Illicit cultivation is driven by situation-specific combinations of vulnerability and opportunity factors. As survival and subsistence are real considerations for many households that engage in illicit crop cultivation, they are frequently risk-averse and take a variety of elements into account when they make decisions on narcotic crop cultivation. Alternative crop cultivation depends on many factors: possession of the requisite skills and knowledge for growing such crops; geographical and environmental factors, such as climate, the availability of water and arable land, and proximity to market; household-specific socioeconomic factors, such as level of income, existing employment opportunities, access to credit and size of landholding; developmental facilities such as access to roads, the power grid and educational and health services; and sociopolitical and institutional factors, such as security, government control and rule of law.
INCOME GENERATION Many factors influence the decision to cultivate illicit crops. Income generation, particularly differences in the income derived from licit and illicit crops, is just one element in a complex mix of monetary and non-monetary incentives, but it can explain some of the fluctuations in illicit cultivation.
In Afghanistan, for example, the ratio of income per hectare from opium cultivation to income per hectare from wheat cultivation, which can be interpreted as an indicator of the appeal of cultivating opium poppy, was close to 10:1 during the 2004-2007 period ($5,200 per ha under poppy cultivation versus $545 per ha under wheat cultivation in 2007). During that period, the area under poppy cultivation in Afghanistan increased by 47 per cent. By 2009, the ratio of income from opium cultivation to income from wheat cultivation per hectare had declined to 3:1 ($3,600 vs. $1,200); in parallel, the area under opium poppy cultivation in Afghanistan had fallen by 36 per cent between 2007 and 2009. In subsequent years, the ratio increased again to 4:1 ($3,800 vs. $1,000 in 2014), even reaching a proportion of 11:1 in 2011, prompting a strong increase in opium poppy cultivation. During the period 2009-2014 as a whole, the area under opium poppy cultivation rose by 82 per cent.a
Similarly, strong declines in coca prices in Peru after 1994 (from approximately $4.40 per kg in 1994 to $0.50 in 1996, before rising to $1.60 in 1999), which were a consequence of a policy to stop illegal air traffic between Peru and Colombia, prompted a reduction in the area under coca cultivation by 66 per cent during the period 1995-1999. Subsequent coca price increases (to $3.90 per kg by June 2011), as alternative outlets had been found by traffickers, prompted coca cultivation to increase again by 61 per cent between 1999 and 2011.b
The importance of income generation is also reflected in the socioeconomic surveys conducted by UNODC in individual countries to identify the reasons why farmers cultivate illicit crops. The Afghanistan Opium Survey 2014, for example, revealed that the main reasons for cultivating opium were the high price of opium (44 per cent of all responses), followed by the ability of opium poppy to reduce poverty, i.e. provide "basic food and shelter" (20 per cent), and to "improve living conditions" (13 per cent). A UNODC survey conducted in Colombia also identified "source of income" as the main reason for farmers' engagement in the cultivation of illicit crops (71 per cent), followed by arguments of "traditional cultivation" (7 per cent), the problem of "access to markets" to sell licit products (5 per cent) and "pressure by armed groups to cultivate illicit crops" (2 per cent).
There have been a few instances in which the income generated by alternative agricultural products (such as palm oil in the Andean countries;c saffron and, in some years, black cumin, grapes, apricots, pomegranates and almonds in Afghanistan;d and potatoes, red cabbage, tomatoes and Japanese apricots in Thailand)e turned out to be higher than that from illicit crops, yet some farmers still opted for illicit cultivation. Possible explanations provided by experts and in evaluation documents included the following: (a) farmers were not convinced that such price differentials would last for a prolonged period of time; (b) there were risk considerations in taking the licit harvest to traders in the next town (as opposed to traders coming to villages and purchasing illicit crops directly from the farmers); (c) farmers were forced by the insurgency to continue planting illicit crops; (d) the initial funds needed for the investment in licit crops were rather large and yielded returns only after a certain period of time; and (e) there was a lack of recognized land titles, which fostered a tendency towards farmers taking a short-term approach in their decision-making processes.
� UNODC and Ministry of Counter Narcotics of Afghanistan, Afghanistan Opium Survey 2014: Cultivation and Production (November 2014).
b UNODC, World Drug Report 2012 and previous years.
c UNODC, Sharing Experiences on Alternative Development from Southeast Asia and Latin America (2009).
d UNDCP, Afghanistan Alternative Development Report #1: On-Farm Income Opportunities in Maiwand, Khhakrez and Ghorak (Islamabad, 2000).
e World Drug Report 2000.
While the risk factors for illicit cultivation vary from region to region, the specific nature of illicit crops with respect to agronomic aspects, durability of the product, price and ease of sale, among other things, tends to be one of the reasons for their cultivation. All major illicit crops are also particularly attractive because they produce quick returns from non-perishable products. In Afghanistan, opium provides a convenient, portable and durable store of value for rural households, which is particularly convenient in an insecure and uncertain environment. Opium is also an important, if not the only, means of accessing rural credit; its cultivation seems to be intrinsically linked to informal rural credit in source areas, where opium cultivators gain preferential, if not sole, access to informal credit arrangements. |71| In the Lao People's Democratic Republic and Myanmar, opium serves as a means of obtaining credit during times of food scarcity.
ENVIRONMENTAL SUITABILITY AND SOCIOECONOMIC VULNERABILITY MODELS FOR OPIUM POPPY CULTIVATION IN AFGHANISTAN In cooperation with the University of Salzburg (Austria), UNODC has developed an environmental suitability model and a socioeconomic vulnerability model for opium cultivation. The former includes four variables: land use (land cover), water availability, climatic conditions and quality of soil. The socioeconomic vulnerability model considers nine indicators: governance (recognition of governor authority), stability (conflict incidents), location (peripheral versus central regions), accessibility (travel time to nearest city of more than 50,000 inhabitants), education (access to schools), awareness (of agricultural assistance and initiatives designed to convince farmers not to cultivate opium poppy), alternative (off-farm) employment opportunities, credit availability and poverty.
These models were applied to Afghanistan, where a comparison with the actual areas under opium poppy cultivation in 2014 showed that many of the hotspots for opium poppy cultivation were located in the areas identified as potentially high-risk areas in the resulting environmental and socioeconomic risk maps. At the same time, the results of the risk assessment identified a number of additional areas, particularly in the south-eastern and northern parts of the country, that are potentially vulnerable to large-scale opium cultivation but have so far not turned out to be significant opium-producing regions.
Risk maps and actual opium poppy cultivation in Afghanistan in 2014
Potential environmental and socioeconomic vulnerability to opium poppy cultivation
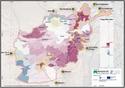
Click to enlargeActual opium poppy cultivation, 2014
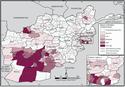
Click to enlargeSource: Afghanistan Opium Survey 2014: Cultivation and Production.
Note: The boundaries shown on this maps do not imply official endorsement or acceptance by the United Nations. Dashed lines represent undetermined boundaries. The dotted line represents approximately the Line of Control in Jammu and Kashmir agreed upon by India and Pakistan. The final status of Jammu and Kashmir has not yet been agreed upon by the parties.The risk maps also show that the risk factors behind opium cultivation vary from region to region, with the principal ones being environmental suitability, socioeconomic vulnerability, security/rule of law issues (as insecurity continues to be highly correlated with opium cultivation) and opium prices. For example, in selected areas of Badakhshan Province (north-eastern Afghanistan), the role played by environmental conditions, particularly climate, in deterring farmers from cultivating opium appears to have had more of an impact than the socioeconomic factors that can push farmers to cultivate opium. In selected areas of Nangarhar Province (southern Afghanistan), there was a comparatively low risk of opium cultivation resulting from socioeconomic vulnerability, yet there was still an increase in opium cultivation in 2014. This implies that other drivers play a role in opium cultivation, thus requiring more of a political response as opposed to purely development-related measures.
Although certain areas of the Provinces of Farah and Balkh (northern Afghanistan) have similar levels of risk of opium cultivation, despite great variations in their levels of socioeconomic vulnerability and environmental suitability, their respective outcomes in terms of opium cultivation are completely different: the area around Balkh is poppy-free, while Farah is one of Afghanistan's main poppy-producing provinces.
RISKS AND VULNERABILITIES RELATED TO ILLICIT COCA BUSH CULTIVATION IN COLOMBIA In close cooperation with the Colombian authorities, UNODC has also embarked on a novel approach to identifying risks and vulnerabilities related to illicit cultivation of coca bush. Focusing on statistics relating to the dynamics of coca cultivation, the UNODC Integrated System for Monitoring Illicit Crops in Colombia has developed an índice de amenaza (hazard index) for the presence of coca in municipalities in Colombia. The main logic behind this index is the observation that the spread of coca cultivation, though highly dynamic, still tends to be a rather gradual process, mainly spreading from existing areas under coca cultivation where accumulated know-how and similar socioeconomic and political conditions exist. The factors included in this index are: (a) the affected area (hectares of crops plus areas of manual eradication and aerial spraying); (b) persistence; (c) expansion; (d) concentration; (e) replanting; and (f) abandonment of coca fields over the years.
With regard to coca cultivation, the above was subsequently complemented with an índice de vulnerabilidad (vulnerability index), with vulnerability being understood as the condition that defines the degree of exposure to the threat of illicit crop cultivation and the actual capacity to prevent, resist and recover from the establishment of such illicit crops. It has been measured in terms of governance (tax income, dependence on transfers), social development (health, education), economic development (savings, Internet use), availability of justice, security (incidents) and human crisis (forced displacement/expulsion). The two indices were then combined into an overall risk map of the threats and vulnerabilities to coca cultivation.
Mapping the risk of cultivation on the basis of the two indices reveals that, out of 1,121 municipalities, 280 (roughly 25 per cent of the total) showed a threat or were identified to have been vulnerable to the cultivation of illicit crops in 2013. This included 45 municipalities (4 per cent of the total) which showed a "high risk" in terms of threats or vulnerability and 147 municipalities (13 per cent of the total) which had a "middle-high" risk of being affected by illicit crop cultivation.
The two main areas under illicit cultivation, the Departments of Narino and Putumayo (bordering Ecuador), are among the regions showing the highest index numbers for threats and vulnerabilities.
Similarly, the neighbouring Department of Caquetá and the Departments of Meta and Guaviare (central Colombia), which for years have been among the most prominent coca-growing regions, have been identified as high-risk areas. Potential risk areas have been also identified in several central and northern parts of the country, including the Department of Antioquia and the neighbouring regions and departments along the Atlantic coast, all of which have shown ongoing coca cultivation and involvement in cocaine trafficking. In addition, there are a number of other regions in Colombia that show a high risk potential, notably in the eastern and south-eastern parts of the country, which have so far not been among the main coca-producing areas.
Risk maps versus actual coca cultivation in Colombia in 2013, by municipality
Potential risk areas of illicit crop cultivation based on hazard and vulnerability indices
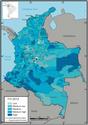
Click to enlargeActual coca cultivation, 2013
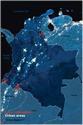
Click to enlargeSources: UNODC, Colombia: Coca Cultivation Survey 2013 (June 2014); Colombia, Ministry of Justice, presentation made in Berlin in November 2014 on alternative development in Colombia and preparations for the special session of the General Assembly on the world drug problem to be held in 2016; and Colombia, Ministry of Justice, "Lineamientos para el Plan Nacional de Intervention Integral para la Reduccion de los Cultivos Illicitos en Colombia" (draft, December 2014).
Note: The boundaries shown on this maps do not imply official endorsement or acceptance by the United Nations.
Number of municipalities facing threat (presence of coca cultivation) high medium-high medium medium-low none Total Number of municipalities facing vulnerability High 2 15 12 10 13 52 Medium-high 4 25 45 59 244 377 Medium 2 13 10 41 288 354 Medium low 5 8 26 228 267 Low 1 2 68 71 Total 8 58 76 138 841 1,121 Relationships between "drivers" and illicit crop cultivation are not necessarily linear. This means that a single factor can, under specific circumstances, be a driver of increases in illicit drug cultivation, although under different circumstances the very same factor may also turn out to limit or even reduce the spread of illicit crop cultivation. Improved irrigation can generally be expected to lead to an increase in licit cultivation, although, depending on the circumstances, it may also contribute to an increase in illicit cultivation. For example, assessments of a rural development programme in Afghanistan aimed at increasing agricultural production, mainly by supporting micro, small and medium-sized enterprises, found that an exclusive focus on expanding the licit economy, without assessing how the combination of different interventions targeted in the same geographic location would have an impact on different population groups, their household assets, and their decision to cultivate opium poppy, may have resulted in some of the development investments being used to cultivate greater amounts of higher-yielding opium poppy. |72| |73|
UNODC, in close cooperation with research institutes and national authorities, has started to engage in the development of specific models to identify the suitability and vulnerability of illicit drug production (see previous two boxes). The resulting risk assessments show that the reasons for cultivating illicit crops are diverse and often specific to particular areas. They also reveal that illicit crop cultivation is linked, on the one hand, to the dynamics of cultivation itself and, on the other hand, to underlying drivers and root causes related to conditions of vulnerability found in geographical areas where cultivation takes place, such as weak rule of law or a lack of social and economic development.
F. STRATEGIC ELEMENTS OF ALTERNATIVE DEVELOPMENT PROGRAMMES
Alternative development is as much about building licit alternatives for farmers who engage in illicit crop cultivation as it is about socioeconomic development and security in the creation of an enabling environment to reduce illicit cultivation over time. No two alternative development projects are the same, yet their general strategic elements are often similar, even though their roles may vary in importance from project to project and some may not feature at all. Based on reviews of successful projects, the major components and strategic elements are presented below. A summary table can be found in the annex of the online version of this report.
Economic and infrastructural component
Economic necessity tends to play an important role in the decision of farmers to cultivate illicit crops. That is why there is a broad consensus among experts that viable, sustainable income-generating alternatives need to be available in order to decrease dependence on illicit cultivation over time. In many countries, from the Lao People's Democratic Republic to Morocco to Peru, the development and promotion of income-generating activities are at the heart of alternative development. As section B of the present chapter shows, however, a focus on the production of alternative crops alone has proved insufficient, which is why alternative development projects now contain (or are accompanied by) a full range of technical, marketing and infrastructural support.
Financial services matter and the provision of credit is important. A female beneficiary in Peru explains: "Credit is a problem: sometimes you produce well and at other times you don't, and if you don't pay, the bank will not spare you." |74| Alternative development projects often face situations in which existing informal credit systems may give preferential access to households that cultivate opium poppy. As one farmer in upper Khogiani, Afghanistan, puts it, "Poppy is from God; it has lots of benefits. When we go to Jalalabad, shopkeepers now show respect, they offer loans and they help load our cars." |75| Part of that support is production-related, with one of its most common forms being the transfer of the requisite skills for the transition to alternative crops. This support may also include the transfer of infrastructural elements, such as collection centres, roads and bridges, or production-related resources, such as the provision of a water supply system or water storage tanks for irrigation, as in UNODC projects in Oudomxay Province of the Lao People's Democratic Republic or support for irrigation canals in the Badakhshan Province of Afghanistan. In the highland areas of Thailand, alternative development efforts have been accompanied by large-scale investment in roads and irrigation projects. |76| This is very similar to experiences in Peru, where the Government has invested heavily in economic infrastructure (roads and bridges), as well as social infrastructure (education and health care). |77|
Support and credit schemes
Production-related support can also involve the donation of livestock and rice banks, as in a project sponsored by the European Union in Myanmar, |78| or rice banks alone, as in Thailand. |79| China has donated rice to local authorities in Myanmar to address the food insecurity of former opium poppy farmers, while in Indonesia a rice mill was established in exchange for voluntary labour by villagers. |80| In 2010, an association of fish farmers in Colombia received international support in the form of fish cages, juvenile cachama fish and fish food through a call for proposals of the European Union's third Peace Laboratory. |81| Support also takes the form of seed distribution, as in the Helmand Food Zone project in southern Afghanistan.
As discussed in the previous section, lack of access to credit can be one of the drivers of illicit crop cultivation. To help poor farmers reduce illicit crop cultivation and begin alternative income generation, they need to have seed money for investment in new products, but remote communities often have no access to credit and other services. As bank or private loans entail high interest rates that farmers may not be able to afford, microcredit (or other forms of revolving funds) is a necessary component of alternative development programmes. Local credit and revolving funds can also help farmers to form organizations, to initiate saving schemes and to develop their capacity for financial planning and management. Several programmes in Asia incorporate various forms of microcredit, as well as revolving funds and assets, including rice banks, seed banks, revolving community medicine funds, village savings and microcredit production groups. The identification and exploitation of specialty markets is also a key element in Colombian and Peruvian alternative development programmes, an approach that requires adherence to strict guidelines and particular regulations but which yields returns on investment that are well worth the effort. |82|
One principle of alternative development initiatives (as opposed to quick-impact projects) is that alternative sources of income are meant to be sustainable. This generally implies that perennial cash crops (e.g. coffee and palm oil) are favoured in the selection of alternative crops, as they would not be immediately replaced by illicit crops should their market price drop temporarily. |83| There is also an increasing focus on promoting value-added products (instead of raw materials) in order to increase the income of small-scale farmers. The importance of a market-driven approach is increasingly being accepted. Producers of alternative development products are encouraged to adapt to current and prospective market demand; projects can assist them in creating new market niches. |84|
Marketing support, private sector involvement and value chain development
Support for the marketing of products of alternative development is now recognized as an important component of any project. Yet the marketing aspects have only recently grown in importance, with the main focus of alternative development still being on production, in order to boost productivity, output and quality. Boosting productivity tends to be regarded as a measure of success. But while the overarching objective may be raising income levels and indirectly raising the general living conditions of farming families, there is not always a clear marketing strategy for such products.
ALTERNATIVE DEVELOPMENT IN THE LAO PEOPLE'S DEMOCRATIC REPUBLIC: the role of microcredit In Oudomxay Province, Lao People's Democratic Republic, UNODC is supporting communities through improving food security and the increasing licit production of food and cash crops. The project has put in place rice banks, a water supply system, small-scale irrigation schemes and access roads, and has introduced improved and high-yielding crops, provided technical assistance (inputs and training) and conducted regular follow-up at the field level. This has contributed to an increase in annual household income from agricultural production (corn, rice, non-timber forest products, vegetables, fruit, livestock production and other licit crops) in 32 target villages of more than 500 per cent, from approximately $360 in 2009 to more than $2,100 in 2014. In the 17 new target villages, household income increased by 82 per cent, from $660 in 2011 to $1,200 in 2014.�
An important element contributing to the successes achieved so far has been the microcredit scheme. A village savings and credit fund was established by the project in 44 target villages. These schemes are managed by local committees, which conduct investment and return assessments, monitor investment records and carry out accounting and financial reporting. Farmers and production groups develop production and investment proposals, action plans and microcredit, and small investment loans are provided through the community cooperative mechanism.
The total amount of money held by the fund in the project target villages increased by 42 per cent during the implementation period of a year and a half. The communities have been able to increase the production of various alternative activities, including the cultivation of diverse crops, livestock rearing and fish farming, and small trading and handicraft production. A significant part of the village microcredit funds was invested in the production of corn, which is the most commonly produced cash crop in Oudomxay. Also, women's weaving groups have been supported by establishing revolving funds, which have enabled women to obtain the skills to manage such programmes and invest in their handicraft activities.
� UNODC, "Increasing food security and promoting licit crop production and small farmer enterprise development in Lao People's Democratic Republic and Myanmar: project XSPK26", annual project progress report 2014. Available from https://profi.unodc.org.
Despite these challenges, alternative development programmes have been able to produce added economic value, for example, by introducing agro-industry and social enterprises such as those related to the processing of macadamia nuts and coffee in Thailand and coffee and honey processing in Colombia (where marketing support has been quite successful through the establishment of second-tier producer organizations such as the Red Ecolsierra in Santa Marta). A coffee production plant has been established in the municipality of Albán in Nariño, Colombia.
To enhance marketing options and reduce some of the vulnerabilities related to illicit cultivation, alternative development programmes often try to involve the private sector. For example, a recent project in the Amazon region of Peru linked cacao production directly with a German importer of high-quality cacao, which provided technical assistance both pre- and post-harvest. |85| In the Region of San Martin, national companies that export palm hearts to Belgium, France, Germany, Lebanon and Spain, are involved in exporting products of alternative development. In these alternative development projects, the private sector has become an integral component of the strategy, not only in terms of implementing alternative development, but also through its broader investment in economic and social infrastructure. |86|
In some regions of Colombia, farmers or farmers' cooperatives have been connected to markets through commercial partnerships with businesses such as national supermarket chains (with the assistance of the Ministry of Agriculture and Rural Development) or with national or foreign companies. |87| Alternative development programmes have increasingly incorporated the private sector through, for example, joint ventures or public-private partnerships.
Connected to the growing role of the private sector in alternative development programmes, a focus on the development of the entire production value chain has become common in recent years. The objective of such an approach is to increase competitiveness and marketing potential through strengthening the economic, technological and organizational components of alternative development interventions within a single value chain. In Peru, one such approach has focused on high-potential crops such as palm oil and cacao, and has incorporated all elements in the chain, from providing agricultural inputs to technical assistance, and from building business alliances and public-private partnerships to linking to markets. |88| In the Plurinational State of Bolivia, the focus on the value chain enabled the optimization of production, a growing productive base and a boost in commercialization of products such as palm hearts. |89| In Thailand, projects involving coffee have not only shifted from selling green beans to roasted coffee, but have also incorporated the establishment of cafes where the coffee is sold. |90| In the Department of Uraba, the Government of Colombia and UNODC have established a commercial partnership with a major European supermarket chain, alternative development has been linked at the national level with a restaurant chain. |91| In Afghanistan, the value chain approach is implemented widely, from wool to carpets, and grapes to raisins, as part of the National Alternative Livelihood Policy, a joint initiative of the agriculture and rural development cluster led by the Ministry of Counter Narcotics.
QUICK-IMPACT PROJECTS CASE STUDY: the Food Zone in Helmand Province, Afghanistan Designed to assist farmers over a three-year period in the transition from an opium poppy-based economy to a licit agricultural economy, the Food Zone programme started in 2008. The programme targeted the central, irrigated parts of Helmand Province of Afghanistan, where most options for alternative crop cultivation were feasible. The area accounted for around 40 per cent of Helmand's total area under opium poppy cultivation in 2008, based on data from Cranfield University (United Kingdom).
Also intended to restore confidence in the Government, the programme comprised awareness-raising campaigns to combat cultivation of opium poppy, the distribution of wheat seed and fertilizer to farmers, and law enforcement activities, including eradication. Farmers who received such assistance were required to sign a declaration indicating that they would not cultivate opium poppy. Following the introduction of the Food Zone in 2008, opium poppy cultivation within the zone fell by 37 per cent in one year, while the cultivation of wheat nearly doubled. Cultivation of opium poppy within the zone continued to decrease until 2011, whereas opium poppy cultivation outside the zone increased by 8 per cent in the first year, according to data collected by Cranfield University, and continued to increase in the following years. Nonetheless, the strong decline in poppy cultivation in the Food Zone enabled an overall decline in opium poppy cultivation of 33 per cent in Helmand Province in 2009.� Nevertheless, the declines in the area under opium poppy cultivation within the Food Zone were increasingly offset by growing cultivation outside the Food Zone, notably in adjacent areas, including new agricultural areas to where members of households living in the Food Zone migrated to cultivate opium. In the following years, opium continued to be cultivated in the areas outside the Food Zone while it also increased in the Food Zone.
Helmand Food Zone, 2012
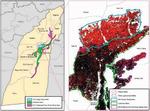
Click to enlargeSource: Afghanistan, Ministry of Counter Narcotics, Afghanistan Drug Report 2012 (November 2013).
Note: The boundaries shown on this maps do not imply official endorsement or acceptance by the United Nations.Basically a quick-impact project, the Food Zone was successful in influencing the decisions of farmers within the zone during the period 2009-2012. In the Afghanistan Opium Survey 2012, farmers in the Food Zone still reported having an income that was, on average, about 30 per cent higher than the income reported by farmers outside the Food Zone. Yet the project had apparently not succeeded in fundamentally changing the socioeconomic and institutional conditions in the province: as assistance declined farmers resumed opium poppy cultivation over the 2012-2014 period.
Poppy cultivation inside and outside the former Helmand Food Zone, 2012-2014
Cultivation 2012 (ha) Cultivation 2013 (ha) Cultivation 2014 (ha) Change 2013-2014 (%) % of agricultural land with poppy Inside the Food Zone 24,241 36,244 41,089 13% 22% Outside the Food Zone 50,935 64,449 62,151 -4% 31% Total province 75,176 100,693 103,240 3% 27% Note: The Food Zone estimates refer to an area in 10 districts of Helmand (the Food Zone as of 2011), where farmers were provided with fertilizer, certified wheat seeds and high-value horticulture seeds in the poppy-planting seasons for the 2009-2012 harvests. See UNODC and Afghanistan, Ministry of Counter Narcotics, Afghanistan Opium Survey 2009 and Afghanistan Opium Survey 2014, methodology section.
One particular challenge the Food Zone had to overcome was the complex issue of labour. Illicit opium cultivation is far more labour intensive than, for example, wheat cultivation. It requires more land labourers not only for weeding, but also during the harvest. In the Food Zone area, many landless people work as seasonal labourers in illicit opium poppy cultivation; with the shift to wheat production and some agricultural mechanization, thousands lost their basic livelihoods and moved north of the Boghra canal, thus giving rise to an explosion of cultivation in that area.
Sources: Afghanistan, Ministry of Counter Narcotics, Afghanistan Drug Report 2012 (November 2013); Afghanistan Opium Survey 2014 (and previous years); and David Mansfield, "Where have all the flowers gone? Assessing the sustainability of current reductions in opium production in Afghanistan", Afghanistan Research and Evaluation Unit briefing paper series (May 2010).
� According to UNODC and Ministry of Counter Narcotics of Afghanistan, Afghanistan Opium Survey 2009 (December 2009), sect. 2.1.
Thailand provides an example of long-term private sector involvement from an early stage: six Thai and Japanese companies have invested in a business to carry out economic forestry development as part of the Doi Tung Development Project, and to promote the cultivation of coffee and macadamia nuts along the entire value chain, up to and including processing and marketing, so as to provide farmers with sufficient income to be able to resist cultivation of opium poppy. In this case, the partnership with the private sector provided access to funding sources, technical knowledge, business expertise and marketing. |92|
However, private sector investment and involvement in alternative development programmes does not yield only positive results. Sometimes business interests are not fully in line with the objectives of a particular programme. An example can be found in the Lao People's Democratic Republic and Myanmar, where some foreign companies working within an "opium substitution" scheme tend to favour large-scale monocrop plantations (e.g. rubber) as opposed to the crop diversification strategies of the respective Governments. These commercial plantations have been said to reduce the land available to small-scale farmers and increase competition for land labourers. Similarly, the value chain approach may not be successful under all circumstances. For example, analysts have questioned its economics-driven focus, which has not always been able to take into account the complexities of fragmented societies with weak Governments and particular sociocultural needs and conditions. |93|
Market access
In political declarations and the United Nations Guiding Principles on Alternative Development, countries are clearly urged to increase market access to products of alternative development. Preferential treatment regarding market access is in line with the Political Declaration adopted by the General Assembly at its twentieth special session, in 1998, and its related measures to enhance international cooperation to counter the world drug problem, in which it was underlined that "the international community should attempt to provide greater access to domestic and international markets for alternative development products". |94| The issue of market access gained even more prominence in the final document of the International Workshop and Conference on Alternative Development, organized by the Government of Thailand, in association with the Government of Peru and in close collaboration with UNODC, in Chiang Rai and Chiang Mai, Thailand, in November 2011. In that document, officially presented to the Commission on Narcotic Drugs at its fifty-sixth session, |95| it was recommended that Member States, international organizations and regional organizations "do their utmost ... to consider measures to enable products of alternative development to have easier access to national and international markets, taking into account applicable multilateral trade rules". |96| A less demanding reference regarding market access, in line with the language used in the Political Declaration and Plan of Action on International Cooperation towards an Integrated and Balanced Strategy to Counter the World Drug Problem, is found in the United Nations Guiding Principles on Alternative Development. In those Guiding Principles, it is pointed out that, in designing alternative development programmes, States "should take into account issues related to the establishment of agreements and viable partnerships with small producers ... and adequate market access". |97| The latter aspect has also been covered in detail in Commission on Narcotic Drugs resolution 56/15, in which interested Member States were invited to expand their efforts with regard to the development of "strategies on voluntary marketing tools" for products stemming from alternative development.
NON-AGRICULTURAL ALTERNATIVE LIVELIHOODS: ecotourism in Colombia In the Region of the Sierra Nevada de Santa Marta, alternative development has included ecotourism� as a source of income to complement that from the cultivation of sugar cane, thanks to the construction of posadas (wooden cabins) in several rural settlements. The Government enlisted the support of architects and provided construction materials and labour to construct the cabins, but then its support ceased. Although the scheme proved popular with international visitors, its main downside is that the tourism sector is cyclical and is not sufficient to create a sustainable livelihood. It does at least provide a complementary income, however. Nevertheless, its potential is huge, as this region boasts the combination of a coastline, national parks such as Parque Tayrona and the proximity of the popular tourist destination of Santa Marta.
In the Department of Meta, ecotourism is also an alternative livelihood, particularly in the Municipality of La Macarena,b where in the past three years 33 tourist guides have been trained. Tourism in this region has the potential to grow significantly, but the main hindrance is poor accessibility owing to a lack of regional flights.
Further government support for the local tourism sector is expected over the next few years, with the priority of creating access to specialized university courses, distance learning and complementary economic activities (e.g. making handcrafted products) off season.
� Ernesto Bassi Arévalo, "El apoyo institucional como factor clave: EMSOLMEC como ejemplo de gestion de alianzas que contribuyen al desarrollo economico, social y ambiental de la Sierra Nevada de Santa Marta", in UNODC and Accion Social, Organizaciones que Cambian Vidas: Programa Familias Guardabosques y Programa Proyectos Productivos (Bogotá, Impresol, October 2008), pp. 266-293.
b Colombia, Centro de Coordinación de Acción Regional, "Avances 2009: plan de consolidación integral de La Macarena" (December 2009), sect. 8.5.
Political component
Significant and long-term investment and support
The political component of alternative development is based principally on political and financial support by Governments to alternative development or to other rural development strategies that may directly or indirectly affect the driving factors of illicit cultivation. Long-term political support is essential to the success of alternative development projects, as such support is required to build long-term licit alternatives and transfer skills in areas where alternative development takes place. Time is needed to address not only the economic drivers behind illicit cultivation, but also the building of trust with local communities. As farmers are often involved in activities linked to illicit markets on the basis of rational choice, it takes time before they can be convinced that licit alternatives can provide them with a sustainable and profitable source of income. Thailand, among others, provides a good example of progress through substantial, long-term investment by international donors, non-governmental organizations, the private sector and Governments. |98|
The political component of alternative development often concerns supply reduction in line with national and international drug control strategies, but in a broader context of increasing stability, security and the rule of law. Law enforcement measures such as interdiction or crop eradication accompany alternative development within a broader political strategy to bring down illicit cultivation. They attempt to impose order in areas where there is no, or limited, rule of law.
Conditionality
One of the most controversial issues in approaches applied to alternative development is the application or non-application of a so-called "conditionality clause". This reflects the debate about whether the benefits of alternative development activities should be in some way conditional on the intended results of supply reduction. Discussions of the concept of conditionality arise whenever its application interferes with the relationship between alternative development providers and farmers (and their organizations). In this regard, there are two conflicting issues: con-ditionality clauses can harm the relationship, sense of ownership and trust that should exist for development processes to be successful; and Governments need to have a certain degree of reassurance from farmers that, through economic and social assistance, illicit crops will actually be reduced over time. There is no common approach to conditionality, and a review of national strategies shows that most countries do not make reference to this issue in their strategy documents. In the strategies of Colombia and Peru it is specified that prior (voluntary or forced) eradication is a precondition to participation in alternative development programmes. In the strategy of the Plurinational State of Bolivia it is mentioned that no prior eradication or reduction is necessary, and that public investment in infrastructure and social development come first, before alternative development programmes are started.
Conditionality is closely linked with issues of sequencing. The Political Declaration and Plan of Action on International Cooperation towards an Integrated and Balanced Strategy to Counter the World Drug Problem explicitly states that Member States should "ensure the proper and coordinated sequencing of development interventions when designing alternative development programmes" and "ensure, when considering taking eradication measures, that small-farmer households have adopted viable and sustainable livelihoods so that the measures may be properly sequenced in a sustainable fashion and appropriately coordinated". |99| In the United Nations Guiding Principles on Alternative Development it is stressed that countries should ensure "the proper and coordinated sequencing of development interventions when designing alternative development programmes" and that "alternative development policies should be implemented alongside efforts made by States to strengthen the rule of law and promote health, safety and security so as to ensure a comprehensive approach to tackling the challenges that may be posed by the possible links between drug trafficking, corruption and different forms of organized crime and, in some cases, terrorism". |100|
Organizational component
Experience with alternative development has shown that creating, strengthening and supporting farmers' associations and community management groups is generally the best way to boost rural development processes. In Colombia, for example, such associations have helped to generate social capital, promote effective project control measures within communities and create better relationships between farming communities and local and national governments. |101| A total of approximately 600 producer organizations have been either created or strengthened through alternative development programmes in Colombia. In Thailand, a significant number of women's groups, youth groups and vocational groups have been created to strengthen "local capacity and initiative". |102| In addition, resource management groups, such as village water management and forestry management committees, effectively serve to ensure a sense of joint ownership, responsibility and sustainable management of resources by the community, and also enhance community self-governance capability. |103|
Establishing or working with existing farmers' organizations is common practice in alternative development, especially in Latin America, where, in contrast to the more village-based interventions in Asia, the strategic focus has often been on working with first- and second-tier producer organizations. |104| The main examples are sector or producers' committees, cooperatives and farmers' associations, such as a German-sponsored project in Peru that worked with existing cooperatives. |105| Other projects in Peru have helped establish producer associations and cooperatives, which is a popular strategy with farmers, as they believe this will generate higher profits and more control over the marketing of what they produce in the medium to long term. |106|
Alternative development is not only about hectares, competitive advantages, profit and economic sustainability. It is first and foremost about its beneficiaries: men, women, children and their wider communities. It is about transferring skills and knowledge to those beneficiaries to improve lives. A farmer in Naseankham, a village in the Lao People's Democratic Republic, says: "We now have the skills, knowledge and incentive to cultivate vegetables and fruit trees. This has improved our livelihoods — and gives me hope." |107| In addition to providing profitable and sustainable alternatives, alternative development is about providing security, State protection, social acceptance, a better future for farmers' children and access to basic services such as health and education. A villager in Qarhuapampa, Peru, stresses the importance of improving education, improving schools and having high schools so that the people are better educated and can have more opportunities. |108| A beneficiary in Tumaco, Colombia, explains: "We know we are not looking for wealth here, but it has been a more rational use of the forest involving a number of families that benefit from the work and the developments in education and health care." |109| Support to producer associations is among the most important reasons why farmers continue to participate in alternative development programmes, but it is not clear whether this strategy always leads to increased income. |110| With fluctuating sales, in some years the benefits are limited to increasing production and the social base of associations. |111| Nevertheless, alternative development has been able to contribute to the creation of social capital, whether in terms of commitment to community development or the investment of community members in farmers' associations in order to improve the production and marketing process. |112|
Among the downsides of an organizational strategy can be a loss of farmers' independence (as farmers depend more on joint strategies, resources and the commitment of other farmers) and loss of flexibility, especially in the case of large associations or complex decision-making procedures. Moreover, in some contexts or countries, the concept of "cooperative" may have significant disadvantages if it is not supported by the authorities.
Social component
The social component of alternative development is much broader than the projects themselves, and tends to involve a national or international strategy to boost the socioeconomic development of local communities in drug-producing areas. For example, the Thai-German Highland Development Programme (1981-1998) had a considerable impact on increasing access to education, health care and clean drinking water. |113| In Morocco, alternative development projects focus on improving access to basic services (e.g. education and health) within the National Initiative for Human Development. The evaluation of the Peruvian alternative development programme clearly states that more impact can be generated at the local level if alternative development is coordinated better with social and poverty-reduction programmes. |114|
Social strategy is not only about improving the socioeconomic conditions in which the impact of alternative development can be enhanced, but also about the creation and strengthening of social organizations and the direct participation of beneficiaries in the design, planning and implementation of rural development projects, including alternative development projects.
Local ownership and community participation
There is a general consensus that alternative development interventions can work only if they manage to achieve or build on the involvement of local communities or beneficiaries. Direct participation by farmers and communities plays a key role in the design and planning of alternative development activities, especially in areas where no effective public institutions can fulfil this role. Over the years, the emphasis in alternative development has shifted from focusing merely on technical and economic aspects to a more integrated vision of the problem and a long-term perspective regarding development and security of the area under consideration. In spite of this progress, considerable challenges remain in terms of the articulation of alternative development and the interaction between governmental bodies and local communities. The latter is often characterized by a lack of State presence in illicit-drug-growing areas and by a widespread mistrust at the community level towards government agencies.
In Thailand, the participatory approach has contributed to success, based on the creation of "learning organizations" in local communities that were able to take on board new ideas and methods of working. |115| In addition, local community representatives or volunteers were brought on board from the beginning to serve as a two-way link between projects and the community to ensure effective communication in the local languages, and to ensure that community members were fully engaged throughout the project and that the local representatives received firsthand experience, enabling them to be at the heart of their community's development process. |116| In Aceh, Indonesia, local communities have begun to take ownership of various initiatives at the Sustainable Rural Development Centre, overseeing and operating the activities themselves after having received sufficient capacity-building. |117|
In Pakistan, one of the common elements of success in Dir District was community participation in the first phase of project implementation, when priorities were established and interventions selected. |118| To create more ownership, in Afghanistan, UNODC supported infrastructure projects that had been identified as priorities by the local communities themselves, such as canal rehabilitation in Jowzjan and Badakhshan Provinces. In the latter province, a 22-km road was also constructed to connect 12 villages to markets and basic services, again on request from the local community development council. These Afghan projects can be considered "quick-impact" alternative development projects, which not only addressed problems of water delivery and irrigation but also were meant to build trust among stakeholders.
Land governance
Land governance can be defined as the "rules, processes and structures through which decisions are made about access to land and its use, the manner in which the decisions are implemented and enforced, and the way that competing interests in land are managed". |119| As a normative concept, it is aimed at establishing guidelines for sustainable land policies, including complex issues such as access to land, land rights, land use and land development. |120| At the global level, it has been recognized that secure and equitable rights to land and natural resources are central to achieving sustainable development. |121|
Lack of access to land can be one of the drivers of illicit cultivation, so land tenure and the sustainable management and use of land are crucial elements for the long-term success of alternative development. Expert meeting discussions in 2013 highlighted that: "Most alternative cash crops require long-term engagement of farmers, since they require several years to produce yields. Without access to land, farmers are not willing to engage in cultivating long-term cash crops." |122| Furthermore, a recent technical briefing paper stated that land rights "empower people and provide a sense of dignity. They enhance food security and are fundamental to achieve the right to food and increase the productivity of small-scale food producers." Land rights also have broader social implications, such as promoting more inclusive and equitable societies, specifically the participation and empowerment of women. |123|
Lack of access to land is also an important component in countries where landless people work as seasonal labourers during the very labour-intensive opium harvest. In Afghanistan, one of the UNODC pilot projects in Herat Province helps rehabilitate farm production, including by land stabilization in areas that are in the process of becoming desert, by irrigation development, agricultural diversification and community enterprises. The objective is to prevent people who can no longer meet their basic livelihood needs by working as seasonal labourers in opium poppy fields and as small-scale drug traffickers.
In the United Nations Guiding Principles on Alternative Development, it is recommended that countries "take into account land rights and other related land management resources when designing, implementing, monitoring and evaluating alternative development programmes, including those of indigenous peoples and local communities, in accordance with national legal frameworks". |124|
While there is broad agreement that alternative development should address the issue of land tenure, very little research has been conducted into the linkage between these two issues. |125| The preliminary findings of a study commissioned by the Government of Germany in 2013 into the nexus between illicit drug cultivation and access to land suggest that, so far, land rights have hardly been included in alternative development programmes at all. The study confirms the dual relationship between alternative development and land tenure: restricted access to legal land titles often leads to illicit cultivation, while secure access to land seems to offer the best chances for sustain-ably transitioning to legal livelihoods. The research states that secure land rights increase the willingness of farmers to invest in the long term in the establishment of a licit livelihood and improve their access to credit. Based on experiences, especially in the Andean region and SouthEast Asia, there are many potential benefits of considering land tenure concerns in alternative development programmes.
LAND TITLING/LAND OWNERSHIP The granting and/or enforcement of individual and collective land titles has proved a successful alternative development strategy in several areas in the Andean region. However, in some countries in South-East Asia, such as Myanmar, strong population growth, in combination with land titles being confiscated or granted to outside investors, has meant that the traditional system of shifting agriculture, in combination with a "slash and burn" approach, in the highlands may no longer work. This approach leaves local communities with ever smaller plots per capita and with ever more degrading soil (as farmers can no longer move to new plots), which are not sufficient to guarantee food security for their communities. As a consequence, some of these communities have started to cultivate opium poppy in order to generate additional cash to purchase food.�
In many of the countries where illicit crops are cultivated, poverty is associated with a lack of land for generating sufficient income from the cultivation of licit crops. In Afghanistan, data collected during the UNODC opium survey revealed that the landholdings of opium-growing farmers were on average almost 40 per cent smaller than those of farmers who produced licit crops in 2014. Opium production was far more common among farmers with 2 ha or less than among farmers with larger holdings. Even among opium poppy farmers themselves, data show that smaller landholders dedicated a higher proportion of their land to illicit opium production than larger landowners did. The average land area dedicated to opium production amounted to 0.45 ha, which was equivalent to on average 35 per cent of the 1.3 ha of total land available to an opium poppy farmer. Even smaller landholdings of an average of less than 1 ha were reported for sharecroppers and tenants who were cultivating opium poppy.
Landholdings in Afghanistan, farmers of licit crops versus opium poppy farmers, 2014
Average size of landholding in hectares
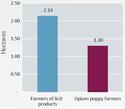
Click to enlargeDistribution of landholdings
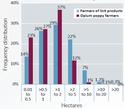
Click to enlargeSource: UNODC, data from the socioeconomic survey of farmers in Afghanistan (based on interviews with 680 farmers of opium poppy and approximately 4,000 farmers of licit products).
� Transnational Institute, Bouncing Back: Relapse in the Golden Triangle (June 2014), p. 14.
A special case of linking alternative development with land ownership can be found in Colombia, where land used by farmers, mostly to grow coca leaf, was acquired for the ethnic Kogui indigenous people in the Sierra Nevada de Santa Marta and added to their reservation. The Kogui indigenous people are involved not only in coffee production but also in the environmental protection of the lands they control. In general, under Colombia's Forest Warden Families Programme, the acquisition of land is important for preventing illegal crops from reappearing after the end of a programme. The idea behind this strategy is that beneficiaries will be more attached to their land and will fear losing it if illicit crops are found. It also has additional benefits for the sustainability of legal economic activities, as it enables the acquisition of productive loans and generates incentives for investing in the land. As people grow attached to their own land, it also prevents migration. As such, promoting land acquisition may be one of the most effective ways of preventing the return of illicit cultivation to areas where alternative development is implemented.
POSSIBLE BENEFITS OF LINKING ALTERNATIVE DEVELOPMENT WITH PROCESSES OF LAND TENURE AND LAND ACQUISITION
- Contribution to a culture of legality and willingness to abandon illicit cultivation
- Increase in commitment to and ownership of alternative development projects
- Generation of incentives to invest in the land and licit livelihoods
- Increase in access to formal credit for investing in licit livelihoods
- Prevention of migration, as people grow more attached to their land
- Prevention of environmental harm if less migration reduces pressure on the expanding agricultural frontier
- Protection of the environment and biodiversity if individual or communal land rights lead to better management and restoration of forests
- Increase in the attraction of alternative development programmes or alternative livelihoods in general to farmers, given the benefits associated with land tenure
- Decrease in social tension around local land disputes
- Voluntary resettlement from protected or unsuitable areas if farmers can be offered land tenure in other areas
- Increase in number of farmers investing in perennial crops and cash crops that only become profitable in the long term
In another project in Colombia, the component of formalization of land ownership had the objective of facilitating the acquisition of land ownership titles through notarial or administrative procedures led by the Instituto Colom-biano de Desarrollo Rural (INCODER). In the framework of this component, more than 1,000 land ownership titles were issued to farmers, families of African descent and displaced families, for more than 18,000 ha of land (approximately 3,000 ha of which were bought) in the Departments of Antioquia, Putumayo and Cordoba. The component of land titling was recognized as a precursor to the task of formalizing land tenure within the framework of alternative development projects in Colombia. |126|
It should be noted that the promotion of land rights is a strategy that goes beyond alternative development programmes. It is normally part of national development plans or strategies, such as the national development plan of Mexico for the period 2013-2018, which can indirectly help to prevent illicit cultivation. An evaluation of a project in the Plurinational State of Bolivia mentions that the Ministry of Rural Development and Land is making progress with land titling in the Department of La Paz, and expects to complete the process by 2017. |127|
Environmental component
The Report of the International Narcotics Control Board for 2005 stated that environmental concerns had become "virtually inseparable" from illicit crop cultivation. |128| The environmental impact of illicit drug production and trafficking has been broadly documented, |129| with significant attention to the way in which illicit crops cause the degradation and destruction of primary forests in Latin America and South-East Asia. In addition to the negative environmental impact of illicit cultivation, there has been increasing attention paid to the role alternative development can play in environmental protection. The United Nations Guiding Principles on Alternative Development state that: "Alternative development programmes should include measures to protect the environment at the local level, according to national and international law and policies, through the provision of incentives for conservation, proper education and awareness programmes so that the local communities can improve and preserve their livelihoods and mitigate negative environmental impacts." |130|
Thus, alternative development has both a component of "do no harm", trying to minimize the environmental impact of alternative development interventions, and a proactive component, in which programmes directly or indirectly contribute to the protection of the environment and biodiversity and the mitigation of climate change. The latter has been one of the most recent additions to alternative development programmes. In Colombia, the BIOREDD+ programme, |131| sponsored by the United States Agency for International Development (USAID), is one of the first projects operating in communities where alternative development programmes take place to link sustainable agricultural production at the local level to the international market for carbon credits.
ALTERNATIVE DEVELOPMENT, REFORESTATION AND AGROFORESTRY: the example of the Plurinational State of Bolivia In the tropical lowlands of the Plurinational State of Bolivia, integrated forestry management and agroforestry projects started in 1994� to provide farmers with sustainable livelihoods to reduce illicit coca cultivation. Despite deforestation as a result of illicit coca cultivation, enough forests remained, but they had never been managed sustainably. The initial projects had two central components: developing forest management plans for the sustainable production of wood and non-wood products; and introducing agroforestry systems of tree and legume crops, interplanted with annual and perennial crops.b It was intended that the latter component would provide additional income to farmers, as well as increase food security, through food crops, vegetable gardens and the breeding of livestock.
Within the current strategy, reforestation, sustainable extraction of forest resources and agro-forestry reinforce each other.c Income generation goes hand in hand with forest preservation: "in order for these practices to be fully adopted by growers, ... [they] must guarantee economic benefits. In other words, in order to preserve tropical forests, it is necessary to make use of its timber, and to preserve cultivatable soil, agro-forestry must generate real income".d One of the projects in the Plurinational State of Bolivia, the Jatun Sach'a project, resulted in positive change in terms of strengthening producers' organizations, capacity-building, reducing unsustainable exploitation and introducing new crops and agro-industry (e.g. portable sawmills).e
This project has particularly benefited women, who were trained to use local plants and vegetables to create products that enhance food security and improve nutrition in farming communities. In terms of agroforestry and reforestation, the sustainable and integrated management of natural resources in the tropics of Cochabamba and the Yungas of La Paz project showed considerable results: between 2006 and 2013, 4,900 ha of agroforestry systems were established based on coffee, cacao, rubber and other tree crops, while 3,000 ha were reforested with various tree varieties and 12,800 ha of primary forest received sustainable management, including proper marketing of wood products.f
� The Jatun Sach'a project began in 1994. Another Food and Agriculture Organization of the United Nations (FAO) project, financed through UNDCP, started in 1997.
b FAO, "FAO helps Bolivia in fight against cocaine trade", news release (30 March 2000). Available at www.fao.org/News/2000/000307-e.html.
c Plurinational State of Bolivia, Ministry of Rural Development and Lands, "Estrategia Nacional de Desarrollo Integral con Coca 2011-2015" (June 2011), p. 50.
d Plurinational State of Bolivia, Vice-Ministry of Alternative Development; UNODC; and FAO, "Proyecto Jatun Sach'a: 10 anos construyendo una cultura forestal" (2005), p. 9.
e Ibid., p. 39.
f UNODC, Annual progress report for 2014 on project BOLI79 (sustainable and integrated management of natural resources in the tropics of Cochabamba and the Yungas of La Paz).
A more common element of alternative development has been the focus on agroforestry and sustainable forest management in general. Such projects can be found in virtually all countries where alternative development programmes have been implemented, from the Chapare Region in the Plurinational State of Bolivia to Chiang Rai Province in Thailand. Reforestation and countering soil erosion are part of the objectives under this strategy, and are often addressed through agroforestry, including the combination of tree crops such as coffee and cacao with reforestation (e.g. in order to provide shade and improve the soil), as well as oil palm, rubber and peach palm cultivation. |132| The agroforestry projects in Thailand balance livelihood development and environmental sustainability objectives through the promotion of proper zoning practices. Specific forest areas are designated for conservation, for limited daily use and for economic use in the form of high-value crops such as coffee and macadamia nuts. The land and forest management model of the Doi Tung project has increased the forest area from 30 to 85 per cent. |133|
Morocco also includes forest management, reforestation and the protection of biodiversity in one specific environmental pillar of alternative development. Finally, a study |134| conducted in Colombia revealed that, during the implementation of the Forest Warden Families Programme (between 2003 and 2010), more than 75 million tons of carbon were stored in 546,000 ha of preserved forest. During the same period, agroforestry systems, promoted under the Alternative Productive Projects Programme in 23 municipalities, captured more than 37,000 tons of carbon.
The above strategies require the delicate balancing of environmental concerns and commercial objectives. Indeed, a structural problem related to alternative development could be described as the "alternative development/environmental protection trade-off". For example, illicit coca cultivation leads to deforestation, but legal alternatives such as livestock may actually lead to more deforestation. This can be seen in areas such as the Department of Meta in Colombia, where livestock is used as an alternative livelihood and efforts are made to mitigate the negative impact on the environment, for example, through environmental guidebooks related to livestock, cacao, poultry, fishing and other alternative livelihoods. |135| More generally, the use of harmful pesticides can have very negative consequences for the environment, whether used on licit or illicit crops. Similarly, alternatives such as ecotourism can have negative effects on the protection of biodiversity or the environment, while the construction of infrastructure may also have an environmental impact. |136| To increase the sustainable use and management of forests and territory, Colombia has developed some guidelines containing best environmental practices, under its flagship Forest Warden Families Programme, |137| which has, for example, increased the use of organic fertilizer, crop rotation and stump-retention practices.
A focus on women
Many alternative development programmes have a specific focus on women and their empowerment. The recent project in the Municipality of La Asunta, in the Plurinational State of Bolivia, was specifically aimed at strengthening the role of women in both the production and marketing of alternative crops. |138| In Afghanistan, associations and enterprises involving women have been established, for example, concerning saffron, mint and dairy products in the Provinces of Ghor and Herat, among others, |139| while UNODC has supported a small-scale project in Herat Province to train women in tailoring.
The 2010, USAID-sponsored Alternative Development Programme in Peru found that women played a critical role in increasing the impact of alternative development. They played an important role in the decision-making process, whether in relation to the decision to maintain a coca-free licit livelihood or management and investment decisions on farms. Focusing on the leadership of women, networking and empowerment in general was also seen to contribute to the promotion of broader public issues, leading to an enabling environment in which communities could sustainably reduce illicit coca cultivation. |140| In the Lao People's Democratic Republic and Viet Nam, UNODC projects worked through the respective women's unions, ensuring the participation of women in village development committees, and created special microcredit funds for women. This was supplemented by adult education, literacy classes and the development of numerical skills. |141| Women became more empowered when they had a regular income, and this helped them become more involved in decision-making processes and, in the Lao People's Democratic Republic, even to be elected as village head and district chiefs.
G. MEASURING THE SUCCESS OF ALTERNATIVE DEVELOPMENT
Challenges in the evaluation of alternative development interventions
What do the beneficiaries say about the impact of alternative development projects? A woman in Huay Nam Koon, a village in northern Thailand, says: "My life is stable and secure now and I see a positive future for my children." |142| Similarly, another project beneficiary in Thailand explains: "We feel more secure here now because we are in a position to negotiate with the Government. Officials don't come and threaten us any more." |143| In the former coca-growing areas of Peru, where drug traffickers were highly influential in the 1980s and 1990s, local farmer cooperatives have become successful coffee producers. A member of one such farmers' cooperative, which also runs an organic coffee programme, says: "I do not have to hide any more," he says, "I am proud ofwhat I produce. I pay taxes and I can now provide my whole family with health insurance. Before, I had to hide from the police and I did not feel proud at all, I felt ashamed, because I knew I was doing something illegal." |144| In its resolution 45/14 of 15 March 2002, the Commission on Narcotic Drugs urged Member States to facilitate "a rigorous and comprehensive thematic evaluation for determining best practices in alternative development by assessing the impact of alternative development on both human development indicators and drug control objectives and by addressing the key development issues of poverty reduction, gender, environmental sustainability and conflict resolution". In the resulting report, the decline in illicit crop cultivation achieved over the previous 15 years in areas where alternative development had taken place in both the Andean region and South-East Asia were described, although it was acknowledged that "the precise impact of its contribution is not always known". |145|
In that evaluation it was also pointed out that baseline studies rarely existed at the project level, often making it impossible to monitor impact at the household and other levels. At that time, the reduction in illicit cultivation was used in most alternative development projects as a measure of impact and changes in human development indicators were not measured. For example, documents on UNODC-supported alternative development project in the 1990s included outputs on infrastructure and agricultural support, social and health services and capacity-building, but the main achievement indicator was usually the reduction of illicit cultivation.
At the national level, the ultimate success of alternative development has often been seen in its contribution to the overall reduction in the area under illicit crop cultivation, although, given its localized nature, its contribution to national cultivation trends is not known. Alternative development constitutes only one of the national strategies applied within a broader package, which contains elements ranging from eradication, conflict resolution and strengthening of the rule of law to overall socioeconomic development. As mentioned earlier, alternative development is not generally an objective in itself, but rather a means to an end: it is aimed at contributing to an enabling environment for long-term rural development without illicit cultivation. This is partly why measuring the coverage, quality and effectiveness of alternative development interventions and services with regard to addressing the drug problem is challenging.
The long-term nature of alternative development interventions is another factor in the complexity of measuring their success. Experience has shown that the success of alternative development in terms of reducing illicit crop cultivation should only be determined after several years of intervention, and attempts to measure success over shorter periods have been found to be counterproductive, particularly when such information is used for immediate action.
The fact that projects take place at the local level but are often evaluated at the national level can also affect perceptions of whether an alternative development programme has been successful or not. A prime example of this is the so-called "balloon effect", which is the shift that may occur when alternative development projects trigger the displacement of illicit cultivation from the area targeted by alternative development to other geographical areas: households may migrate to other areas in order to continue illicit cultivation, or other households may start illicit cultivation to fill the supply gap triggered by the alternative development intervention.
From the point of view of alternative development projects, which are local in nature, the balloon effect caused by this type of displacement is not necessarily a sign of failure. But from a broader national perspective, it can be argued that the balloon effect reduces the effectiveness of alternative development, at least in the short term, as the long-term benefits in terms of creating a new institutional and developmental paradigm may not yet be visible.
Balloon, or displacement, effects have been observed at different levels. For example, the displacement of illegal cultivation to other subnational locations and/or other countries, or the replacement of illicit cultivation with other illegal activities. As when successful law enforcement operations hinder trafficking routes, which may force traffickers to switch to new routes, success in alternative development projects is bound to trigger a certain degree of displacement to areas not targeted by such projects, as long as the conditions that enable illicit cultivation are not addressed in broader geographical terms (whether at the national level or the regional level) and the root causes of illicit cultivation, such as poor developmental infrastructure, governance and rule of law, are not comprehensively tackled.
Broadening the set of indicators used to measure success in alternative development
In the Political Declaration and Plan of Action on International Cooperation towards an Integrated and Balanced Strategy to Counter the World Drug Problem, it is stated that Member States with the necessary expertise should assist affected States in designing and improving systems to monitor and assess the qualitative and quantitative impact of alternative development with respect to the sus-tainability of illicit crop reduction and socioeconomic development, and that such assessment should include the use of human development indicators that reflect the Millennium Development Goals (paragraph 43 (d) of the Plan ofAction). In paragraph 45 (d) of that text, it is recognized that "poverty and vulnerability are some of the factors behind illicit drug cultivation and that poverty eradication is a principal objective of the Millennium Development Goals". Similarly, in the United Nations Guiding Principles on Alternative Development, the coupling of human development and crop reduction indicators to measure the success of alternative development efforts is suggested. In paragraph 18 (v) of the Guiding Principles, Member States, international and regional organizations, development agencies, donors, international financial institutions and civil society are asked to "apply, in addition to estimates of illicit cultivation and other illicit activities related to the world drug problem, indicators related to human development, socioeconomic conditions, rural development and the alleviation of poverty, as well as institutional and environmental indicators, when assessing alternative development programmes in order to ensure that the outcomes are in line with national and international development objectives, including the Millennium Development Goals". The extent to which such broader human development indicators have been used to assess the success of alternative development varies.
NEXUS BETWEEN ILLEGAL MINING AND COCA CULTIVATION IN SAN GABAN, PERU Illicit coca cultivation has made a steady comeback in the District of San Gaban, in the Peruvian Region of Puno, since a substantial eradication campaign in 2004 and 2005, with a 7.36 per cent increase in coca cultivation between 2011 and 2013.� The expectations at that time were that there would be a significantly greater increase in illicit cultivation, predominantly because of its location on the so-called "inter-oceanic highway", which links Peru with Brazil. Interestingly, however, it was illegal mining, which has been booming in San Gaban since 2012, that provided competition for labour and prevented illicit coca cultivation from increasing further.
In 2013, satellite images were used to investigate the links between illegal gold mining and illicit coca cultivation. While illegal mining increased by 100 per cent between 2012 and 2013 (from 500 to 1,000 ha) on both sides of the Inambari river, illicit cultivation remained relatively stable over the same period. Moreover, it was found that part of the illicit coca cultivation had been replaced by illegal mining, creating substantial direct competition for scarce labour.b While coca cultivation pays about $6 per day, illegal mining pays roughly $13.c
The example of San Gaban shows that alternative development interventions in such areas would have to address the opportunities and vulnerability of communities to engage in all types of illicit activities.
Illegal mining (shown in red; 2005)
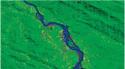
Click to enlargeIllegal mining (shown in red; 2013)
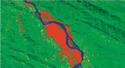
Click to enlarge
� UNODC and Government of Peru, Perú: Monitoreo de Cultivos de Coca 2012 (September 2013), p. 16.
b UNODC and Government of Peru, Perú: Monitoreo de Cultivos de Coca 2013 (June 2014), p. 21.
c Ibid, p. 49.
Based on their experiences, alternative development experts identified, in an alternative development expert questionnaire administered by UNODC, three essential indicators for measuring the success of alternative development interventions. |146| The most mentioned indicators were: (a) the generation of alternative income from licit activities; (b) strengthened community or producer organizations; and (c) the reduction of illicit crop cultivation. These indicators were mentioned in combination with indicators related to human development, social capital, institutional capacity and political and financial commitment, among others. Indeed, project evaluation documents demonstrate that a multitude of indicators have been used to measure the success of alternative development interventions. But, with the exception of "the area under illicit crop cultivation", which is often still used as the main success indicator, the others tend to differ substantially from project to project, so the final results are not easily comparable across projects or countries.
ALTERNATIVE DEVELOPMENT AND REDUCTION IN NATIONAL ILLICIT CULTIVATION Thailand
Opium poppy cultivation in Thailand (in hectares), 1961-2013 and gross domestic product index (1965=100) in Thailand and globally, based on constant United States dollars
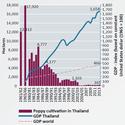
Click to enlargeSources: Ronald D. Renard, Opium reduction in Thailand 19702000: a Thirty-year Journey (Chiang Mai, Thailand, Silkworm Books, 2001) (for data for the period 1961-1984); UNODC, Southeast Asia Opium Survey 2013 and previous years (for data for the period 1984-2013) and World Bank, Data, Indicators, GDP (constant 2005 US$).
The area under opium poppy cultivation in Thailand increased from around 300 ha in 1917 to some 12,100 ha by 1961-1962. Despite eradication efforts, cultivation increased further in northern Thailand in the initial years of the Viet Nam war, to some 17,900 ha by 1965-1966.� The upward trend in opium production ended with the implementation of alternative development efforts by the authorities of Thailand, starting in the second half of the 1960s (with, notably, the Royal Project in 1969, followed by the Doi Tung Development Project) and gaining in intensity as of the early 1970s, when those efforts were also assisted by the international community, including bilateral donors and the United Nations. The first phase, in the 1970s, focused on cash-crop substitution, the second phase, in the 1980s, on integrated rural development and the third phase, in the 1990s and subsequent years, on community development and the active participation of the hill tribes concerned. The use of alternative development, supported by eradication efforts (which for several years concerned more than half of the area under poppy cultivation), as well as the successful economic development of Thailand as a whole, helped to reduce the area under opium poppy cultivation in Thailand by almost 99 per cent, from 17,900 ha during the period 1965-1966b to 265 ha in 2013.c Successful economic development, with an average annual growth of GDP of 6 per cent per year during the period 19652013 (compared with a global average of 3.3 per cent),d helped the hill tribes to benefit from the overall progress made and provided them with alternative sources of income. Importantly, the exceptional leadership provided by King Bhumibol and the late Princess Srinagarindra, who initiated the Royal Project and the Doi Tung Development Project, respectively, in northern Thailand, built trust among the ethnic hill tribe communities, convincing them to shift to a new, legal economy.
Pakistan
Alternative development also appears to have played a crucial role in reducing opium poppy cultivation in Pakistan, particularly in Dir District, located in the Northwest Frontier Province (now Khyber Pakhtunkhwa). Opium poppy cultivation in Pakistan, which had increased in the 1970s, declined thereafter by almost 99 per cent, from a peak of some 80,500 acres (32,600 ha) during the period 1978-1979 to 493 ha in 2013. Within this smooth overall trend there were different dynamics at the subnational level. Following successes in reducing the area under poppy cultivation in Buner District, which was linked to investment into crop substitution during the period 19761987, opium poppy cultivation shifted to the adjoining Malakand Agency and the Gadoon Amazai area and, following successful alternative development efforts in these regions, it shifted to Dir District. In 1978-1979, the area under opium poppy cultivation in the (then) North-West Frontier Province accounted for more than 60 per cent of the total area under poppy cultivation in Pakistan, and Dir District alone accounted for 50 per cent of total opium production in 1985.
Area under coca cultivation in Colombia; eradication and villages covered by alternative development, 2000-2013
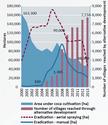
Click to enlargeSources: UNODC and Government of Colombia, Colombia: Monitoreo de Cultivos de Coca 2013 (and previous years) and UNODC, World Drug Report 2014 (and previous years).
By 1999, following some 15 years of heavy investment into alternative development, opium poppy cultivation in Dir District had largely disappeared, and there were no indications of a significant revival of the opium sector in subsequent years. In a field study conducted in 2000 to assess the impact of the Dir District Development Project, it was suggested that the government of the NorthWest Frontier Province, with the assistance of UNDCP and through the implementation of the Dir District Development Project, had generally succeeded in curbing the cultivation of poppy in the project area. In accomplishing the primary objective (eradication of poppy cultivation), the effective government enforcement "stick" was the overriding factor, while the "carrot" of development interventions had acted as a catalyst to the process. According to the study, farmers felt that, generally, the project interventions had had a positive impact. The construction and the improvement of roads had improved accessibility to social services and had reduced the distance to market of farm inputs, agricultural output and other consumable commodities. The introduction of high-value crops, higher production packages and improved animal breeds, improvements in irrigation-related infrastructure and the introduction of rotational grazing had improved farm productivity. Similarly, provision of drinking water supply infrastructure and an effective immunization programme had had a positive impact on the quality of life.
Colombia
Alternative development also appears to have played a role in the decline in the area under coca cultivation in Colombia, which amounted to 71 per cent during the period 2000-2013. Most of the decline in the initial years can be linked to eradication efforts, but in recent years the extent of eradication has fallen. Nonetheless, cultivation has continued to decline, and the number of villages covered by alternative development quintupled during the period 2007-2013, from 1,365 to 7,734. Those villages were located in 361 municipalities across the country. This points towards alternative development as having played a tangible role in the further reduction of the area under coca cultivation, particularly during the period 2007-2013, when it declined by 52 per cent.
� Renard, Opium Reduction in Thailand 1970-2000.
b Ibid.
c UNODC, Southeast Asia Opium Survey 2013.
d World Bank, Data, Indicators, GDP (constant 2005 United States dollars), available at http://data.worldbank.org/indicator/NY.GDP.MKTP.KD.
In the San Martin Region of Peru, alternative development interventions succeeded in increasing the area under licit agricultural cultivation by 80 per cent, from 252,000 ha in 2001 to 454,000 ha in 2010, which helped San Martin to emerge as the largest producer of oil palm (79 per cent of national production), cacao (33 per cent) and rice (19 per cent), the second-largest producer of bananas and papayas, and the third-largest producing region of coffee (19 per cent) in Peru in 2010. In 2010, the region showed the best economic and social indicators in Peru, including the greatest reduction in poverty: during the period 20012010, poverty decreased from 70 per cent to 31 per cent, a reduction of more than half. |147|
The main effects of the Thai-German Highland Development Programme (1981-1998) on households included increased access to education, health services and potable water, with a resulting decline in water-borne infections and diseases such as malaria and smallpox. In addition, new cash crops and a growing agricultural economy in the north doubled or even tripled many household incomes.
Alternative development projects in Wa Special Region 2 of Myanmar resulted in gains on the health front: children under 3 years of age were vaccinated, thus reducing infant mortality, and leprosy, which had previously been three to four times higher than the average rate in Myanmar, was eliminated. Also as a result of the projects, electricity was brought to one township, 10 primary and 2 middle schools were built and potable water was brought to two townships.
The success indicators used in the Phongsaly alternative livelihood and food security project in the Lao People's Democratic Republic included the creation of a stable food security situation in target households through the introduction of improved agricultural development linked to markets, increased productivity in the cultivation of licit crops by former opium-growing families, the establishment of reliable social and economic support services and improved project management to empower local participation. |148|
In Thailand, the Mae Fah Luang Foundation under Royal Patronage has taken the assessment of the success of alternative development some steps further by evaluating its projects based on long-term, "people-centred" human development, socioeconomic and environmental indicators, including per-capita income, education level and environmental regeneration.
Efforts have been undertaken to consolidate the set of indicators that can monitor the impact of alternative development into a unique summary measure. In Colombia, a set of indicators was developed and then combined into an overall composite índice de consolidación (consolidation index) to measure the success of the National Policy for Consolidation and Territorial Reconstruction. This policy includes alternative development programmes that go beyond mere crop substitution or provision of alternative livelihoods and include a broad range of state-building interventions in areas which, due to insurgency, drug trafficking and large-scale illicit crop cultivation, were, until recently, beyond Government control.
The development of such a consolidation index appears to have gone back to suggestions made in the evaluation of Plan Colombia, |149| in which the authors proposed developing a multi-year composite index to measure the success of alternative development that should include the following: (a) the number of hectares cultivated with illicit crops; (b) the number of hectares eradicated; (c) the number of municipalities free from illicit crop cultivation; (d) the percentage of the size of the illicit economy per GDP and per the size of the economy in every subnational region; (e) human development indicators of illicit crop farmers and populations vulnerable to illicit crop cultivation (such as level of income per family, levels of literacy and life expectancy); and (f) the availability to illicit crop farmers of comprehensive licit livelihoods resources necessary for legal livelihoods (technical assistance to grow legal crops, irrigation systems, seeds, microcredit, roads that lead to markets, appropriate participation in production value chains, community access to schools, health clinics, etc.).
FIG. 81. Results from alternative development interventions measured in terms of the consolidation index in key areas where alternative development activities took place in Colombia, 2011-2013
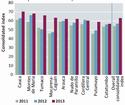
Click to enlargeSource: Colombia, Department for Social Prosperity, Administrative Unit for Territorial Consolidation.
The consolidation index is used to measure, among other issues, some of the basic elements of alternative development derived from sub-indices describing: (a) the institutionalization of the territory; (b) citizen participation and good governance; and (c) regional integration. These areas were identified by the authorities as the policy's main pillars for the reconstruction of territories that were previously under the influence of groups involved in large-scale illicit crop cultivation, drug manufacture, drug trafficking and insurgency.
Irrespective of ongoing differences in the various regions, the results emerging from the approach of Colombia show clear improvements in all of the main regions where alternative development interventions took place during the period 2011-2013 (see figure 5). The overall positive outcome, however, should not mask the fact that the situation did not improve across the board. Some areas, such as the Department of Putumayo, improved in some areas (e.g. justice and human rights), while suffering declines in others (e.g. connectivity to rural centres and the provision of social services). The consolidation index was used to measure the scope of the National Policy for Consolidation and Territorial Reconstruction in 58 municipalities. A detailed analysis of this kind across regions provides policymakers with highly relevant information on the successes and failures of alternative development interventions and can help to fine-tune interventions and government responses.
Drug control may be one of the objectives of alternative development, but it is certainly not the only one. When viewed holistically, alternative development is meant to be part of a nationwide strategy for poverty elimination. The discussion in this chapter has shown how alternative development, within this broader meaning, has contributed to economic development (mostly in rural areas) in order to target the underlying factors and root causes of illicit drug economies. The new Sustainable Development Goals (the post-2015 development agenda) could bring a new vision and provide alternative development with a new theoretical framework, adding to socioeconomic development — its "traditional" pillar. New elements such as the rule of law and the development of "effective, accountable and inclusive institutions", as described in Goal 16 in the report of the Open Working Group of the General Assembly on Sustainable Development Goals, |150| are, in part, already addressed by alternative development. These elements have been more prominently recognized as part of sustainable development in the Sustainable Development Goals. This section discusses alternative development in the context of this broader vision of development by highlighting some of its key elements.
Impact of illicit drug production and alternative development interventions
At the national level, the income made by farmers from selling narcotic crops is not substantial in relation to overall national economies: the total farm-gate income from illicit opium and coca production amounted to some $2.6 billion in the six main opium and coca-producing countries (Afghanistan, Bolivia (Plurinational State of), Colombia, Lao People's Democratic Republic, Myanmar and Peru) in 2013, ranging from less than 0.2 per cent of GDP in Colombia to about 0.9 per cent in the Plurinational State of Bolivia, 1 per cent in Myanmar and 4 per cent in Afghanistan. The economic value of illicit crop cultivation can, however, be far more significant for communities living in the main opium-producing and coca-producing areas than at the national level. For example, the Province of Helmand in Afghanistan holds just 3.4 per cent of the country's total population but accounts for close to 50 per cent of the total area under opium poppy cultivation in Afghanistan. About 27 per cent of the total agricultural area in Helmand was under opium poppy cultivation in 2013 and the farm-gate value of opium production there may have reached more than one third of the province's licit GDP. |151|
FIG. 82. Impact of illicit drug production and of alternative development interventions
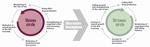
Click to enlargeSource: UNODC.
In general, the economic development of rural communities affected by the illicit cultivation of crops depends heavily on illicit sources that do not foster a "healthy" process of economic development. In the long run, areas where large-scale illicit crop cultivation takes place tend to perform less well than other areas as they are often deprived of productive private and public investment, often because of high levels of insecurity. Thus, the International Narcotics Control Board, reviewing the relationship between illicit drugs and development, pointed out that there was a negative correlation between illicit drug production and the economic growth of a country. |152| The World Bank reported that in Afghanistan "opium is becoming 'capitalized' in the economy and society, affecting agricultural sharecropping and tenancy arrangements, land prices, urban real estate, bride prices in opium-producing areas, etc." and that "this entrenchment of the opium economy and long-term dependence on it will discourage the sustainable development of other economic activities. For example, with rents and sharecropping arrangements increasingly based on opium in many rural areas of the country, it becomes virtually impossible for other cash-earning agricultural activities to take hold." |153|
All of this impacts on the growth of the licit economy and thus on the living conditions of farmers residing in illicit crop cultivating areas, where they are trapped in a vicious cycle. Illicit cultivation provides them with the necessary short-term economic means to survive but it does not allow the area to develop its licit economy and institutional environment. Alternative development can break this vicious cycle if it effectively addresses the factors hindering a sustainable licit economy, which in the long run can attract investment and help to develop the necessary infrastructure, thus changing and sustaining the livelihood of rural communities (see figure 6).
From Millennium Development Goals to Sustainable Development Goals
The link between alternative development and the Millennium Development Goals was made explicit in the Political Declaration and Plan of Action on International Cooperation towards an Integrated and Balanced Strategy to Counter the World Drug Problem, in which it is stated that Member States should "tackle alternative development in a larger development context through a holistic and integrated approach, taking into account the Millennium Development Goals, with the priority of eradicating poverty" (paragraph 47 (a) of the Plan of Action).
The proposed Sustainable Development Goals are much broader in scope and do not only cover socioeconomic development (which was the primary focus of the Millennium Development Goals); they also recognize a broader dimension of development, which encompasses the environment, participatory and representative decision-making, security and the rule of law. |154|
In the discussions on the post-2015 development agenda there is recognition that illicit markets are a great constraint to sustainable development. In its report, the High-Level Panel of Eminent Persons on the Post-2015 Development Agenda recommended that Member States and the international community "stem the external stress-ors that lead to conflict, including those related to organized crime". |155| It called upon Member States to pay greater attention to reducing risks and improving outcomes by strengthening the licit sector and focusing on areas where illicit sectors pose significant risks to development and governance outcomes. |156| Similarly, in its report, |157| the Open Working Group of the General Assembly on Sustainable Development Goals recognized that the illicit sector is an element to be addressed in the context of the post-2015 development agenda and included, within Goal 16, the target of significantly reducing illicit financial and arms flows, strengthening the recovery and return of stolen assets and combating all forms of organized crime by 2030. In the synthesis report on the post-2015 sustainable development agenda entitled "The road to dignity by 2030: ending poverty, transforming all lives and protecting the planet", the Secretary-General also highlighted that "providing an enabling environment to build inclusive and peaceful societies, ensure social cohesion and respect for the rule of law will require rebuilding institutions at the country level to ensure that the gains from peace are not reversed." |158|
Alternative development within the framework of land governance
As discussed in section F above, the granting and/or enforcement of individual and collective land titles has proved a successful alternative development strategy. Experts have stressed the need for a clear legal framework in which alternative development interventions incorporate proper land tenure rights. |159| The Voluntary Guidelines on the Responsible Governance of Tenure of Land, Fisheries and Forests in the Context of National Food Security of the Food and Agriculture Organization of the United Nations provide an interesting set of recommendations on how to improve land governance with the overarching objective of achieving food security. Directly linked to efforts to eradicate hunger and poverty, the promotion of secure tenure rights and equitable access to land, fisheries and forests is also very relevant for the planning and implementation of alternative development programmes.
Alternative development within the international trade regime
In section F above, issues related to market access are discussed, notably the requests made at the international level to increase the market access of alternative development products. In the context of the international trade regime, governed by the World Trade Organization (WTO), which determines what States are permitted to do in terms of market intervention and market support, the role of alternative development subsidies was not specifically considered, but some agreements granted preferential treatment to illicit drug-producing countries. One could argue that the limited size and scope of most alternative development projects would hardly distort international markets in any way, but the objective at the heart of many alternative development projects is, nevertheless, to ultimately be competitive in international markets. The question remains as to whether the latter objective requires free market access or preferential trade agreements that distinguish "alternative" from "regular" products and if alternative development products should receive preferential treatment.
Within the international trade regime, bilateral or multilateral trade agreements have been established to assist farmers in some of the illicit drug-producing countries. The Andean Trade Preference Act provided duty-free treatment for a wide range of export products from Bolivia (Plurinational State of), Colombia, Ecuador and Peru with access to the United States market. The Act was amended in October 2002 by the Andean Trade Promotion and Drug Eradication Act. Intended to open up new markets, support crop substitution and generate viable alternatives to illicit cultivation, the Act targeted countries with illicit drug production, although it was not directly related to alternative development products. Indeed, some of the products of Andean farmers were not included in the act. The act expired in February 2011 but was extended until 31 July 2013 and has not been extended since. Both Colombia and Peru signed bilateral free trade agreements with the United States.
In 1990, the four countries of the Andean Community (Bolivia (Plurinational State of), Colombia, Ecuador and Peru) were granted special arrangements under the European Union's Generalised Scheme of Preferences to combat drug production and trafficking. Later, the special arrangements were extended to a few other countries. |160| |161|
While it provides some illicit drug-producing countries with access to Europe's internal market for a range of agricultural and industrial products, trade support is generally not directly related to alternative development or the (potential) export of alternative development products (similar to the Andean Trade Preference Act and the Andean Trade Promotion and Drug Eradication Act). But by including products such as coffee, beneficiaries of alternative development programmes could potentially benefit. Similarly to the bilateral trade relationship with the United States, the European Union has also agreed bilateral free trade agreements with a number of countries, which could make the Generalised Scheme of Preferences system irrelevant in the future.
The Generalised Scheme of Preferences was changed in 2005 after a WTO legal case in 2002. |162| The WTO ruled that tariff advantages under the Special Arrangements to Combat Drug Production and Trafficking were inconsistent with article I.1 of the General Agreement on Tariffs and Trade, on general most-favoured-nation treatment. This meant that the European Union could not grant preferential treatment to illicit drug-producing countries, unless it granted the same treatment to other Generalised Scheme of Preferences beneficiaries with similar "development, financial and trade needs". |163| According to WTO, this could have been avoided if the preferential treatment of the Generalised Scheme of Preferences had included objective criteria to allow other developing countries that are similarly affected by the drug problem to be included as beneficiaries of the scheme. |164| The 2005 WTO ruling has further limited the possibilities for giving special market treatment to countries affected by illicit drug cultivation.
Alternative development and environmental protection
As illicit cultivation often takes place in national parks, protected forests or protected territories, it can put pressure on, or move, the agricultural frontier. Although alternative development is not generally possible within protected areas (except for livelihoods related to the protection of such areas), the reach of alternative development programmes can include both the area where agricultural or agroforestry activities take place and the area beyond the agricultural frontier. This could be done through general forest protection policies, implemented by the ministries in charge of environmental policies, reinforcing the notion that alternative development is embedded into broader sustainable development and environmental policies. Alternative development can also be implemented in areas adjacent to illicit cultivation areas, which could encourage farmers to move, as well as reduce pressure on protected areas.
In taking such a holistic approach, there will always be compromises to be made in alternative development between boosting rural development (providing jobs and income through alternative livelihoods) and the protection of the environment and biodiversity in an area affected (or threatened to be affected) by illicit crop cultivation or by the crops or livelihoods chosen to replace them.
The analysis presented in the present chapter shows that the international definition of alternative development agreed at the twentieth special session of the General Assembly, held in 1998, is still valid today. Yet alternative development is in a constant state of flux and its success is a result of the piloting of new and often more sophisticated approaches by Member States. National alternative development strategies vary considerably, but almost all address food security and quality of life in terms of broader socioeconomic indicators, in line with the general evolution from the limited crop substitution approach of the 1960s and 1970s to the comprehensive, multifaceted approach of today.
Success in alternative development is still viewed in the context of reducing illicit cultivation, but the impact of programmes is now more broadly assessed, in terms of the eradication of extreme poverty and in terms of human development, gender equality and women's empowerment, and environmental sustainability. The United Nations Guiding Principles on Alternative Development have pushed the international agenda further, emphasizing a multidimensional approach and the need to focus on improving land governance, strengthening the justice and security sectors, promoting human development and protecting the environment. Some countries are already addressing these issues and experimenting with new approaches.
The Sustainable Development Goals, as proposed by the Open Working Group of the General Assembly on Sustainable Development Goals, could provide the framework for developing such initiatives further and provide a new impetus for alternative development, adding elements of rule of law and governance to the "traditional" pillars of socioeconomic development. Experiences in Afghanistan, Colombia and Peru have shown that minimum levels of rule of law and of security need to be established for sustainable results in alternative development to be achieved.
The Sustainable Development Goals point to the crucial role of environmental protection. This underlines the importance of continuing to develop new alternative development approaches to environmental conservation and protection, such as linking sustainable agricultural production at the local level to the international market for carbon credits. To fully embrace environmental protection, alternative development needs to be embedded into broader sustainable development and environmental policies that enable a compromise to be made between rural development and the protection of the environment and biodiversity. The Sustainable Development Goals could also provide the framework for linking land tenure more firmly with alternative development. The granting and/or enforcement of individual and collective land titles has proved a successful strategy in a number of alternative development projects and the Sustainable Development Goals recognize that secure and equitable rights to land and natural resources are central to the achievement of sustainable development.
Much of the innovation in improving the effectiveness of alternative development programmes is done at the local level, and a process of connecting "local to global" is currently taking place, in which best practices and lessons learned from local experiences within national strategies are exchanged. This reinforces other efforts by UNODC, the Commission on Narcotic Drugs and other entities to further foster South-South cooperation.
More than 40 years of alternative development experience have led to the conclusion that alternative development works when it has a long-term vision, adequate funding and the political support to integrate it into a broader development agenda. As the present chapter has shown, sustainable results in reducing illicit cultivation in different communities around the world can be obtained when the socioeconomic development of communities and the livelihood of rural households are improved.
Despite the amount of attention given to alternative development at the international level, there is a disconnect between international rhetoric and funding. Alternative development features prominently in documents of the Commission on Narcotic Drugs and the special sessions of the General Assembly on the world drug problem, but the funding for it has decreased considerably in the last few years. The twentieth special session of the General Assembly in 1998 triggered renewed impetus in funding alternative development in the spirit of "shared responsibility", but overall gross disbursements of alternative development funds from OECD countries have declined by 71 per cent since the adoption of the 2009 Political Declaration and Plan of Action on International Cooperation towards an Integrated and Balanced Strategy to Counter the World Drug Problem. In 2013, these disbursements accounted for just 0.1 per cent of global development assistance. By contrast, investment by national authorities, particularly in Bolivia (Plurinational State of), Colombia and Peru has increased over the last few years, often compensating for decreased donor support. Alternative development continues to focus on illicit cultivation of the coca bush and opium poppy, and although countries have expressed an interest in engaging in alternative development to combat the illicit cultivation of cannabis, current programmes targeting cannabis are very limited, despite its widespread illicit cultivation.
Market access for alternative development products is essential, and free trade agreements may have an impact on the marketing of alternative development products. Support for development-oriented supply reduction policies often takes the form of subsidies, which, although they may constitute a negligible part of overall trade, may not be in line with the obligation to prevent trade distortions.
As demonstrated by different national experiences, there seem to be opportunities for the alternative development approach to be extended beyond the context of illicit drug cultivation into other illegal markets. Alternative development could support communities affected, for example, by illegal mining, wildlife and forest crimes, and drug trafficking. This broadening of alternative development could go well beyond the already existing preventive alternative development strategy, which targets areas at risk of becoming illicit crop production areas.
[Source: United Nations Office on Drugs and Crime - UNODC, Vienna, May15]
ANNEX I
TABLESCannabis
Cannabis cultivation, production and eradication, 2013
Country Cultivated (ha) Eradicated (ha) Harvestable (ha) Yield (kg/ha) Production (tons) Plants eradicated Sites eradicated Algeria 4,831.00 1,400 Armenia 1.10 2.20 0.00 50 Austria 2.00 2.00 0.00 Azerbaijan 23.95 23.95 0.00 649.89 308 8,469 151 Belgium 575.00 396,758 1,212 Bosnia and Herzegovina 185 4,288 Brazil 37.84 900,744 Bulgaria 5.00 5.00 0.00 17,479 130 Colombia 326.00 Costa Rica 8.74 8.74 0.00 1,461,747 199 Czech Republic 73,639 276 Ecuador 3,816 28 Egypt 20.00 12,166 El Salvador 1.00 1.00 0.00 38,000 1,634 53 Germany 107,776 Greece 23,008 Hungary 100.00 Iceland 6,652 323 Ireland 28,851 391 Italy 894,874 1,722 Latvia 14,579 18 Lithuania 5 Malta 27 Mexico 5,364.16 1,200.00 Mongolia 15,000.00 4,000.00 11,000.00 4,000 4,000 Morocco 47,196.00 5,000.00 42,196.00 812.87 New Zealand 126,523 783 Nigeria 850.00 847.46 2.54 Panama 10.50 10.50 0.00 78,670 4 Philippines 51.55 2,013,678 451 Poland 1.80 69,285 13 Russian Federation 5.40 7,047.00 1,974 Sierra Leone 190.00 190.00 190 3 Trinidad and Tobago 10.28 10.28 0.00 500.00 597,100 117 Ukraine 166.90 483,000 Uzbekistan 0.40 0.40 0.00 613 Viet Nam 1.00 Supply indicators
Region HEROIN CANNABIS COCAINE Seizures in 2012-2013 (percentage of global total) Changes in seizures from 2004-2008 to 2009-2013 (percentage) Seizures in 2012-2013 (percentage of global total) Changes in seizures from 2004-2008 to 2009-2013 (percentage) Seizures in 2012-2013 (percentage of global total) Changes in seizures from 2004-2008 to 2009-2013 (percentage) Africa 0.4 64.8 9.30 -49.50 0.30 -19.20 North America 8.2 110.3 56.00 14.10 11.20 -46.70 Latin America and the Caribbean 1.2 -16.5 24.00 21.70 78.80 16.60 Central Asia and Transcaucasian countries 2.1 -50.9 0.50 -19.70 0.00 -80.10 East and South-East Asia 13.6 1.1 3.20 250.70 0.12 123.90 Near and Middle East/South-West Asia 42.7 77.3 1.90 22.10 0.13 190.50 South Asia 2.1 -0.2 0.40 0.70 0.01 -31.40 Eastern Europe 3.3 -31.3 0.90 5.60 0.00 129.60 South-Eastern Europe 18.8 2.4 3.50 37.00 0.10 134.40 Western and Central Europe 6.5 -27.3 0.10 16.40 9.10 -31.60 Oceania 1.0 547.6 0.10 39.80 0.20 203.80 Cocaine
Global illicit cultivation of coca bush, 2002-2013 (hectares)
2002 2003 2004 2005 2006 2007 2008 2009 2010 2011 2012 2013 Bolivia (Plurinational State of) 24,400 23,600 27,700 25,400 27,500 28,900 30,500 30,900 31,000 27,200 25,300 23,000 Colombia� 102,000 86,000 80,000 86,000 78,000 99,000 81,000 73,000 62,000 64,000 48,000 48,000 Perub 62,500 60,400 49,800 Peruc 46,700 44,200 50,300 48,200 51,400 53,700 56,100 59,900 61,200 64,400 Total 173,100 153,800 158,000 159,600 156,900 181,600 167,600 163,800 154,200 155,600d 133,700 120,800 Source: Bolivia (Plurinational State of): 2002: CICAD and United States Department of State, INCSR; since 2003: national illicit crop monitoring system supported by UNODC. Colombia: National Illicit Crop Monitoring System supported by UNODC. Peru: national illicit crop monitoring system supported by UNODC."
"Note: An account of different area concepts and their effect on comparability was presented in the World Drug Report 2012 (p. 41-42). Efforts continue to improve the comparability of estimates between countries: since 2011, the net area under coca bush cultivation at the reference date of 31 December has been estimated for Peru, following the same concept used for the Colombia estimations. The estimate presented for the Bolivia (Plurinational State of ) represents the area under coca cultivation as seen on satellite imagery.� Net area on 31 December. Estimates from 2009 on were adjusted for small fields while estimates for previous years did not require such an adjustment.
b Net area on 31 December.
c Area as interpreted from satellite imagery.
d The global coca cultivation figure in 2011 was calculated with the "area as interpreted from satellite imagery" for Peru.
Potential production of sun-dried coca leaf, 2005-2013 (tons)
2005 2006 2007 2008 2009 2010 2011 2012 2013 Bolivia (Plurinational state of) 28,200 33,200 36,400 39,400 40,100 40,900 33,500 30,400 24,300 Range 34,200-
38,30037,300-
41,80037,900-
42,30038,600-
43,10031,900-
35,40028,900-
31,90020,600-
28,400Peru 97,000 105,100 107,800 113,300 119,000 120,500 126,100 119,700 112,200 Range 85,400-
108,60091,000-
119,20093,200-
122,00097,600-
127,800102,400-
134,200103,000-
136,300110,300-
142,100103,300-
136,100102,180-
123,180
Sources: For Bolivia (Plurinational State of) - Potential production of sun-dried coca leaf available for cocaine production was estimated by the national illicit crop monitoring system supported by UNODC. Source of estimates for leaf yield is UNODC for Yungas de la Paz, and United States Drug Enforcement Administration (DEA) for Chapare (DEA scientific studies). The estimated amount of coca leaf produced on 12,000 hectares in the Yungas de la Paz, where coca cultivation is authorized under national law, was deducted (ranges: upper and lower bound of 95 per cent confidence interval of the estimated coca leaf yield). For Peru: Potential production of sun-dried coca leaf available for cocaine manufacture was estimated by the national illicit crop monitoring system supported by UNODC. A total of 9,000 tons of sun-dried coca leaf production was deducted, which, according to Government sources, was the amount used for traditional purposes (range: upper and lower bounds of the 95 per cent confidence interval of the estimated coca leaf yield.
Note: The estimates for 2011 and 2012 are not directly comparable; for a discussion of the different concepts, see World Drug Report 2012 (pp. 41-42). Estimates from 2012 onwards are comparable.Potential production of fresh coca leaf, 2005-2013 (tons)
2005 2006 2007 2008 2009 2010 2011 2012 2013 Colombia 555,400 528,300 525,300 389,600 376,700 334,900 281,800 241,400 208,200 Range 346,900-406,400 334,900-349,600 229,800-333,800 179,200-284,200 178,900-237,500 Potential production of fresh coca leaf in oven-dried weight, 2005-2013 (tons)
2005 2006 2007 2008 2009 2010 2011 2012 2013 Colombia 164,280 154,130 154,000 116,900 113,000 100,500 84,500 72,700 62,500 Range 100,500-104,88 Source: National illicit monitoring system supported by UNODC.
Notes: Owing to the introduction of an adjustment factor for fields that are productive for only part of the year, estimates since 2009 are not directly comparable with those of previous years.
Notes: Owing to the introduction of an adjustment factor for fields that are productive for only part of the year, estimates since 2009 are not directly comparable with those of previous years. The ranges express the uncertainty associated with the estimates. In the case of Bolivia (Plurinational State of) and Peru, the ranges are based on confidence intervals and the best estimate is the mid-point between the upper and lower bound of the range. In the case of Colombia, the range is estimated based on the area under coca cultivation in the two previous years. The methodology used to calculate uncertainty ranges for production estimates is still under development and figures may be revised when more information becomes available.Potential manufacture of 100 per cent pure cocaine, 2005-2013 (tons)
2005 2006 2007 2008 2009 2010 2011 2012 2013 Bolivia (Plurinational state of) 80 94 104 113 n.a. n.a. n.a. n.a. n.a. Colombia 680 660 630 450 488 424 384 333 290 Range 240-377 249-331 Peru 260 280 290 302 n.a. n.a. n.a. n.a. n.a. Total 1,020 1,034 1,024 865 842-1,111 788-1,060 776-1,051 714-973 662-902 Sources: For Bolivia (Plurinational State of): UNODC calculations based on coca leaf yield surveys by UNODC (Yungas de la Paz) and United States DEA scientific studies (Chapare). For Colombia: national illicit crop monitoring system supported by UNODC and DEA scientific studies. Owing to the introduction of an adjustment factor for fields that are productive for only part of the year, estimates since 2009 are not directly comparable with those previous years. For Peru: UNODC calculations based on a coca leaf to cocaine conversion ratio from DEA scientific studies.
Notes: Owing to the ongoing review of conversion factors, it has not been possible to provide a point estimate of the level of cocaine production since 2009. Detailed information on the ongoing revision of conversion ratios and cocaine laboratory efficiency is available in the World Drug Report 2010 (p. 249).Reported cumulative eradication of coca bush, 2005-2013 (hectares)
2005 2006 2007 2008 2009 2010 2011 2012 2013 Bolivia (Plurinational State of) manual 6,073 5,070 6,269 5,484 6,341 8,200 10,460 11,044 11,407 Colombia manual 37,523 41,346 66,392 96,003 60,565 43,804 35,201 30,487 22,127 spraying 138,775 172,026 153,134 133,496 104,771 101,939 103,302 100,549 47,053 Peru manual 7,605 9,153 10,188 11,102 10,091 12,239 10,290 14,235 23,947 Ecuador manual 18 9 12 12 6 3 14 .. .. Venezuela (Bolivarian Republic of) manual 40 0 0 0 0 .. .. .. .. Source: UNODC annual report questionnaire and database on estimates and long-term trend analysis (DELTA); Government of Bolivia (Plurinational State of), Colombia and Peru.
Totals for Bolivia (Plurinational State of) since 2006 include voluntary and forced eradication. Totals for Peru include voluntary and forced eradication.
Two dots indicate that data are not available. Cumulative eradication refers to the sum of all eradication in a year, including repeated eradication of the same fields.Opium/Heroin
Net cultivation of opium poppy in selected countries, 1999-2014 (hectares)
1999 2000 2001 2002 2003 2004 2005 2006 2007 2008 2009 2010 2011 2012 2013 2014 SOUTH-WEST ASIA Afghanistan 90,583 81,171 7,606 74,100 80,000 131,000 104,000 165,000 193,000 157,000 123,000 123,000 131,000 154,000 209,000 224,000 Pakistan 284 260 213 622 2,500 1,500 2,438 1,545 1,701 1,909 1,779 1,721 362 382 493 Subtotal 90,867 82,431 7,819 74,722 82,500 132,500 106,438 166,545 194,701 158,909 124,779 124,771 131,362 154,382 209,493 224,493 SOUTH-EAST ASIA Lao People's Democratic Republic� 22,543 19,052 17,255 14,000 12,000 6,600 1,800 2,500 1,500 1,600 1,900 3,000 4,100 6,800 3,900 6,200 Myanmar� 89,500 108,700 105,000 81,400 62,200 44,200 32,800 21,500 27,700 28,500 31,700 38,100 43,600 51,000 57,800 57,600 Thailandb 702 890 820 750 Viet Namb 442 Subtotal 113,187 128,642 123,075 96,150 74,200 50,800 34,600 24,000 29,200 30,100 33,600 41,100 47,700 57,800 61,700 63,800 LATIN AMERICA Colombia 6,500 6,500 4,300 4,153 4,026 3,950 1,950 1,023 715 394 356 341 338 313 298 Mexicoc 3,600 1,900 4,400 2,700 4,800 3,500 3,300 5,000 6,900 15,000 19,500 14,000 12,000 10,500 Subtotal 10,100 8,400 8,700 6,853 8,826 7,450 5,250 6,023 7,615 15,394 19,856 14,341 12,338 10,813 10,798 10,798 OTHER Other countriesd 2,050 2,479 2,500 2,500 3,074 5,190 5,212 4,432 4,184 8,600 7,700 10,500 16,100 11,900 13,300 11,800 TOTAL 216,204 221,952 142,094 180,225 168,600 195,940 151,500 201,000 235,700 213,000 185,935 190,662 207,500 234,895 295,291 310,891 Source: For Afghanistan: 1998-2002: UNODC; 2003-2012: National Illicit Crop Monitoring System supported by UNODC. For Pakistan: annual report questionnaire, Government of Pakistan, United States Department of State. For the Lao People's Democratic Republic: 1998-1999: UNODC; 2000-2012: National Illicit Crop Monitoring System supported by UNODC. For Myanmar: 1998-2000: United States Department of State; 2001-2012: National Illicit Crop Monitoring System supported by UNODC. For Colombia: 1998-1999: various sources; From 2000: National Illicit Crop Monitoring System supported by UNODC. For 2008-2012, production was calculated based on regional yield figures and conversion ratios from the United States Department of State/DEA. For Mexico: estimates derived from United States Government surveys.
Note: The opium production estimates for Afghanistan for 2006 to 2009 were revised after data quality checks revealed an overestimation of opium yield estimates in those years. Figures in italics are preliminary and may be revised when updated information becomes available. Information on estimation methodologies and definitions can be found in the methodology section of the online version of the present report.� May include areas that were eradicated after the date of the area survey. Figures for 2014 are not comparable to those for 2013 because two provinces were added to the survey and the survey took place at a different point during the crop cycle.
b Owing to continuing low cultivation, figures for Viet Nam (as of 2000) and Thailand (as of 2003) were included in the category "Other countries".
c The Government of Mexico does not validate the estimates provided by the United States, as they are not part of its official figures and it does not have information on the methodology used to calculate them. The Government of Mexico is in the process of implementing a monitoring system in collaboration with UNODC to estimate illicit cultivation and production.
d Eradication and plant seizure reports from different sources indicate that illicit opium poppy cultivation also exists in the following subregions: North Africa, Central Asia and Transcaucasia, Near and Middle East/South-West Asia, South Asia, East and South-East Asia, Eastern Europe, South-Eastern Europe, Central America and South America. Starting in 2008, a new methodology was introduced to estimate opium poppy cultivation and opium/heroin production in those countries. Those estimates are higher than the previous figures but have a similar order of magnitude. A detailed description of the estimation methodology is available in the online version of the present report.
Global potential production of oven-dry opium in selected countries, 1999-2014 (tons)
1999 2000 2001 2002 2003 2004 2005 2006 2007 2008 2009 2010 2011 2012 2013 2014 SOUTH-WEST ASIA Afghanistan 4,565 3,276 185 3,400 3,600 4,200 4,100 5,300 7,400 5,900 4,000 3,600 5,800 3,700 5,500 6,400 Pakistan 9 8 5 5 52 40 36 39 43 48 44 43 9 9 12 Subtotal 4,574 3,284 190 3,405 3,652 4,240 4,136 5,339 7,443 5,948 4,044 3,643 5,809 3,709 5,512 6,412 SOUTH-EAST ASIA Lao People's Democratic Republic� 124 167 134 112 120 43 14 20 9 10 11 18 25 41 23 92 Myanmar 895 1,087 1,097 828 810 370 312 315 460 410 330 580 610 690 870 670 Thailandb 8 6 6 9 Viet Namb 2 Subtotal 1,029 1,260 1,237 949 930 413 326 335 469 420 341 598 635 731 893 762 LATIN AMERICA Colombia 88 88 80 52 50 49 24 13 14 10 9 8 8 8 11 Mexicoc 43 21 91 58 101 73 71 108 150 325 425 300 250 175 162 Subtotal 131 109 171 110 151 122 95 121 164 335 434 308 258 183 173 173 OTHER Other countriesd 30 38 32 56 50 75 63 16 15 139 134 181 281 208 232 207 TOTAL 5,764 4,691 1,630 4,520 4,783 4,850 4,620 5,810 8,091 6,841 4,953 4,730 6,983 4,831 6,810 7,554 Sources: For Afghanistan: before 2003 - UNODC; for Afghanistan: since 2003 - national illicit crop monitoring system supported by UNODC. For Pakistan: annual report questionnaire, Government of Pakistan and United States Department of State. For the Lao People's Democratic Republic: before 2000 - UNODC; since 2000 - national illicit crop monitoring system supported by UNODC. For Myanmar: before 2001 - United States Department of State; for Myanmar: since 2001 - national illicit crop monitoring system supported by UNODC. For Colombia: before 2000 - various sources; for Colombia: since 2000 - national illicit crop monitoring system supported by UNODC, which started producing area estimates. Since 2008, production amounts for Colombia have been calculated based on regional yield figures and conversion ratios from the United States Department of State/Drug Enforcement Administration. For Mexico: before 2005 - estimates derived from United States Government surveys. For Mexico: since 2005 - INCSR for 2013 and INCSR for 2014. According to INCSR for 2013 (vol. I, p. 25), owing to a major methodological change in the 2011 survey, 2005-2010 estimates are indicative of trends only and overstate actual cultivation.
Note: The opium production estimates for Afghanistan for 2006 to 2009 were revised after data quality checks revealed an overestimation of opium yield estimates in those years. Figures in italics are preliminary and may be revised when updated information becomes available. Information on estimation methodologies and definitions can be found in the online methodological annex of the present report.� May include areas that were eradicated after the date of the area survey. Figures for 2014 are not comparable to those for 2013 because two provinces were added to the survey and the survey took place at a different point during the crop cycle.
b Owing to continuing low cultivation, figures for Viet Nam (as of 2000) and Thailand (as of 2003) were included in the category "Other countries".
c The Government of Mexico does not validate the estimates provided by the United States, as they are not part of its official figures and it does not have information on the methodology used to calculate them. The Government of Mexico is in the process of implementing a monitoring system in collaboration with UNODC to estimate illicit cultivation and production.
d Eradication and plant seizure reports from different sources indicate that illicit opium poppy cultivation also exists in the following subregions: North Africa, Central Asia and Transcaucasia, Near and Middle East/South-West Asia, South Asia, East and South-East Asia, Eastern Europe, South-Eastern Europe, Central America and South America. Starting in 2008, a new methodology was introduced to estimate opium poppy cultivation and opium/heroin production in those countries. Those estimates are higher than the previous figures but have a similar order of magnitude. A detailed description of the estimation methodology is available in the online version of the present report.
Global potential production of opium and manufacture of heroin of unknown purity, 2004-2014 (tons)
2004 2005 2006 2007 2008 2009 2010 2011 2012 2013 2014 Total potential opium production 4,850 4,620 5,810 8,091 6,841 4,953 4,730 6,983 4,831 6,810 7,554 Potential opium not processed into heroin 1,197 1,169 1,786 3,078 2,360 1,680 1,728 3,400 1,850 2,600 2,400 Potential opium processed into heroin 3,653 3,451 4,024 5,012 4,481 3,273 3,002 3,583 2,981 4,210 5,154 Total potential heroin manufacture 529 472 553 686 600 427 383 467 377 555 526 Notes: For Afghanistan, the proportion of potential opium production that was not converted into heroin within the country could only be estimated. For all other countries, for the purposes of the above table, it is assumed that all opium potentially produced was converted into heroin. If total potential opium production in Afghanistan in 2014 were to be converted into heroin, total potential heroin production would be 670 tons in Afghanistan and 788 tons globally. The estimates for 2006 to 2009 were revised owing to the revision of opium production figures for Afghanistan. The amount of heroin produced in Afghanistan is calculated using two parameters that may change each year: the distribution between opium that was not processed into heroin and opium that was processed into heroin; and the conversion ratio between opium and heroin. From 2004 to 2013 the conversion ratio used was 7:1; in 2014, it was modified to 9.6:1, based on recent results (see United Nations Office on Drugs and Crime, and Ministry of Counter Narcotics of Afghanistan, Afghan Opium Survey 2014). Up until 2013, global potential production of heroin of unkown purity was estimated without applying an estimated purity factor, but in 2014 a purity factor of 52 per cent was assumed and reflected in the estimate for Afghanistan. For this reason, an updated conversion ratio from opium to heroin of export quality (set at 52 per cent) was used for Afghanistan in 2014. Thus, the global total of estimated heroin of unknown purity produced includes a large proportion of heroin of export purity produced in Afghanistan. Recent reports point to higher purities on specific trafficking routes, which would have an inpact on the calculation if considered. Figures in italics are preliminary and may be revised when updated information becomes available.
Reported opium poppy eradication in selected countries, 2003 to 2014 (hectares)
2003 2004 2005 2006 2007 2008 2009 2010 2011 2012 2013 2014 Afghanistan 21,430 � 5,103 15,300 19,047 5,480 5,351 2,316 3,810 9,672 7,348 2,692 Algeria 2,721 Bangladesh 8 22 Colombia 3,266 3,866 2,121 1,929 375 381 546 711 299 319 514 Egypt 34 65 45 50 98 121 89 222 1 3 Guatemala 489 720 449 536 1,345 918 1,490 290 2,568 India 494 167 12 247 8,000 624 2,420 3,052 5,746 1,332 865 Lao People's Democratic Republic
4,134 3,556 2,575 1,518 779 575 651 579 662 707 397 Lebanon 4 67 27 8 21 4 Mexico 20,034 15,926 21,609 16,890 11,046 13,095 14,753 15,491 16,389 15,726 14,662 21,645 Myanmar 638 2,820 3,907 3,970 3,598 4,820 4,087 8,268 7,058 23,718 12,288 15,188 Nepal 19 4 1 21 35 Pakistan 4,185 5,200 391 354 614 0 105 68 1053 592 568 Peru 57 98 92 88 28 23 32 21 Thailand 767 122 110 153 220 285 201 278 208 205 264 Ukraine 28 436 39 Venezuela (Bolivarian Republic of) 0 87 154 0 0 0 Viet Nam 100 32 38 99 31 38 35 25 Sources: UNODC annual reports questionnaire, Government reports, reports of regional bodies, and the United States International Narcotics Control Strategy Report
Notes: In this table, only eradication reported in terms of area is considered. Eradication reported in terms of number of plant seizures can be found in the annex on seizures of the electronic version of the World Drug Report located at https://www.unodc.org/wdr/
� Although eradication took place in 2004, it was not officially reported to UNODC.
Annual prevalence of the use of cannabis, opioids and opiates, by region
Region or subregion Cannabis Opioids (opiates and prescription opioids) Opiates Number
(thousands)Prevalence
(percentage)Number
(thousands)Prevalence
(percentage)Number
(thousands)Prevalence
(percentage)Best estimate Lower Upper Best estimate Lower Upper Best estimate Lower Upper Best estimate Lower Upper Best estimate Lower Upper Best estimate Lower Upper Africa 45,800 20,380 59,120 7.5 3.3 9.7 1,980 920 3,230 0.3 0.2 0.5 1,880 940 2,340 0.3 0.2 0.4 East Africa 6,430 2,140 10,950 4.2 1.4 7.1 260 100 1,140 0.2 0.1 0.7 230 170 320 0.1 0.1 0.2 North Africa 5,710 2,900 8,830 4.3 2.2 6.6 330 130 530 0.2 0.1 0.4 330 130 530 0.2 0.1 0.4 Southern Africa 4,350 3,030 7,910 5.0 3.5 9.1 350 230 370 0.4 0.3 0.4 300 200 320 0.3 0.2 0.4 West and Central Africa 29,310 12,310 31,430 12.4 5.2 13.3 1,050 460 1,190 0.4 0.2 0.5 1,030 440 1,170 0.4 0.2 0.5 Americas 54,160 53,510 55,620 8.4 8.3 8.6 13,000 12,790 13,260 2.0 2.0 2.1 1,630 1,450 1,810 0.3 0.2 0.3 Caribbean 700 320 1,820 2.5 1.2 6.5 100 60 190 0.4 0.2 0.7 80 50 160 0.3 0.2 0.6 Central America 770 710 880 2.8 2.6 3.2 40 40 50 0.2 0.1 0.2 20 20 20 0.1 0.1 0.1 North America 36,660 36,470 36,870 11.6 11.5 11.6 12,010 11,870 12,160 3.8 3.7 3.8 1,420 1,280 1,500 0.4 0.4 0.5 South America 16,030 16,010 16,050 5.9 5.9 5.9 840 820 870 0.3 0.3 0.3 110 100 120 0.04 0.04 0.05 Asia 55,510 29,390 89,380 1.9 1.0 3.1 12,140 9,190 15,650 0.4 0.3 0.5 10,010 7,590 13,180 0.3 0.3 0.5 Central Asia 1,890 1,330 2,250 3.5 2.4 4.1 480 460 500 0.9 0.8 0.9 440 430 460 0.8 0.8 0.8 East and South-East Asia 10,220 5,960 23,550 0.6 0.4 1.5 3,390 2,550 4,760 0.2 0.2 0.3 3,360 2,520 4,720 0.2 0.2 0.3 Near and Middle East 9,610 5,590 13,520 3.4 2.0 4.8 5,330 3,970 6,720 1.9 1.4 2.4 3,390 2,460 4,550 1.2 0.9 1.6 South Asia 33,780 16,510 50,070 3.5 1.7 5.2 2,940 2,210 3,670 0.3 0.2 0.4 2,820 2,180 3,450 0.3 0.2 0.4 Europe 23,670 22,980 24,380 4.3 4.2 4.4 4,570 4,500 4,670 0.8 0.8 0.8 2,970 2,900 3,060 0.5 0.5 0.6 Eastern and South-Eastern Europe 5,270 4,650 5,920 2.3 2.0 2.6 3,100 3,090 3,120 1.4 1.3 1.4 1,860 1,850 1,870 0.8 0.8 0.8 Western and Central Europe 18,400 18,330 18,460 5.7 5.7 5.7 1,480 1,410 1,560 0.5 0.4 0.5 1,110 1,050 1,190 0.3 0.3 0.4 Oceania 2,650 2,220 3,570 10.7 9.0 14.5 730 590 750 2.9 2.4 3.0 30 40 60 0.1 0.2 0.2 Global estimate 181,790 128,480 232,070 3.9 2.7 4.9 32,420 27,990 37,560 0.7 0.6 0.8 16,530 12,920 20,460 0.4 0.3 0.4 Source: UNODC estimates based on annual report questionnaire data and other official sources.
Annual prevalence of the use of cocaine, amphetamines� and "ecstasy", by region
Region or subregion Cocaine Amphetamines and prescription stimulants "Ecstasy" Number
(thousands)Prevalence
(percentage)Number
(thousands)Prevalence
(percentage)Number
(thousands)Prevalence
(percentage)Best estimate Lower Upper Best estimate Lower Upper Best estimate Lower Upper Best estimate Lower Upper Best estimate Lower Upper Best estimate Lower Upper Africa 2,660 820 4,810 0.4 0.1 0.8 5,340 1,390 9,190 0.9 0.2 1.5 1,110 360 1,930 0.2 0.1 0.3 East Africa - - - - - - - - - - - - - - - - - - North Africa 30 30 40 0.02 0.02 0.03 750 260 1,240 0.6 0.2 0.9 - - - - - Southern Africa 650 170 740 0.7 0.2 0.9 620 300 840 0.7 0.3 1.0 260 140 310 0.3 0.2 0.4 West and Central Africa 1,640 560 2,500 0.7 0.2 1.1 - - - - - - - - - - - - Americas 8,970 8,720 9,260 1.4 1.4 1.4 6,110 5,830 6,500 1.0 0.9 1.0 3,220 2,970 3,540 0.5 0.5 0.6 Caribbean 180 60 340 0.6 0.2 1.2 220 20 520 0.8 0.1 1.9 50 10 160 0.2 0.04 0.6 Central America 170 160 180 0.6 0.6 0.6 230 230 240 0.8 0.8 0.9 30 30 30 0.1 0.1 0.1 North America 5,290 5,170 5,400 1.7 1.6 1.7 4,430 4,370 4,490 1.4 1.4 1.4 2,780 2,750 2,810 0.9 0.9 0.9 South America 3,340 3,330 3,350 1.2 1.2 1.2 1,230 1,220 1,250 0.5 0.4 0.5 360 180 540 0.1 0.1 0.2 Asia 1,340 430 2,250 0.05 0.02 0.08 19,550 4,240 34,860 0.7 0.1 1.2 10,890 2,680 19,100 0.4 0.1 0.7 Central Asia - - - - - - - - - - - - - - - - - - East and South-East Asia 480 370 1,100 0.03 0.02 0.07 9,060 3,490 20,500 0.6 0.2 1.3 3,210 1,650 6,600 0.2 0.1 0.4 Near and Middle East 90 50 140 0.03 0.02 0.05 420 280 840 0.1 0.1 0.3 - - - - - - South Asia - - - - - - - - - - - - - - - - - - Europe 3,680 3,430 3,930 0.7 0.6 0.7 2,390 2,000 2,790 0.4 0.4 0.5 2,950 2,710 3,200 0.5 0.5 0.6 Eastern and South-Eastern Europe 510 290 740 0.2 0.1 0.3 830 470 1,200 0.4 0.2 0.5 1,300 1,090 1,520 0.6 0.5 0.7 Western and Central Europe 3,170 3,150 3,190 1.0 1.0 1.0 1,560 1,530 1,590 0.5 0.5 0.5 1,650 1,620 1,670 0.5 0.5 0.5 Oceania 390 390 480 1.6 1.6 1.9 510 410 540 2.1 1.7 2.2 620 620 620 2.5 2.5 2.5 Global estimate 17,040 13,800 20,730 0.4 0.3 0.4 33,900 13,870 53,870 0.7 0.3 1.1 18,790 9,340 28,390 0.4 0.2 0.6 Source: UNODC estimates based on annual report questionnaire data and other official sources.
� Amphetamines include both amphetamine and methamphetamine.
Prevalence of use of new psychoactive substances in the general and youth population
LIFE-TIME PREVALENCE PAST-YEAR PREVALENCE PAST MONTH COUNTRY SUBSTANCE SURVEY YEAR AGE OF POPULATION GROUP ALL MALE FEMALE ALL MALE FEMALE ALL MALE FEMALE SOURCE Argentina Ketamine 2006 16-65 0.50 0.60 0.40 Observatorio Argentino de Drogas de la Secretaría de Programación para la Prevención de la Drogadicción y Lucha contra el Narcotráfico, Tendencia en el Consumo de Sustancias Psicoactivas en Argentina 2004-2010: Población de 16 a 65 Años (2011) Ketamine 2006 16-24 0.70 Tendencia en el Consumo de Sustancias Psicoactivas en Argentina 2004-2010: Población de 16 a 65 Años Ketamine 2008 16-65 0.30 0.50 0.10 Tendencia en el Consumo de Sustancias Psicoactivas en Argentina 2004-2010: Población de 16 a 65 Años Ketamine 2008 16-24 0.20 Tendencia en el Consumo de Sustancias Psicoactivas en Argentina 2004-2010: Población de 16 a 65 Años Ketamine 2009 16-25 1.00 1.80 0.40 Annual report questionnaire Ketamine 2010 16-65 0.40 0.50 0.30 Tendencia en el Consumo de Sustancias Psicoactivas en Argentina 2004-2010: Población de 16 a 65 Años Ketamine 2010 16-24 0.20 Tendencia en el Consumo de Sustancias Psicoactivas en Argentina 2004-2010: Población de 16 a 65 Años Ketamine 2010 12-65 0.30 0.40 0.20 Annual report questionnaire Ketamine 2011 13, 15 and 17 0.70 1.00 0.40 Observatorio Argentino de Drogas de la Secretaría de Programación para la Prevención de la Drogadicción y Lucha contra el Narcotráfico, Quinta Encuesta Nacional a Estudiantes de Enseñanza Media 2011 Ketamine 2011 15-16 0.60 Observatorio Argentino de Drogas de la Secretaría de Programación para la Prevención de la Drogadicción y Lucha contra el Narcotráfico, Quinta Encuesta Nacional a Estudiantes de Enseñanza Media 2011 Australia Ketamine 2007 15-64 1.30 0.70 0.20 0.10 Annual report questionnaire Ketamine 2007 12-17 0.00 0.00 0.00 0.00 Annual report questionnaire Ketamine 2010 14 and older 1.40 1.80 0.90 0.21 0.30 0.20 Annual report questionnaire Ketamine 2010 15-16 0.10 0.00 Annual report questionnaire Ketamine 2010 18-24 2.50 Australian Institute of Health and Welfare, 2010 National Drug Strategy Household Survey Report (Canberra, 2011) Bolivia (Plurinational State of) Ketamine 2012 University students 0.25 0.01 Programa Antidrogas Ilícitas de la Comunidad Andina, II Estudio Epidemiológico Andino sobre Consumo de Drogas en la Población Universitaria: Informe Regional, 2012 Brazil Ketamine 2005 15-16 0.20 0.30 0.10 Annual report questionnaire Ketamine 2010 10-19 0.20 0.30 0.10 Annual report questionnaire Canada Ketamine 2004 15 and older 1.00 0.30 Annual report questionnaire Ketamine 2007 15 and older 1.10 0.20 Annual report questionnaire Ketamine 2010 15 and older 1.40 0.20 Annual report questionnaire Salvia divinorum 2011 15 and older 1.60 2.20 1.10 Annual report questionnaire (estimated prevalence) Ketamine 2010-11 15-16 1.60 2.30 0.80 1.10 1.60 0.00 Annual report questionnaire Salvia divinorum 2010-11 15-16 2.90 8.50 5.80 3.80 5.50 2.00 Annual report questionnaire Colombia Ketamine 2013 12-65 0.18 Government of Colombia, Estudio Nacional de Consumo de Sustancias Psicoactivas en Colombia 2013 (Bogotá, 2014) Colombia Ketamine 2012 15-16 0.26 0.09 0.02 Annual report questionnaire Coombia Ketamine 2012 University students 0.28 0.09 II Estudio Epidemiológico Andino sobre Consumo de Drogas en la Población Universitaria: Informe Regional, 2012 Costa Rica Ketamine 2012 15-16 0.36 0.53 0.21 Annual report questionnaire Croatia Mephedrone 2010/11 0.30 1.50 2012 national report to the European Monitoring Centre for Drugs and Drug Addiction (EMCDDA) Croatia Synthetic cannabinoids (Spice) 2010/11 1.10 1.10 2012 national report to EMCDDA Djibouti Khat 2011 12 and older 28.30 43.70 13.60 World Bank, Comprendre la dynamique du khat à Djibouti: aspects sociaux, économiques et de santé (Washington, D.C., 2011) Ecuador Ketamine 2009 University students 0.01 0.00 0.00 Annual report questionnaire Ketamine 2012 12-17 0.34 0.45 0.20 0.14 0.18 0.09 0.07 0.07 0.06 Consejo Nacional de Control de Sustancias Estupefacientes y Psicotrópicas and Observatorio Nacional de Drogas, Cuarta encuesta nacional sobre uso de drogas en estudiantes de 12 a 17 años (Quito, 2013) Hallucinogens or acids (PCP, LSD, Peyote) 2012 12-17 0.70 0.98 0.31 0.30 0.48 0.12 0.12 0.18 0.05 Cuarta encuesta nacional sobre uso de drogas en estudiantes de 12 a 17 años Popper 2012 12-17 0.47 0.42 0.52 0.12 0.10 0.15 0.05 0.04 0.07 Cuarta encuesta nacional sobre uso de drogas en estudiantes de 12 a 17 años Ketamine 2012 University students 0.05 0.01 II Estudio Epidemiológico Andino sobre Consumo de Drogas en la Población Universitaria: Informe Regional, 2012 Ketamine 2012 University students 0.05 0.01 II Estudio Epidemiológico Andino sobre Consumo de Drogas en la Población Universitaria: Informe Regional, 2012 El Salvador Ketamine 2010 17-25 0.19 0.00 0.00 0.19 0.00 0.00 Annual report questionnaire France Ketamine 2003 0.30 0.20 Annual report questionnaire Germany Synthetic cannabinoids (Spice) 2009 18-64 0.80 1.10 0.40 0.00 0.00 Annual report questionnaire Ketamine 2009 0.80 1.10 0.40 Annual report questionnaire Synthetic cannabinoids (Spice) 2012 18-64 0.20 2013 National Report to the EMCDDA Hong Kong, China Ketamine 2007 11-99 0.06 0.03 Annual report questionnaire Ketamine 2007 11-20 0.27 0.16 Annual report questionnaire Ketamine 2008 11-99 0.08 0.04 Annual report questionnaire Ketamine 2008 11-20 0.34 0.21 Annual report questionnaire Ketamine 2009 11-99 0.08 0.04 Annual report questionnaire Ketamine 2009 11-20 0.55 0.56 0.33 0.30 Annual report questionnaire Ketamine 2011 15-64 0.05 0.09 0.02 Annual report questionnaire Ketamine 2011 15-16 0.18 0.25 0.11 Annual report questionnaire Ketamine 2012 15-64 0.05 0.08 0.02 Annual report questionnaire Ketamine 2012 15-16 0.13 0.18 0.07 Annual report questionnaire Hungary Mephedrone 2011 16 only 6.00 5.80 6.30 Annual report questionnaire Indonesia Ketamine 2009 11-19 0.30 0.20 0.10 Annual report questionnaire Ireland and Northern Ireland Mephedrone 2010/11 15-64 2.00 3.10 0.90 1.10 1.90 0.30 0.10 0.10 0.00 Drug Prevalence Survey 2010/11: Regional Drug Task Force (Ireland) and Health & Social Care Trust (Northern Ireland) Results (June 2012) Mephedrone 2010/11 15-34 4.30 2.20 0.10 Drug Prevalence Survey 2010/11: Regional Drug Task Force (Ireland) and Health & Social Care Trust (Northern Ireland) Results (June 2012) Israel Ketamine 2005 18-40 0.40 0.10 0.05 Annual report questionnaire Ketamine 2005 18-24 0.20 Israel Anti-Drug Authority, "Illegal use of drugs and alcohol in Israel 2009: seventh national epidemiological survey" Ketamine 2008 18-40 0.90 0.00 0.00 0.12 0.22 0.03 0.05 0.00 0.00 Annual report questionnaire Ketamine 2008 18-24 0.23 "Illegal use of drugs and alcohol in Israel 2009: seventh national epidemiological survey" Ketamine 2009 18-40 0.90 0.12 0.22 0.03 0.05 Annual report questionnaire Khat 2008 18-40 1.84 "Illegal use of drugs and alcohol in Israel 2009: seventh national epidemiological survey" Khat 2008 12-18 6.65 "Illegal use of drugs and alcohol in Israel 2009: seventh national epidemiological survey" Kenya Khat 2004 15-64 2.80 Annual report questionnaire Khat 2004 10-24 29.80 Annual report questionnaire Latvia Salvia divinorium 2011 15-16 4.40 6.40 2.10 Annual report questionnaire Synthetic cannabinoids (Spice) 2001 15-64 2.50 3.70 1.40 2013 national report to EMCDDA Synthetic cannabinoids (Spice) 2011 15-24 6.10 2013 national report to EMCDDA Synthetic cannabinoids (Spice) 2011 15-16 10.60 15.60 6.30 Annual report questionnaire Synthetic cannabinoids (Spice) 2013 15-16 15.00 2013 national report to EMCDDA Macao, China Ketamine 2006 15-25 2.00 Annual report questionnaire Malta Mephedrone 2011 15-16 3.50 5.00 2.00 Annual report questionnaire New Zealand Ketamine 2007 16-64 1.20 0.00 0.00 0.30 Annual report questionnaire BZP 2007 17-64 13.50 19.40 14.70 5.60 8.10 6.40 Ministry of Health (New Zealand), Drug Use in New Zealand: Key Results of the 2007/08 New Zealand Alcohol and Drug Use Survey (Wellington 2010) BZP 2007 18-24 37.30 30.30 19.80 13.50 Drug Use in New Zealand: Key Results of the 2007/08 New Zealand Alcohol and Drug Use Survey BZP 2007 16-17 15.50 24.30 9.50 17.30 Drug Use in New Zealand: Key Results of the 2007/08 New Zealand Alcohol and Drug Use Survey Peru Ketamine 2006 0.01 0.02 0.00 Annual report questionnaire Ketamine 2012 University students 0.12 0.01 II Estudio Epidemiológico Andino sobre Consumo de Drogas en la Població,n Universitaria: Informe Regional, 2012 Romania Ketamine 2010 0.10 0.10 0.10 Annual report questionnaire Slovakia Mephedrone 2010 15-64 0.00 0.10 0.00 Annual report questionnaire Mephedrone 2010 15-19 1.70 2011 national report to EMCDDA Synthetic cannabinoids (Spice) 2010 15-64 0.30 0.50 0.10 0.10 0.20 0.10 0.20 0.00 Annual report questionnaire Synthetic cannabinoids (Spice) 2010 15-19 4.10 2011 national report to EMCDDA Spain Ketamine 2010 14-18 1.10 1.40 0.80 0.80 1.00 0.50 0.40 0.50 0.30 Annual report questionnaire Synthetic cannabinoids (Spice) 2010 14-18 1.10 1.60 0.70 0.80 1.00 0.50 0.50 0.60 0.30 Encuesta Estatal sobre Uso de Drogas en Enseñanzas Secundarias (ESTUDES) 2010 survey Piperazines 2010 14-18 0.40 0.60 0.20 0.30 0.40 0.20 0.20 0.30 0.10 ESTUDES 2010 survey Mephedrone 2010 14-18 0.40 0.60 0.20 0.30 0.50 0.20 0.20 0.30 0.10 ESTUDES 2010 survey Ketamine 2011 15-64 1.00 1.50 0.50 0.20 0.30 0.10 0.00 0.10 0.00 Annual report questionnaire Ketamine 2011 15-24 1.40 1.80 1.00 0.50 0.70 0.30 0.20 0.20 0.10 Encuesta sobre alcohol y drogas en España (EDADES) 2011 survey Synthetic cannabinoids (Spice) 2011 15-64 0.80 1.20 0.30 0.10 0.30 0.00 0.10 0.10 0.00 EDADES 2011 survey Synthetic cannabinoids (Spice) 2011 15-24 1.00 1.40 0.60 0.40 0.60 0.20 0.20 0.30 0.10 EDADES 2011 survey Piperazines 2011 15-64 0.10 0.20 0.00 0.00 0.00 0.00 0.00 0.00 0.00 EDADES 2011 survey Piperazines 2011 15-24 0.10 0.20 0.00 0.10 0.10 0.00 0.00 0.00 0.00 EDADES 2011 survey Mephedrone 2011 15-64 0.10 0.20 0.00 0.00 0.10 0.00 0.00 0.00 0.00 EDADES 2011 survey Mephedrone 2011 15-24 0.30 0.40 0.20 0.20 0.20 0.10 0.00 0.10 0.00 EDADES 2011 survey Salvia divinorum 2011 15-64 0.90 1.30 0.40 0.20 0.30 0.10 0.10 0.20 0.10 EDADES 2011 survey Ketamine 2012 14-18 1.10 1.50 0.70 0.70 0.90 0.40 0.40 0.60 0.20 ESTUDES 2012 survey Synthetic cannabinoids (Spice) 2012 14-18 1.40 1.90 1.00 1.00 1.30 0.70 0.60 0.90 0.30 ESTUDES 2012 survey Piperazines 2012 14-18 0.40 0.60 0.30 0.30 0.54 0.20 0.20 0.40 0.10 ESTUDES 2012 survey Mephedrone 2012 14-18 0.50 0.70 0.20 0.30 0.50 0.10 0.20 0.40 0.10 ESTUDES 2012 survey Salvia divinorum 2012 14-18 0.80 1.20 0.40 0.50 0.90 0.20 0.30 0.50 0.10 ESTUDES 2012 survey Sweden Synthetic cannabinoids (Spice) 2012 15-16 2.40 2.00 Annual report questionnaire Thailand Ketamine 2007 12-65 0.70 Annual report questionnaire Ukraine Ketamine 2011 15-17 0.80 1.50 0.20 Annual report questionnaire United Kingdom Ketamine 2006/07 16-59 1.30 0.30 0.10 Annual report questionnaire Ketamine 2006/07 11-15 0.60 0.60 0.50 0.50 Annual report questionnaire Ketamine 2007/08 11-15 0.50 0.50 0.60 0.60 Annual report questionnaire Ketamine 2008/09 11-15 0.90 0.80 0.70 0.70 Annual report questionnaire Ketamine 2008/09 15 only 1.60 1.60 Annual report questionnaire Ketamine 2008/09 16-59 1.80 0.70 0.60 0.25 0.20 National report to EMCDDA Ketamine 2009/10 15-64 4.00 0.0 0.00 0.50 0.80 0.20 0.20 0.00 0.00 Annual report questionnaire United Kingdom (England and Wales) Ketamine 2006/07 16-24 2.30 0.80 0.30 United Kingdom, Home Office, Drug Misuse Declared: Findings from the 2010/11 British Crime Survey - England and Wales, (London, July 2011) Ketamine 2007/08 16-59 1.40 0.40 0.20 Findings from the 2010/11 British Crime Survey Ketamine 2007/08 16-24 2.20 0.90 0.30 Findings from the 2010/11 British Crime Survey Ketamine 2008/09 16-24 3.60 1.90 0.80 Findings from the 2010/11 British Crime Survey Ketamine 2009/10 16-59 2.00 0.50 0.20 Findings from the 2010/11 British Crime Survey Ketamine 2009/10 16-24 4.00 1.70 0.90 Findings from the 2010/11 British Crime Survey Ketamine 2010/11 16-59 2.20 0.60 0.80 0.40 0.30 Findings from the 2010/11 British Crime Survey Ketamine 2010/11 16-24 4.40 2.10 0.90 Findings from the 2010/11 British Crime Survey Ketamine 2011/12 16-59 2.50 0.60 United Kingdom, Home Office, Drug Misuse Declared: Findings from the 2011/12 Crime Survey for England and Wales, 2nd ed. (London, July 2012) Ketamine 2011/12 16-24 4.00 1.80 Findings from the 2011/12 British Crime Survey Ketamine 2012/13 16-59 2.30 0.40 United Kingdom, Home Office, Drug Misuse Declared: Findings from the 2012/13 Crime Survey for England and Wales (London, July 2013) Ketamine 2012/13 16-24 3.30 0.80 Findings from the 2012/13 British Crime Survey Synthetic cannabinoids (spice) 2010/11 16-59 0.20 Findings from the 2010/11 British Crime Survey Synthetic cannabinoids (spice) 2010/11 16-24 0.40 Findings from the 2010/11 British Crime Survey BZP 2010/11 16-59 0.10 Findings from the 2010/11 British Crime Survey BZP 2010/11 16-24 0.20 Findings from the 2010/11 British Crime Survey Khat 2010/11 16-59 0.20 Findings from the 2010/11 British Crime Survey Khat 2010/11 16-24 0.30 2.00 0.80 Findings from the 2010/11 British Crime Survey Khat 2011/12 16-59 0.20 Findings from the 2011/12 British Crime Survey Mephedrone 2010/11 16-59 1.40 2.00 0.80 Findings from the 2010/11 British Crime Survey Mephedrone 2010/11 16-24 4.40 Findings from the 2010/11 British Crime Survey Mephedrone 2011/12 16-59 1.10 1.50 0.70 Findings from the 2011/12 British Crime Survey Mephedrone 2011/12 16-24 3.30 Findings from the 2011/12 British Crime Survey Mephedrone 2012/13 16-59 0.50 Findings from the 2012/13 British Crime Survey Mephedrone 2012/13 16-24 1.60 Findings from the 2012/13 British Crime Survey BZP 2011/12 16-59 0.10 Findings from the 2011/12 British Crime Survey Synthetic cannabinoids (spice) 2011/12 16-59 0.10 Findings from the 2011/12 British Crime Survey Salvia divinorum 2012/13 16-59 0.30 Findings from the 2012/13 British Crime Survey Salvia divinorum 2012/13 16-24 1.10 Findings from the 2012/13 British Crime Survey United States Ketamine 2002 19-28 1.20 United States National Institute on Drug Abuse, Monitoring the Future survey for 2011 on drug use among adolescents Ketamine 2003 19-28 0.90 Monitoring the Future survey for 2011 Ketamine 2004 19-28 0.60 Monitoring the Future survey for 2011 Ketamine 2005 19-28 0.50 Monitoring the Future survey for 2011 Ketamine 2006 19-28 0.50 Monitoring the Future survey for 2011 Ketamine 2007 19-28 0.30 Monitoring the Future survey for 2011 Ketamine 2008 19-28 0.40 Monitoring the Future survey for 2011 Ketamine 2009 19-28 0.50 Monitoring the Future survey for 2011 Ketamine 2010 19-28 0.80 Monitoring the Future survey for 2011 Ketamine 2011 19-28 0.50 Monitoring the Future survey for 2011 Salvia divinorum 2011 19-30 2.30 3.50 1.50 Monitoring the Future survey for 2011 Salvia divinorum 2013 12th grade 3.40 Monitoring the Future survey for 2013 Salvia divinorum 2012 12th grade 4.40 Monitoring the Future survey for 2013 Salvia divinorum 2011 12th grade 5.90 Monitoring the Future survey for 2011 Salvia divinorum 2010 12th grade 5.50 Monitoring the Future survey for 2011 Salvia divinorum 2009 12th grade 5.70 Monitoring the Future survey for 2011 Ketamine 2000 12th grade 2.50 Monitoring the Future survey for 2011 Ketamine 2001 12th grade 2.50 Monitoring the Future survey for 2011 Ketamine 2002 12th grade 2.60 Monitoring the Future survey for 2011 Ketamine 2003 12th grade 2.10 Monitoring the Future survey for 2011 Ketamine 2004 12th grade 1.90 Monitoring the Future survey for 2011 Ketamine 2005 12th grade 1.60 Monitoring the Future survey for 2011 Ketamine 2006 12th grade 1.40 Monitoring the Future survey for 2011 Ketamine 2007 12th grade 1.30 Monitoring the Future survey for 2011 Ketamine 2008 12th grade 1.50 Monitoring the Future survey for 2011 Ketamine 2009 12th grade 1.70 Monitoring the Future survey for 2011 Ketamine 2010 12th grade 1.60 Monitoring the Future survey for 2011 Ketamine 2011 12th grade 1.70 Monitoring the Future survey for 2011 Ketamine 2012 12th grade 1.50 Monitoring the Future survey for 2013 Ketamine 2013 12th grade 1.40 Monitoring the Future survey for 2013 Synthetic cannabinoids (Spice) 2011 19-30 6.50 9.60 4.50 Monitoring the Future survey for 2011 Synthetic cannabinoids (Spice) 2011 12th grade 11.40 Monitoring the Future survey for 2011 Synthetic cannabinoids (Spice) 2012 12th grade 11.30 Monitoring the Future survey for 2013 Synthetic cannabinoids (Spice) 2013 12th grade 7.90 Monitoring the Future survey for 2013 Uruguay Ketamine 2006 15-64 0.30 0.40 0.20 Annual report questionnaire Uruguay Ketamine 2011 15-65 0.60 0.80 0.50 Annual report questionnaire Yemen Khat 2006 12 and older 52.30 72.00 32.60 World Bank, "Yemen: towards qat demand reduction" (Washington D.C., June 2007)
ANNEX II
REGIONAL GROUPINGSThis report uses a number of regional and subregional designations. Not official designations, they are defined as follows:
- East Africa: Burundi, Comoros, Djibouti, Eritrea, Ethiopia, Kenya, Madagascar, Mauritius, Rwanda, Seychelles, Somalia, Uganda and United Republic of Tanzania.
- North Africa: Algeria, Egypt, Libya, Morocco, South Sudan, Sudan and Tunisia.
- Southern Africa: Angola, Botswana, Lesotho, Malawi, Mozambique, Namibia, South Africa, Swaziland, Zambia and Zimbabwe.
- West and Central Africa: Benin, Burkina Faso, Cameroon, Cape Verde, Central African Republic, Chad, Congo, Cote d'lvoire, Democratic Republic of the Congo, Equatorial Guinea, Gabon, Gambia, Ghana, Guinea, Guinea-Bissau, Liberia, Mali, Mauritania, Niger, Nigeria, Sao Tome and Principe, Senegal, Sierra Leone and Togo.
- Caribbean: Antigua and Barbuda, Bahamas, Barbados, Bermuda, Cuba, Dominica, Dominican Republic, Grenada, Haiti, Jamaica, Saint Kitts and Nevis, Saint Lucia, Saint Vincent and the Grenadines and Trinidad and Tobago.
- Central America: Belize, Costa Rica, El Salvador, Guatemala, Honduras, Nicaragua and Panama.
- North America: Canada, Mexico and United States of America.
- South America: Argentina, Bolivia (Plurinational State of), Brazil, Chile, Colombia, Ecuador, Guyana, Paraguay, Peru, Suriname, Uruguay and Venezuela (Bolivarian Republic of).
- Central Asia and Transcaucasia: Armenia, Azerbaijan, Georgia, Kazakhstan, Kyrgyzstan, Tajikistan, Turkmenistan and Uzbekistan.
- East and South-East Asia: Brunei Darussalam, Cambodia, China, Democratic People's Republic of Korea, Indonesia, Japan, Lao People's Democratic Republic, Malaysia, Mongolia, Myanmar, Philippines, Republic of Korea, Singapore, Thailand, Timor-Leste and Viet Nam.
- South-West Asia: Afghanistan, Iran (Islamic Republic of), and Pakistan.
- Near and Middle East: Bahrain, Iraq, Israel, Jordan, Kuwait, Lebanon, Oman, Qatar, Saudi Arabia, Syrian Arab Republic, United Arab Emirates and Yemen.
- South Asia: Bangladesh, Bhutan, India, Maldives, Nepal and Sri Lanka.
- Eastern Europe: Belarus, Republic of Moldova, Russian Federation and Ukraine.
- South-Eastern Europe: Albania, Bosnia and Herzegovina, Bulgaria, Croatia, Montenegro, Romania, Serbia, the former Yugoslav Republic of Macedonia, and Turkey.
- Western and Central Europe: Andorra, Austria, Belgium, Cyprus, Czech Republic, Denmark, Estonia, Finland, France, Germany, Greece, Hungary, Iceland, Ireland, Italy, Latvia, Liechtenstein, Lithuania, Luxembourg, Malta, Monaco, Netherlands, Norway, Poland, Portugal, San Marino, Slovakia, Slovenia, Spain, Sweden, Switzerland and United Kingdom of Great Britain and Northern Ireland.
- Oceania: Australia, Fiji, Kiribati, Marshall Islands, Micronesia (Federated States of), Nauru, New Zealand, Palau, Papua New Guinea, Samoa, Solomon Islands, Tonga, Tuvalu, Vanuatu and small island territories.
GLOSSARY
- amphetamine-type stimulants — a group of substances composed of synthetic stimulants that were placed under international control in the Convention on Psychotropic Substances of 1971 and are from the group of substances called amphetamines, which includes amphetamine, methamphetamine, methcathinone and the "ecstasy"-group substances (3,4-methylenedioxymethamphetamine (MDMA) and its analogues)
- amphetamines — a group of amphetamine-type stimulants that includes amphetamine and methamphetamine
- annual prevalence — the total number of people of a given age range who have used a given drug at least once in the past year, divided by the number of people of the given age range, expressed as a percentage
- coca paste (or coca base) — an extract of the leaves of the coca bush. Purification of coca paste yields cocaine (base and hydrochloride)
- crack cocaine — cocaine base obtained from cocaine hydro-chloride through conversion processes to make it suitable for smoking
- new psychoactive substances — substances of abuse, either in a pure form or a preparation, that are not controlled under the Single Convention on Narcotic Drugs of 1961 or the 1971 Convention, but that may pose a public health threat. In this context, the term "new" does not necessarily refer to new inventions but to substances that have recently become available
- opiates — a subset of opioids comprising the various products derived from the opium poppy plant, including opium, morphine and heroin
- opioids — a generic term applied to alkaloids from opium poppy (opiates), their synthetic analogues (mainly prescription or pharmaceutical opioids) and compounds synthesized in the body
- poppy straw — all parts (except the seeds) of the opium poppy, after mowing
- problem drug users — people who engage in the high-risk consumption of drugs, for example people who inject drugs, people who use drugs on a daily basis and/or people diagnosed with drug use disorders or as drug-dependent based on clinical criteria contained in the International Classification of Diseases (tenth revision) of the World Health Organization and the Diagnostic and Statistical Manual of Mental Disorders (fourth edition) of the American Psychiatric Association, or any similar criteria or definition that may be used
Notes to the Executive Summary:
1. Political Declaration on HIV and AIDS: Intensifying Our Efforts to Eliminate HIV and AIDS (General Assembly resolution 65/277, annex). [Back]
2. Action Plan on International Cooperation on the Eradication of Illicit Drug Crops and on Alternative Development (General Assembly resolution S-20/4 E). [Back]
3. General Assembly resolution 68/196, annex. [Back]
4. See Official Records of the Economic and Social Council, 2009, Supplement No. 8 (E/2009/28), chap. I, sect. C. [Back]
5. A/68/970 and Corr.1. [Back]
Notes to Chapter I:
1. Alan J. Budney and others, "Marijuana dependence and its treatment", Addiction Science and Clinical Practice, vol. 4, No. 1 (December 2007), pp. 4-16. [Back]
2. Flavia S. Jungerman and Ronaldo Laranjeira, "Characteristics of cannabis users seeking treatment in Sao Paulo, Brazil", Rev Panam Salud Publica, vol. 23, No. 6 (2008), pp. 384-393. [Back]
3. EMCDDA, European Drug Report: Trends and Developments 2014 (Luxembourg, Publications Office of the European Union, 2014). [Back]
4. Roy Walmsley, "World Prison Population List", 10th ed. (London, International Centre for Prison Studies). [Back]
5. Amy E. Boutwell and others, "Arrested on heroin: a national opportunity", Journal of Opioid Management, vol. 3, No. 6 (2007), pp. 328-332. [Back]
6. Chloé Carpentier, Luis Royuela and Linda Montanari, "The global epidemiology of drug use in prison", in Drug Use in Prisoners: Epidemiology, Implications and Policy Responses, Stuart A. Kinner and Josiah Rich, eds. (forthcoming). [Back]
7. WHO, UNODC and UNAIDS, Effectiveness of Interventions to Address HIV in Prisons, Evidence for Action Technical Papers (Geneva, WHO, 2007). [Back]
8. EMCDDA, Statistical Bulletin 2014. Available at www.emcdda.europa.eu/. [Back]
9. R. E. Martin and others, "Drug use and risk of bloodborne infections: a survey of female prisoners in British Columbia", Canadian Journal of Public Health, vol. 96, No. 2 (2005), pp. 97-101. [Back]
10. Stuart A. Kinner and others, "High-risk drug-use practices among a large sample of Australian prisoners", Drug and Alcohol Dependence, vol. 126, Nos. 1 and 2 (November 2012), pp. 156-160. [Back]
11. Hansa Thaisri and others, "HIV infection and risk factors among Bangkok prisoners, Thailand: a prospective cohort study", BMC Infectious Diseases, vol. 3 (2003). [Back]
12. Kate Dolan and others, "People who inject drugs in prison: HIV prevalence, transmission and prevention", International Journal of Drug Policy, vol. 26 (2015), pp. S12-S15. [Back]
13. UNAIDS, The Gap Report (Geneva, 2014). [Back]
14. Federal Research and Methodological Centre for Prevention and Control of AIDS, HIV Infection: Newsletter No. 38 (Moscow, 2013). [Back]
15. K. Eritsyan and others, "Individual level, network-level and city-level factors associated with HIV prevalence among people who inject drugs in eight Russian cities: a cross-sectional study", BMJ, vol. 3, No. 6 (2013). [Back]
16. UNAIDS, The Cities Report (Geneva, 2014). [Back]
17. The WHO, UNODC, UNAIDS Technical Guide for Countries to Set Targets for Universal Access to HIV Prevention, Treatment and Care for Injecting Drug Users: 2012 Revision recommends a comprehensive package of nine interventions, aimed at reducing the risk of acquiring, and improving the treatment and care of HIV, hepatitis and tuberculosis in people who inject drugs, commonly referred to as a "harm reduction approach" to injecting drug use. [Back]
18. UNODC, World Drug Report 2014. [Back]
19. Harm Reduction International, The Global State of Harm Reduction 2014, Katie Stone, ed. (London, 2014). [Back]
20. Political Declaration on HIV and AIDS: Intensifying Our Efforts to Eliminate HIV and AIDS (General Assembly resolution 65/277, annex). [Back]
21. UNAIDS Programme Coordinating Board, "Halving HIV transmission among people who inject drugs: background note", UNAIDS/PCB (35)/14.27, 25 November 2014. [Back]
22. David P. Wilson and others, "The cost-effectiveness of harm reduction", International Journal of Drug Policy, vol. 26, Suppl. No. 1 (2015), pp. S5-S11. [Back]
23. Bradley M. Mathers and others "HIV prevention, treatment, and care services for people who inject drugs: a systematic review of global, regional, and national coverage", The Lancet, vol. 375, No. 9719 (2010), pp. 1014-1028. [Back]
24. The Global Burden of Hepatitis C Working Group, "Global burden of disease (GBD) for hepatitis C", Journal of Clinical Pharmacology, vol. 44, No. 1 (2004), pp. 20-29. [Back]
25. China National Centre for AIDS/STD Control and Prevention, 2012. [Back]
26. Barbara Tempalski and others, "Trends in the population prevalence of people who inject drugs in US metropolitan areas 1992-2007", PLOS ONE, vol. 8, No. 6 (2013). [Back]
27. L. Wiessing and others, "Hepatitis C virus infection epidemiology among people who inject drugs in Europe: a systematic review of data for scaling up treatment and prevention", PLOS ONE, vol. 9, No. 7 (2014). [Back]
28. The definition of drug-related deaths varies between Member States but includes some or all of the following: fatal drug overdoses; deaths due to HIV acquired through injecting drug use; suicide; and unintentional deaths and trauma due to illicit drug use. [Back]
29. EMCDDA, European Drug Report 2014. [Back]
30. H. Hedegaard, L. H. Chen and M. Warner, "Drug poisoning deaths involving heroin: United States, 2000-2013", NCHS Data Brief No. 190 (Hyattsville, Maryland, National Center for Health Statistics, March 2015). [Back]
31. United Kingdom, Office for National Statistics, "Deaths related to drug poisoning in England and Wales, 2013", Statistical Bulletin (September 2014). [Back]
32. S. Darke, J. Ross and W. Hall, "Overdose among heroin users in Sydney, Australia: I. Prevalence and correlates of non-fatal overdose", Addiction, vol. 91, No. 3 (1996), pp. 405-411. [Back]
33. M. Karbakhsh and N. Salehian Zandi, "Acute opiate overdose in Tehran: the forgotten role of opium", Addictive Behaviors, vol. 32, No. 9 (2007), pp. 1835-1842. [Back]
34. A. Bergenstrom and others, "A cross-sectional study on prevalence of non-fatal drug overdose and associated risk characteristics among out-of-treatment injecting drug users in North Vietnam", Substance Use and Misuse, vol. 43, No. 1 (2008), pp. 77-84. [Back]
35. P. Davidson and others, "Witnessing heroin-related overdoses: the experiences of young injectors in San Francisco", Addiction, vol. 97, No. 12 (2002), pp. 1511-1516. [Back]
36. L. Yin and others, "Nonfatal overdose among heroin uses in southwestern China", The American Journal of Drug and Alcohol Abuse, vol. 33, No. 4 (2007), pp. 505-516. [Back]
37. B. Fischer and others, "Determinants of overdose incidents among illicit opioid users in 5 Canadian cities", Canadian Medical Association Journal, vol. 171, No. 3 (2004), pp. 235-239. [Back]
38. M. Warner-Smith, S. Darke and C. Day, "Morbidity associated with non-fatal heroin overdose", Addiction, vol. 97, No. 8 (2002), pp. 963-967. [Back]
39. EMCDDA, Annual Report 2010 (Lisbon, November 2010). [Back]
40. A. Tokar and T. Andreeva, "Estimate of the extent of opiate overdose in Ukraine", Tobacco Control and Public Health in Eastern Europe, vol. 2, No. 3 (2012). [Back]
41. S. Darke, R. P. Mattick and L. Degenhardt, "The ratio of non-fatal to fatal overdose", Addiction, vol. 98, No. 8 (2003), pp. 1169-1170. [Back]
42. Warner-Smith, Darke and Day, "Morbidity associated with non-fatal heroin overdose" (see footnote 38). [Back]
43. Shane Darke and Wayne Hall, "Heroin overdose: research and evidence-based intervention", Journal of Urban Health, vol. 80, No. 2 (2003), pp. 189-200. [Back]
44. S. Darke and others, "Patterns of nonfatal heroin overdose over a 3-year period: findings from the Australian Treatment Outcome Study", Journal of Urban Health, vol. 84, No. 2 (2007), pp. 283291. [Back]
45. A. R. Bazazi and others, "High prevalence of non-fatal overdose among people who inject drugs in Malaysia: correlates of overdose and implications for overdose prevention from a cross-sectional study", International Journal of Drug Policy (2014). [Back]
46. Darke, Ross and Hall, "Overdose among heroin users in Sydney" (see footnote 32). [Back]
47. Bergenstrom and others, "A cross-sectional study on prevalence of non-fatal drug overdose" (see footnote 34). [Back]
48. Bazazi and others, "High prevalence of non-fatal overdose among people who inject drugs in Malaysia" (see footnote 45). [Back]
49. EMCDDA, Annual Report 2010. [Back]
50. T. Kerr and others, "Predictors of non-fatal overdose among a cohort of polysubstance-using injection drug users", Drug and Alcohol Dependence, vol. 87, No. 1 (2007), pp. 39-45. [Back]
51. Traci G. Green and others, "HIV infection and risk of overdose: a systematic review and meta-analysis", AIDS, vol. 26, No. 4 (20 February 2012), pp. 403-417. [Back]
52. See also UNODC, World Drug Report 2014. [Back]
53. UNODC, World Drug Report 2014. [Back]
54. Christine E. Grella, "From generic to gender-responsive treatment: changes in social policies, treatment services, and outcomes of women in substance abuse treatment", Journal of Psychoactive Drugs, vol. 40, SARC Suppl. No. 5 (2008), pp. 327-343. [Back]
55. Michelle L. Van Etten and J. C. Anthony, "Male-female differences in transitions from first drug opportunity to first use: searching for subgroup variation by age, race, region, and urban status", Journal of Women Health and Gender Based Medicine, vol. 10, No. 8 (2001), pp. 797-804. [Back]
56. Ellen Tuchman, "Women and addiction: the importance of gender issues in substance abuse research", Journal of Addictive Diseases, vol. 29, No. 2 (2010), pp. 127-138. [Back]
58. D. Stewart and others, "Similarities in outcomes for men and women after drug misuse treatment: Results from the National Treatment Outcome Research Study (NTORS)", Drug and Alcohol Review, vol. 22, No. 1 (2003), pp. 35-41. [Back]
59. Kathleen T. Brady and Carrie L. Randall, "Gender differences in substance use disorders", Psychiatric Clinics of North America, vol. 22, No. 2 (1999), pp. 241-252. [Back]
61. Jill B. Becker and Ming Hu, "Sex differences in drug abuse", Frontiers in Neuroendocrinology, vol. 29, No. 1 (2008), pp. 36-47. [Back]
62. Carla A. Green, "Gender and use of substance abuse treatment services", Alcohol Research and Health, vol. 29, No. 1 (2006), pp. 55-62. [Back]
63. Grella, "From generic to gender-responsive treatment" (see footnote 54). [Back]
64. W. M. Compton and others, "Prevalence, correlates, disability, and comorbidity of DSM-IV drug abuse and dependence in the United States: results from the National Epidemiologic Survey on Alcohol and Related Conditions", Archives of General Psychiatry, vol. 64, No. 5 (2007), pp. 566-576. [Back]
65. Dorte Hecksher and Morten Hesse, "Women and substance use disorders", Mens Sana Monographs, vol. 7, No. 1 (2009), pp. 50-62. [Back]
66. UNAIDS, AIDSinfo database. [Back]
67. Richard H. Needle and Lin Zhao, HIV Prevention among Injecting Drug Users: Strengthening U.S. Support for Core Interventions, a report of the CSIS Global Health Policy Center (Washington, D.C., Center for Strategic and International Studies Global Health Policy Center, 2010). [Back]
68. S. Pinkham, B. Myers and C. Stoicescu, "Developing effective harm reduction services for women who inject drugs", The Global State of Harm Reduction: Towards an Integrated Response, Claudia Stoicescu, ed. (London, Harm Reduction International, 2012). [Back]
69. WHO, UNODC and UNAIDS, Effectiveness of Interventions to Address HIV in Prisons, Evidence for Action Technical Papers (Geneva, WHO, 2007). [Back]
70. Don C. Des Jarlais and others, "Are females who inject drugs at higher risk for HIV infection than males who inject drugs: an international systematic review of high seroprevalence areas", Drug and Alcohol Dependence, vol. 124, Nos. 1 and 2 (2012), pp. 95-107. [Back]
71. EMCDDA, Annual Report 2006: The State ofthe Drugs Problem in Europe (Lisbon, November 2006). [Back]
72. UNODC/ICHIRA, "Rapid situational assessment of HIV prevalence and risky behaviours among injecting drug users in Kenya" (Nairobi, July 2012). [Back]
73. Anna Bowring and others, Assessment of Risk Practices and Infectious Disease among Drug Users in Temeke District, Dar es Salaam, Tanzania: A Rapid Assessment and Response, prepared for Médecins du Monde — France (Melbourne, Australia, Centre for Population Health, Burnet Institute, 2011). [Back]
74. Enquête de prévalence et de pratiques à risques d'infection à VIH, VHB, et VHC chez les usagers de drogues dans la région de Dakar (Senegal), Etude ANRS 1224, rapport final (Paris, Agence Nationale de Recherche sur le Sida et les hepatites virales (ANRS), fevrier 2014). [Back]
75. Andrew Scheibe, Ben Brown and Monika dos Santos, Rapid Assessment of HIV Prevalence and HIV-related Risks among People Who Inject Drugs in Five South African Cities: Final Report (February 2015). [Back]
76. Nigeria, Federal Ministry of Health, HIV Integrated Biological and Behavioural Surveillance Survey (IBBSS) 2010 (Abuja, 2010). [Back]
77. Don C. Des Jarlais and others, "Gender disparities in HIV infection among persons who inject drugs in Central Asia: a systematic review and meta-analysis", Drug and Alcohol Dependence, vol. 132, Suppl. No. 1 (2013), pp. S7-S12. [Back]
78. UNODC, "HIV/AIDS prevention and care for female injecting drug users" (Vienna, July 2006). [Back]
79. Sophie Pinkham, Claudia Stoicescu and Bronwyn Myers, "Developing effective health interventions for women who inject drugs: key areas and recommendations for program development and policy", Advances in Preventive Medicine, vol. 2012 (2012). [Back]
80. UNODC/UN-Women/WHO/International Network of People who Use Drugs, policy brief on "Women who inject drugs and HIV: addressing specific needs" (Vienna, 2014). [Back]
81. Jing Gu and others, "Prevalence and factors related to syringe sharing behaviours among female injecting drug users who are also sex workers in China", International Journal of Drug Policy, vol. 22, No. 1 (2011), pp. 26-33. [Back]
82. Sara Croxford and others, "Sex work amongst people who inject drugs in England, Wales and Northern Ireland: findings from a National Survey of Health Harms and Behaviours", International Journal of Drug Policy, vol. 26, No. 4 (2015), pp. 429-433. [Back]
83. A. Roberts, B. Mathers and L. Degenhardt, Women Who Inject Drugs: A Review of Their Risks, Experiences and Needs (Sydney, National Drug and Alcohol Research Centre, University of New South Wales, 2010). [Back]
84. Shelly F. Greenfield and others, "Substance abuse treatment entry, retention, and outcome in women: a review of the literature", Drug and Alcohol Dependence, vol. 86, No. 1 (2007), pp. 1-21. [Back]
85. Tuchman, "Women and addiction" (see footnote 56). [Back]
86. Substance Abuse Treatment and Care for Women: Case Studies and Lessons Learned (United Nations publication, Sales No. E.04.XI.24). [Back]
87. Erick G. Guerrero and others, "Barriers to accessing substance abuse treatment in Mexico: national comparative analysis by migration status", Substance Abuse Treatment Prevention and Policy, vol. 9 (July 2014). [Back]
88. United Kingdom, National Treatment Agency for Substance Misuse, "Women in drug treatment: what the latest figures reveal" (London, 2010). [Back]
89. Erick G. Guerrero and others, "Gender disparities in utilization and outcome of comprehensive substance abuse treatment among racial/ ethnic groups", Journal of Substance Abuse Treatment, vol. 46, No. 5 (2014), pp. 584-591. [Back]
90. Grella, "From generic to gender-responsive treatment" (see footnote 54). [Back]
91. See, for example, United Kingdom, "Women in drug treatment: what the latest figures reveal" (see footnote 88), and Tuchman, "Women and addiction" (see footnote 56). [Back]
92. Grella, "From generic to gender-responsive treatment" (see footnote 54). [Back]
93. See footnotes 54, 88 and 89. [Back]
94. 94 Article 4, paragraph (c), and article 38, paragraph 1, of the Single Convention on Narcotic Drugs of 1961 and articles 5 and 20 of the Convention on Psychotropic Substances of 1971. [Back]
95. UNODC, International Standards on Drug Use Prevention, 2013. [Back]
96. A. Bühler and J. Thrul, Expertise zur Suchtprävention: Aktualisierte und erweiterte Neuauflage der Expertise zur Prävention des Substanzmissbrauchs, Forschung und Praxis der Gesundheitsförderung, Band 46 (Cologne, Germany, Bundeszentrale fur gesundheitliche Aufklärung, 2013). [Back]
97. UNODC, World Drug Report 2014. [Back]
98. UNODC, International Standards on Drug Use Prevention (2013). [Back]
99. P. Rohde and others, "Reduced substance use as a secondary benefit of an indicated cognitive-behavioral adolescent depression prevention program", Psychology of Addictive Behaviors, vol. 26, No. 3 (2012), pp. 599-608. [Back]
100. A. L. Stone and others, "Review of risk and protective factors of substance use and problem use in emerging adulthood", Addictive Behaviors, vol. 37, No. 7 (2012), pp. 747-775. [Back]
101. H. U. Wittchen and others, "Cannabis use and cannabis use disorders and their relationship to mental disorders: a 10-year prospective-longitudinal community sample of adolescents", Drug and Alcohol Dependence, vol. 88, Suppl. No. 1 (2007), pp. S60-S70 [Back]
102. J. Schulenberg and others, "Trajectories of marijuana use during the transition to adulthood: the big picture based on national panel data", Journal of Drug Issues, vol. 35, No. 2 (2005), pp. 255-280. [Back]
103. EMCDDA, "Polydrug use: patterns and responses", Selected issue 2009 (Lisbon, November 2009). [Back]
104. K. M. Keyes, S. S. Martin and D. S. Hasin, "Past 12-month and lifetime comorbidity and poly-drug use of ecstasy users among young adults in the United States: results from the National Epi-demiologic Survey on Alcohol and Related Conditions", Drug and Alcohol Dependence, vol. 97, Nos. 1 and 2 (2008), pp. 139-149. [Back]
105. S. Behrendt and others, "The relevance of age at first alcohol and nicotine use for initiation of cannabis use and progression to cannabis use disorders", Drug Alcohol Dependence, vol. 123, Nos. 1-3 (2012), pp. 48-56. [Back]
106. R. L. Spoth and others, "Universal intervention effects on substance use among young adults mediated by delayed adolescent substance initiation", Journal of Consulting and Clinical Psychology, vol. 77, No. 4 (2009), pp. 620-632. [Back]
107. R. L. Spoth and others, "Replication RCT of early universal prevention effects on young adult substance misuse", Journal of Consulting Clinical Psychology, vol. 82, No. 6 (2014), pp. 949-963. [Back]
108. A. Niccols and others, "Integrated programs for mothers with substance abuse issues and their children: a systematic review of studies reporting on child outcomes", Journal of Child Abuse and Neglect, vol. 36, No. 4 (2012), pp. 308-322. [Back]
109. Richard L. Spoth, Mark Greenberg and Robert Turrisi, "Preventive interventions addressing underage drinking: state of the evidence and steps toward public health impact", Pediatrics, vol. 121, Suppl. No. 4 (2008), pp. S311-S336. [Back]
110. Jane Petrie, Frances Bunn and Geraldine Byrne, "Parenting programmes for preventing tobacco, alcohol or drugs misuse in children <18: a systematic review", Health Education Research, vol. 22, No. 2 (2007), pp. 177-191. [Back]
111. E. Smit and others, "Family interventions and their effect on adolescent alcohol use in general populations: a meta-analysis of randomized controlled trials", Drug and Alcohol Dependence, vol. 97, No. 3 (2008), pp. 195-206. [Back]
113. R. L. Spoth and others, "Long-term effects of universal preventive interventions on methamphetamine use among adolescents", Archives of Pediatrics and Adolescent Medicine, vol. 160, No. 9 (2006), pp. 876-882. [Back]
114. L. Trudeau and others, "Longitudinal effects of a universal family-focused intervention on growth patterns of adolescent internalizing symptoms and polysubstance use: gender comparisons", Journal of Youth Adolescence, vol. 36, No. 6 (2007), pp. 725-740. [Back]
115. T. Miller and D. Hendrie, Substance Abuse Prevention Dollars and Cents: A Cost-Benefit Analysis, DHHS publication No. (SMA) 07-4298 (Rockville, Maryland, Center for Substance Abuse Prevention, Substance Abuse and Mental Health Services Administration, 2008). [Back]
116. Petrie, Bunn and Byrne, "Parenting programmes for preventing tobacco, alcohol or drugs misuse in children <18" (see footnote 110). [Back]
117. K. D'Onise, R. A. McDermott and J. W. Lynch, "Does attendance at preschool affect adult health? A systematic review", Public Health, vol. 124, No. 9 (2010), pp. 500-511. [Back]
118. F. A. Campbell and others, "Early childhood education: young adult outcomes from the abecedarian project", Applied Developmental Science, vol. 6, No. 1 (2002), pp. 42-57. [Back]
119. A. R. Piquero and others, Effects of Early Family/Parent Training Programs on Antisocial Behavior and Delinquency: A Systematic Review, Campbell Systematic Reviews (Oslo, The Campbell Collaboration, (2008)). [Back]
120. Spoth, Greenberg and Turrisi, "Preventive interventions addressing underage drinking" (see footnote 109). [Back]
121. K. Maruska and others, "Influencing antecedents of adolescent risk-taking behaviour in elementary school: results of a 4-year quasi-experimental controlled trial", Health Education Research, vol. 25, No. 6 (2010), pp. 1021-1030. [Back]
122. David R. Foxcroft and Alexander Tsertsvadze, "Universal school-based prevention programs for alcohol misuse in young people", Cochrane Database of Systematic Reviews, No. 5, 2011. [Back]
123. S. G. Kellam and others, "Effects of a universal classroom behavior management program in first and second grades on young adult behavioral, psychiatric, and social outcomes", Drug and Alcohol Dependence, vol. 95, Suppl. No. 1 (2008), pp. S5-S28. [Back]
124. F. Faggiano and others, "School-based prevention for illicit drugs use: a systematic review", Preventive Medicine, vol. 46, No. 5 (2008), pp. 385-396. [Back]
125. Amy J. Porath-Waller, Erin Basley and Douglas J. Beirnes, "A meta-analytic review of school-based prevention for cannabis use", Health Education and Behavior, vol. 37, No. 5 (2010), pp. 709-723. [Back]
126. Foxcroft and Tsertsvadze, "Universal School-Based Prevention Programs for Alcohol Misuse in Young People" (see footnote 122). [Back]
127. Porath-Waller, Basley and Beirnes, "A meta-analytic review of school-based prevention for cannabis use" (see footnote 125). [Back]
128. Spoth, Greenberg and Turrisi, "Preventive interventions addressing underage drinking" (see footnote 109). [Back]
129. Faggiano and others, "School-based prevention for illicit drugs use: a systematic review" (see footnote 124). [Back]
131. M. Lemstra and others, "A systematic review of school-based marijuana and alcohol prevention programs targeting adolescents aged 10-15", Addiction Research and Theory, vol. 18, No. 1 (2010), pp. 84-96. [Back]
132. Daniel T. L. Shek and Lu Yu, "Longitudinal impact of the project PATHS on adolescent risk behavior: what happened after five years?", The Scientific World Journal, vol. 2012 (2012). [Back]
133. K. E. Champion and others, "A systematic review of school-based alcohol and other drug prevention programs facilitated by computers or the Internet", Drug and Alcohol Review, vol. 32, No. 2 (2012), pp. 115-123. [Back]
134. P. J. Conrod and others, "Effectiveness of a selective, personality-targeted prevention program for adolescent alcohol use and misuse", JAMA Psychiatry, vol. 70, No. 3 (2013), pp. 334-342. [Back]
135. P. Lucas and others, "Financial benefits for child health and well-being in low income or socially disadvantaged families in developed world countries", Cochrane Database of Systematic Reviews, No. 2 (2008). [Back]
136. A. Petrosino and others, Interventions in Developing Nations for Improving Primary and Secondary School Enrollment of Children: A Systematic Review, Campbell Systematic Reviews, No. 19 (2012). [Back]
137. C. Bonell and A. Fletcher, "Improving school ethos may reduce substance misuse and teenage pregnancy", BMJ, No. 334 (2007), pp. 614-616. [Back]
138. A. Fletcher, C. Bonell and J. Hargreaves, "School effects on young people's drug use: a systematic review of intervention and observational studies", Journal of Adolescent Health, vol. 42, No. 3 (2008), pp. 209-220. [Back]
139. A. M. Roche and others, "Drug testing in Australian schools: policy implications and considerations of punitive, deterrence and/or prevention measures", International Journal of Drug Policy, vol. 20, No. 6 (2009), pp. 521-528. [Back]
140. Daniel T. L. Shek, "School drug testing: a critical review of the literature", Scientific World Journal, vol. 10 (2010), pp. 356-365. [Back]
141. J. M. Cronce and M. E. Larimer, "Individual-focused approaches to the prevention of college student drinking", Alcohol Research and Health, vol. 34, No. 2 (2011), pp. 210-221. [Back]
142. M. T. Moreira, L. A. Smith and D. Foxcroft, "Social norms interventions to reduce alcohol misuse in university or college students", Cochrane Database of Systematic Reviews, No. 3 (2009). [Back]
143. K. B. Carey and others, "Computer-delivered interventions to reduce college student drinking: a meta-analysis", Addiction, vol. 104, No. 11 (2009), pp. 1807-1819. [Back]
144. Robert J. Tait and Helen Christensen, "Internet-based interventions for young people with problematic substance use: a systematic review", Medical Journal of Australia, vol. 192, No. 11 (2010), pp. S15-S21. [Back]
145. Allison K. Labbe and Stephen A. Maisto, "Alcohol expectancy challenges for college students: a narrative review", Clinical Psychology Review, vol. 31, No. 4 (2011), pp. 673-683. [Back]
146. G. Webb and others, "A systematic review of work-place interventions for alcohol-related problems", Addiction, vol. 104, No. 3 (2009), pp. 365-377. [Back]
147. Foxcroft and Tsertsvadze, "Universal School-Based Prevention Programs for Alcohol Misuse in Young People" (see footnote 122). [Back]
148. K. V. Carson and others, "Community interventions for preventing smoking in young people", Cochrane Database of Systematic Reviews, No. 7 (2011). [Back]
149. S. Gates and others, "Interventions for prevention of drug use by young people delivered in non-school settings", Cochrane Database of Systematic Reviews, No. 1. (2009). [Back]
150. J. D. Hawkins and others, "Youth problem behaviors 8 years after implementing the communities that care prevention system: a community-randomized trial", JAMA Pediatrics, vol. 168, No. 2 (2014), pp. 122-129. [Back]
151. R. Spoth, and others, "PROSPER community-university partnership delivery system effects on substance misuse through 6 1/2 years past baseline from a cluster randomized controlled intervention trial", Preventive Medicine, vol. 56, Nos. 3 and 4 (2013), pp. 190-196. [Back]
152. D. P. Hopkins and others, "Reviews of evidence regarding interventions to reduce tobacco use and exposure to environmental tobacco smoke", American Journal of Preventive Medicine, vol. 20, No. 2, Suppl. No. 1 (2001), pp. 16-66. [Back]
153. R. W. Elder and others, "The effectiveness of tax policy interventions for reducing excessive alcohol consumption and related harms", American Journal of Preventive Medicine, vol. 38, No. 2 (2010), pp. 217-229. [Back]
154. Alexander C. Wagenaar and Traci L. Toomey, "Effects of minimum drinking age laws: review and analyses of the literature from 1960 to 2000", Journal of Studies on Alcohol, Suppl. No. 14 (2002), pp. 206-225. [Back]
155. A. Calafat, J. Montse and M. A. Duch, "Preventive interventions in nightlife: a review", Adicciones, vol. 21, No. 4 (2009), pp. 387-414. [Back]
156. S. Geidne, M. Quennerstedt and C. Eriksson, "The youth sports club as a health-promoting setting: an integrative review of research", Scandinavian Journal of Public Health, vol. 41, No. 3 (2013), pp. 269-283. [Back]
157. Joseph A. Durlak, Roger P. Weissberg and Molly Pachan, "A meta-analysis of after-school programs that seek to promote personal and social skills in children and adolescents", American Journal of Community Psychology, vol. 45, Nos. 3 and 4 (2010), pp. 294-309. [Back]
158. D. L. DuBois and others, "Effectiveness of mentoring programs for youth: a meta-analytic review", American Journal of Community Psychology, vol. 30, No. 2 (2002), pp. 157-197. [Back]
159. R. E. Thomas, D. Lorenzetti and W. Spragins, "Mentoring adolescents to prevent drug and alcohol use", Cochrane Database of Systematic Reviews, No. 2 (2011). [Back]
160. L. Bolier and others, "Alcohol and drug prevention in nightlife settings: a review of experimental studies", Substance Use and Misuse, vol. 46, No. 13 (2011), pp. 1569-1591. [Back]
161. I. Brennan and others, "Interventions for disorder and severe intoxication in and around licensed premises, 1989-2009", Addiction, vol. 106, No. 4 (2011), pp. 706-713. [Back]
162. Bolier and others, "Alcohol and drug prevention in nightlife settings" (see footnote 160) [Back]
163. Lindsay F. Stead and Tim Lancaster, "Interventions for preventing tobacco sales to minors", Cochrane Database of Systematic Reviews, No. 1 (2005). [Back]
164. Joseph R. DiFranza, "Which interventions against the sale of tobacco to minors can be expected to reduce smoking?", Tobacco Control, vol. 21, No. 4 (2012), pp. 436-442. [Back]
165. T. Carney and others, "Brief school-based interventions and behavioural outcomes for substance-using adolescents", Cochrane Database of Systematic Reviews, No. 2 (2014). [Back]
166. E. Barnett and others, "Motivational interviewing for adolescent substance use: a review of the literature", Addictive Behaviors, vol. 37, No. 2 (2012), pp. 1325-1334. [Back]
167. E. Bernstein and others, "Screening and brief intervention to reduce marijuana use among youth and young adults in a pediatric emergency department", Academic Emergency Medicine, vol. 16, No. 11 (2009), pp. 1174-1185. [Back]
168. D. P. Hopkins and others, "Reviews of evidence regarding interventions to reduce tobacco use and exposure to environmental tobacco smoke", American Journal of Preventive Medicine, vol. 20, No. 2, Suppl. No. 1 (2001), pp. 16-66. [Back]
169. M. Ferri and others, "Media campaigns for the prevention of illicit drug use in young people", Cochrane Database of Systematic Reviews, No. 6 (2013). [Back]
170. D. Werb and others, "The effectiveness of anti-illicit-drug public-service announcements: a systematic review and meta-analysis", Journal of Epidemiology and Community Health, vol. 65, No. 10 (2011), pp. 834-840. [Back]
171. Based on the responses to the annual report questionnaire on availability and coverage of drug treatment services. See also E/CN.7/2015/3. [Back]
172. UNODC and WHO, "Principles of drug dependence treatment", discussion paper, March 2008. [Back]
173. Michael Dennis and Christy K. Scott, "Managing addiction as a chronic condition", Addiction Science and Clinical Practice Perspectives, vol. 4, No. 1 (2007), pp. 45-55. [Back]
175. A. Thomas McLellan and others, "Reconsidering the evaluation of addiction treatment: from retrospective follow-up to concurrent recovery monitoring", Addiction, vol. 100, No. 4 (2005), pp. 447-458. [Back]
176. Y. I. Hser and others, "Drug treatment careers: a conceptual framework and existing research findings", Journal of Substance Abuse Treatment, vol. 14, No. 6 (1997), pp. 543-558. [Back]
177. R. L. Stout and others, "Optimizing the cost-effectiveness of alcohol treatment: a rationale for extended case monitoring", Addictive Behaviors, vol. 24, No. 1 (1999), pp. 17-35. [Back]
178. Thomas Bien, William R. Miller and J. Scott Tonigan, "Brief intervention for alcohol problems: a review", Addiction, vol. 88, No. 3 (1993), pp. 315-335. [Back]
179. Sondra Burman, "The challenge of sobriety: natural recovery without treatment and self-help programs", Journal of Substance Abuse, vol. 9 (1997), pp. 41-61. [Back]
180. United States, Department of Health and Human Services, National Institute on Drug Abuse, Principles of Drug Addiction Treatment: A Research-based Guide, 3rd ed., NIH publication No. 12-4180 (2012). [Back]
183. S. F. Greenfield and others, "Substance abuse treatment entry, retention, and outcome in women: a review of the literature", Drug and Alcohol Dependence, vol. 86, No. 1 (2007), pp. 1-21. [Back]
184. R. E. Claus and others, "Does gender-specific substance abuse treatment for women promote continuity of care?", Journal of Substance Abuse Treatment, vol. 32, No. 1 (2007), pp. 27-39. [Back]
185. United Kingdom, National Health Services, National Treatment Agency for Substance Misuse, "Women in drug treatment: what the latest figures reveal", March 2010. [Back]
186. Y. I. Hser and others, "An evaluation of drug treatments for adolescents in 4 US cities", Archives of General Psychiatry, vol. 58, No. 7 (2001) , pp. 689-695. [Back]
187. Kimberly R. Martin, "Adolescent treatment programs reduce drug abuse, produce other improvements", NIDA Notes, vol. 17, No. 1 (2002) . [Back]
189. Paul G. Barnett and Ralph W. Swindle, "Cost-effectiveness of inpa-tient substance abuse treatment", Health Services Research, vol. 32, No. 5 (1997), pp. 615-629. [Back]
190. Paul G. Barnett and Stanley S. Hui, "The cost-effectiveness of methadone maintenance", The Mount Sinai Journal of Medicine, vol. 67, Nos. 5 and 6 (2000), pp. 365-374. [Back]
191. L. W. Gerson and others, "Medical care use by treated and untreated substance abusing medicaid patients", Journal of Substance Abuse Treatment, vol. 20, No. 2 (2001), pp. 115-120. [Back]
192. William S. Cartwright, "Economic costs of drug abuse: financial, cost of illness, and services", Journal of Substance Abuse Treatment, vol. 34, No. 2 (2008), pp. 224-233. [Back]
193. United States, Department of Health and Human Services, National Institute on Drug Abuse, Principles of Drug Addiction Treatment for Criminal Justice Populations: A Research-based Guide, 3rd ed., NIH publication No. 11-5316 (April 2014), pp. 26-28. [Back]
194. S. L. Ettner and others, "Benefit-cost in the California treatment outcome project: does substance abuse treatment 'pay for itself'?", Health Services Research, vol. 41, No. 1 (2006), pp. 192-213. [Back]
195. United Kingdom, National Health Services, National Treatment Agency for Substance Misuse, "Falling drug use: the impact of treatment", December 2012. [Back]
196. Report of the International Narcotics Control Boardfor 2013 (E/ INCB/2013/1). [Back]
197. McLellan and others, "Reconsidering the evaluation of addiction treatment" (see footnote 175). [Back]
200. Betty Ford Institute Consensus Panel, "What is recovery? A working definition from the Betty Ford Institute", Journal of Substance Abuse Treatment, vol. 33, No. 3 (2007), pp. 221-228. [Back]
201. McLellan and others, "Reconsidering the evaluation of addiction treatment" (see footnote 175). [Back]
202. WHO Quality of Life Assessment Group, "The World Health Organization Quality of Life assessment (WHOQOL): position paper from the World Health Organization", Social Science and Medicine, vol. 41, No. 10 (1995), pp. 1403-1409. [Back]
203. Alexandre B. Laudent, "The case for considering quality of life in addiction research and clinical practice", Addiction Science and Clinical Practice, vol. 6, No. 1 (2001), pp. 44 and 45. [Back]
204. McLellan and others, "Reconsidering the evaluation of addiction treatment" (see footnote 175). [Back]
205. UNODC and WHO, "The joint UNODC-WHO programme on drug dependence treatment and care" (2009). [Back]
206. C. Boyd and others, "Clarifying multimorbidity to improve targeting and delivery of clinical services for medicaid populations", Faces of Medicaid Data Series (Hamilton, New Jersey, Center for Health Care Strategies, December 2010). [Back]
207. W. M. Compton and others, "Prevalence, correlates, disability, and comorbidity of DSM-IV drug abuse and dependence in the United States: results from the National Epidemiologic Survey on Alcohol and Related Conditions", Archives of General Psychiatry, vol. 64, No. 5 (2007), pp. 566-576. [Back]
208. United States of America, Department of Health and Human Services, Substance Abuse and Mental Health Services Administration, Results from the 2011 National Survey on Drug Use and Health: Summary of National Findings, NSDUH Series H-44, DHHS Publication No. (SMA) 12-4713 (Rockville, Maryland, 2012). [Back]
209. D. Ernst, W. R. Miller and S. Rollnick, "Treating substance abuse in primary care: a demonstration project", International Journal of Integrated Care, vol. 7 (2007). [Back]
210. C. M. Delos Reyes, "Overcoming pessimism about treatment of addiction", Journal of the American Medical Association, vol. 287, No. 14 (2002), p. 1857. [Back]
211. Bridget M. Kuehn, "Despite benefit, physicians slow to offer brief advice on harmful alcohol use", Journal of the American Medical Association, vol. 299, No. 7 (2008), pp. 751-753. [Back]
212. Brian Vastag, "Addiction poorly understood by clinicians", Journal of the American Medical Association, vol. 290, No. 10 (2003), pp. 1299-1303. [Back]
213. Ernst, Miller and Rollnick, "Treating substance abuse in primary care" (see footnote 39). [Back]
214. B. K. Madras and others, "Screening, brief interventions, referral to treatment (SBIRT) for illicit drug and alcohol use at multiple healthcare sites: comparison at intake and 6 months later", Drug Alcohol Dependence, vol. 99, Nos. 1-3 (2009), pp. 280-295. [Back]
215. T. F. Babor and others, "Screening, brief intervention, and referral to treatment (SBIRT): toward a public health approach to the management of substance abuse", Substance Abuse, vol. 28, No. 3 (2007), pp. 7-30. [Back]
216. R. Saitz and others, "Screening and brief intervention for unhealthy drug use in primary care settings: randomized clinical trials are needed", Journal of Addiction Medicine, vol. 4, No. 3 (2010), pp. 123-130. [Back]
217. Constance Weisner and others, "Integrating primary medical care with addiction treatment: a randomized controlled trial", Journal of the American Medical Association, vol. 286, No. 14 (2001), pp. 1715-1723. [Back]
218. S. Butterfield, "Treat addicted patients for the long-term", American College of Physicians Internist, June 2009. [Back]
219. J. R. Mertens and others, "The role of medical conditions and primary care services in 5-year substance use outcomes among chemical dependency treatment patients", Drug Alcohol Dependence, vol. 98, Nos. 1 and 2 (2008), pp. 45-53. [Back]
220. M. L. Willenbring, S. H. Massey and M. B. Gardner, "Helping patients who drink too much: an evidence-based guide for primary care physicians", American Family Physician, vol. 80, No. 1 (2009), pp. 44-50. [Back]
221. S. Coulton, "Alcohol misuse", American Family Physician, vol. 79, No. 8 (2009), pp. 692-694. [Back]
222. William E. Cayley Jr., "Effectiveness of brief alcohol interventions in primary care", American Family Physician, vol. 79, No. 5 (2009), pp. 370 and 371. [Back]
223. Willenbring, Massey and Gardner, "Helping patients who drink too much" (see footnote 220). [Back]
224. Coulton, "Alcohol misuse", (see footnote 221). [Back]
225. Weisner and others, "Integrating primary care with addiction treatment" (see footnote 217). [Back]
226. Peter D. Friedmann and others, "Do mechanisms that link addiction treatment patients to primary care influence subsequent utilization of emergency and hospital care?", Medical Care, vol. 44, No. 1 (2006), pp. 8-15. [Back]
227. UNODC, World Drug Report 2014. [Back]
228. For the purposes of the present report, the analysis of NPS includes ketamine, which differs from other NPS in that it is widely used in human and veterinary medicine, while most NPS have little or no history of medical use. [Back]
229. The present section is based on data from the individual drug seizure database. Reporting countries are asked to provide information on the country where the drugs were obtained (or, in the case of unaccompanied shipments, the departure country). For the purposes of this section, such locations are considered to be transit points of the drug. [Back]
230. The present section is based on data from the individual drug seizure database. [Back]
231. UNODC, Southeast Asia Opium Survey: Lao People's Democratic Republic and Myanmar 2014 (Bangkok, 2014). [Back]
232. UNODC updated the conversion ratio from opium to heroin in 2014 and estimated export quality heroin to have a purity of 52 per cent. The updated conversion ratio is 9.6 kg of opium for the production of 1 kg of export quality heroin (52 per cent purity). For details, see Afghanistan Opium Survey 2014: Cultivation and Production, p. 35. [Back]
233. Islamic Republic of Iran, Drug Control Headquarters, Drug Control in 2013 (March 2014). [Back]
234. For Armenia, see UNODC, The Illicit Drug Trade through South Eastern Europe, 2014, footnote 12. For Georgia, see "Regional report on Eastern Europe and Caucasus" of the Council of the European Union, p. 7, dated 17 December 2014. [Back]
235. UNODC, The Illicit Drug Trade through South-Eastern Europe (2014). [Back]
236. UNODC, World Drug Report 2014. [Back]
237. Responses to annual report questionnaire for 2013 and UNODC, Afghan Opiate Trafficking through the Southern Route, 2015 (Vienna, 2015). [Back]
238. UNODC, Afghan Opiate Trafficking through the Southern Route, 2015 (Vienna, 2015). [Back]
239. United States, Drug Enforcement Administration (DEA), Drug Trafficking from Southwest Asia: Drug Intelligence Report (August 1994). [Back]
240. UNODC, Transnational Organized Crime in Eastern Africa: A Threat Assessment (Vienna, September 2013), p. 23. [Back]
241. Combined Maritime Forces is a multinational naval partnership that operates in international waters, encompassing some of the world's most important shipping lanes in the Indian Ocean and adjoining bodies of water. [Back]
242. UNODC, Afghan Opiate Trafficking through the Southern Route, 2015 (Vienna, 2015). [Back]
243. UNODC, World Drug Report 2014. [Back]
244. United States, SAMHSA, Center for Behavioral Health Statistics and Quality, Results from the 2013 National Survey on Drug Use and Health: Detailed Tables, NSDUH Series H-46, HHS Publication No. SMA 13-4795 (Rockville, Maryland, 2014), tables 7.20B and 7.30B. [Back]
245. United States, Executive Office of the President, National Drug Control Strategy: Data Supplement 2014 (Washington, D.C., 2014). [Back]
246. United States, SAMHSA, Drug Abuse Warning Network, 2011: National Estimates of Drug-Related Emergency Department Visits, HHS Publication No. SMA 13-4760 (Rockville, Maryland, 2013). [Back]
247. United States, DEA, National Drug Threat Assessment Summary (November 2013). [Back]
248. Country report submitted by Mexico to the Twenty-fourth Meeting of Heads of National Drug Law Enforcement Agencies, Latin America and the Caribbean (October 2014). [Back]
249. "In 2012, heroin from South America accounted for 51 per cent (by weight) of the heroin analysed through the DEA Heroin Signature Program, while heroin from Mexico accounted for 45 per cent and heroin from South-West Asia accounted for 4 per cent"; see United States, DEA, National Drug Threat Assessment Summary, 2014 (November 2014), p. 9. [Back]
250. UNODC, responses to the annual report questionnaire submitted by the United States for 2011 and 2012. [Back]
251. United States, DEA, National Drug Threat Assessment Summary, 2014 (November 2014). [Back]
252. UNODC, Afghan Opiate Trafficking through the Southern Route, 2015 (Vienna, 2015). [Back]
253. UNODC Vienna southern route study conference: view from Canada, presentation by the Royal Canadian Mounted Police, UNODC regional workshop on Afghan opiate trafficking on the southern route (Vienna, March 2014). [Back]
254. Canada, Royal Canadian Mounted Police, Report on the Illicit Drug Situation in Canada, 2009 (Ottawa, 2009). [Back]
255. UNODC, Afghan Opiate Trafficking through the Southern Route, 2015 (Vienna, 2015). [Back]
256. Australian Institute of Health and Welfare, 2013 National Drug Strategy Household Survey Report, Drug Statistics Series No. 28 (Canberra, 2014). [Back]
257. Australian Crime Commission, Illicit Drug Data Report 2012-13. [Back]
258. Turkish National Police, Department of Anti-Smuggling and Organized Crime, Turkish Drug Report 2013 (Ankara, 2014). [Back]
259. UNODC, responses to annual report questionnaire by Russian Federation 2012-2013. [Back]
260. UNODC, Afghan Opiate Trafficking through the Southern Route, 2015 (Vienna, 2015). [Back]
261. EMCDDA, European Drug Report 2014. [Back]
262. Charlotte Davies and Rosemary Murray, 2013 National Report (2012 Data) to the EMCDDA by the Reitox National Focal Point: United Kingdom — New Development and Trends (London, United Kingdom Focal Point on Drugs, 2014). [Back]
263. UNODC, responses to annual report questionnaire by the United Kingdom. [Back]
264. UNODC, Afghan Opiate Trafficking through the Southern Route, 2015 (Vienna 2015). [Back]
265. UNODC, World Drug Report 2010 (United Nations publication, Sales No. E.10.XI.13). [Back]
266. Even more confusingly, at times traffickers seem to use western China as a transit zone between Pakistan and Central Asia (based on seizure data reported by the World Customs Organization). [Back]
267. Country report submitted by China to the Thirty-eighth Meeting of Heads of National Drug Law Enforcement Agencies, Asia and the Pacific. [Back]
268. UNODC and Colombia, Colombia: Coca Cultivation Survey 2013 (Bogota, June 2014). [Back]
269. The methodology used to estimate potential cocaine production was adjusted and thus not comparable with the last report. For more information on the adjustment, see Colombia: Coca Cultivation Survey 2013 cited above. [Back]
270. United States, DEA, National Drug Threat Assessment Summary, 2013 (November 2013). [Back]
271. Country report submitted by Brazil to the Twenty-fourth Meeting of Heads of National Drug Law Enforcement Agencies, Latin America and the Caribbean. [Back]
272. UNODC, annual report questionnaire, replies submitted by Venezuela for 2013 and country report submitted by Venezuela to the Twenty-fourth Meeting of Heads of National Drug Law Enforcement Agencies, Latin America and the Caribbean. [Back]
273. France, Poland and Spain. [Back]
274. Australian Institute of Health and Welfare, 2013 National Drug Strategy Household Survey Report (see footnote 256). [Back]
275. UNODC, annual report questionnaire by the Russian Federation, 2013; EMCDDA and Europol, EU Drug Markets Report: a Strategic Analysis (Luxembourg, Publications Office of the European Union, 2013). [Back]
276. Country report submitted by the United Republic of Tanzania to the Twenty-fourth Meeting of Heads of National Drug Law Enforcement Agencies, Africa. [Back]
277. UNODC and Ministry of Counter Narcotics of Afghanistan, Afghanistan: Opium Survey 2013 (December, 2013). [Back]
278. L. D. Johnston, and others, Monitoring the Future National Survey Results on Drug Use: 1975-2014: Overview, Key Findings on Adolescent Drug Use (Institute for Social Research, University of Michigan, 2015). [Back]
279. Z. Mehmedic and others, "Potency trends of Δ9-THC and other cannabinoids in confiscated cannabis preparations from 1993 to 2008", Journal of Forensic Sciences, vol. 55, No. 5, pp. 1209-1217. [Back]
280. UNODC, World Drug Report 2014. [Back]
281. Country report submitted by Mexico to the Twenty-fourth Meeting of Heads of National Drug Law Enforcement Agencies, Latin America and the Caribbean. [Back]
282. Country report submitted by Paraguay to the Twenty-fourth Meeting of Heads of National Drug Law Enforcement Agencies, Latin America and the Caribbean. [Back]
283. UNODC, responses to annual report questionnaire by Brazil, 2012-2013 [Back]
284. EMCDDA, "Perspectives on drugs: new developments in Europe's cannabis market", 27 May 2014. [Back]
285. EMCDDA, European Drug Report 2014. [Back]
286. EMCDDA and Europol, EU Drug Markets Report: a Strategic Analysis (Luxembourg, 2013). [Back]
288. Australian National Drugs Strategy Household Surveys (NDSHS) http://www.aihw.gov.au/alcohol-and-other-drugs/ndshs/ [Back]
289. Australian Crime Commission, Illicit Drug Data Report 2012-13. [Back]
290. W. Swift and others, "Analysis of cannabis seizures in NSW, Australia: cannabis potency and cannabinoid profile", PLOS ONE, vol. 8, No. 7 (2013). [Back]
291. Report of the Twenty-fourth Meeting of Heads of National Drug Law Enforcement Agencies, Africa (UNODC/HONLAF/24/5). [Back]
292. Country report submitted by Algeria to the Twenty-fourth Meeting of Heads of National Drug Law Enforcement Agencies, Africa. [Back]
293. For the purpose of the present report, the term "synthetic drugs" includes ATS, the main drugs being amphetamine, methampheta-mine and "ecstasy"-type substances, and NPS. [Back]
294. For the purposes of the present report, the analysis of NPS includes ketamine, which differs from other NPS in that is widely used in human and veterinary medicine, while most NPS have little or no history of medical use. [Back]
295. UNODC, early warning advisory on NPS. [Back]
296. Based on data collected by the Drug Abuse Information Network for Asia and the Pacific. [Back]
298. United States, DEA, National Drug Threat Assessment Summary, November 2014. [Back]
301. UNODC, Global SMART Update 2014, vol. 12, (September 2014). [Back]
302. C. Bernard, B. Werse and C. Schell-Mack, MoSyD Jahresbericht 2012: Drogentrends in Frankfurt am Main (Frankfurt, Centre for Drug Research, Goethe University, 2013). [Back]
303. EMCDDA, European Drug Report 2014. [Back]
304. Turkish National Police, Turkish Report of Anti-Smuggling and Organised Crime 2013 (Ankara, June 2014). [Back]
305. EMCDDA, European Drug Report 2014. [Back]
306. Terminology and Information on Drugs (United Nations publication, Sales No. E.03.XI.14); Recommended Methods for the Identification and Analysis of Amphetamine, Methamphetamine and Their Ring-Substituted Analogues in Seized Materials: Manual for Use by National Drug Testing Laboratories (United Nations publication, Sales No. E.06.XI.1). [Back]
307. Based on expert perception on the use of main drugs of concern reflected in the Drug Abuse Information Network for Asia and the Pacific. [Back]
308. China, National Narcotics Control Commission, Annual Report on Drug Control in China 2014 (Beijing, 2014); Official communication with the National Narcotics Control Commission of China, Ministry of Public Security, November 2014; Office of the Narcotics Control Board of Thailand, "Drug situation in Thailand and trends", presented at the Thirty-eighth Meeting of Heads of National Drug Law Enforcement Agencies, Asia and the Pacific (October 2014). [Back]
309. UNODC, Patterns and Trends of Amphetamine-type Stimulants and other Drugs: Challenges for Asia and the Pacific (November 2013); UNODC, Global Synthetic Drugs Assessment: Amphetamine-type Stimulants and New Psychoactive Substances (Vienna, 2014). [Back]
310. "Indonesia country report", presented by the National Narcotics Board of Indonesia at the Global SMART Programme regional meeting, Yangon, 20 and 21 August 2014; National Police Agency of Japan, October 2014; Malaysia drug situation report, presented by the Royal Malaysian Police at the Twenty-fourth Anti-Drug Liaison Officials' Meeting for International Cooperation, Jeju, Republic of Korea, 1-3 October 2014; and "Thailand country report", presented by the Office of the Narcotics Control Board of Thailand at the Nineteenth Asia-Pacific Operational Drug Enforcement Conference, held in Tokyo from 18 to 20 February 2014. [Back]
311. Information provided by International Safety and Security Cooperation Division, Ministry of Foreign Affairs, Japan, August 2014; National Police Agency of Japan, October 2014. [Back]
312. Presentation by the Philippine Drug Enforcement Agency at the Nineteenth Asia-Pacific Operational Drug Enforcement Conference, held in Tokyo from 18 to 20 February 2014; presentation by the Supreme Prosecutors' Office of the Republic of Korea, at the Global SMART Programme regional meeting, Yangon, 20 and 21 August 2014; presentation by the Australian Federal Police at the Nineteenth Asia-Pacific Operational Drug Enforcement Conference, held in Tokyo from 18 to 20 February 2014. [Back]
313. United States, DEA, National Drug Threat Assessment Summary, 2014 (November 2014). [Back]
315. Australian Federal Police, "Media release: drugs worth $1.5 billion seized by Joint Organized Crime Group", 29 November 2014. [Back]
316. Official government communication by the Central Committee for Drug Abuse Control of Myanmar, March 2015. [Back]
317. Indonesia, National Narcotics Board, Journal of Data on the Prevention and Eradication of Drug Abuse and Illicit Trafficking: Year 2013 (Jakarta, June 2014). [Back]
318. The calculation for East and South-East Asia is based on the conversion ratios provided by the International Narcotics Control Board; Precursors and Chemicals Frequently Used In The Illicit Manufacture Of Narcotic Drugs And Psychotropic Substances: Report ofthe International Narcotics Control Board for 2012 on the Implementation of Article 12 of the United Nations Convention against Illicit Traffic in Narcotic Drugs and Psychotropic Substances of 1988 (E/ INCB/2013/4). [Back]
319. For more information, see UNODC, The Challenge of New Psycho-active Substances (Vienna, March 2013). [Back]
320. United States, National Institute on Drug Abuse, Monitoring the Future: National Survey Results on Drug Use 1975-2014. [Back]
321. D. Perrone, R. D. Helgesen and R. G. Fischer, "United States drug prohibition and legal highs: how drug testing may lead cannabis users to spice", Drugs: Education, Prevention, and Policy, vol. 20, No. 3 (2013), pp. 216-224. [Back]
322. While no clear link has yet been established, government activities aimed at raising awareness about the health risks associated with using NPS and the introduction of national controls for mephedrone, scheduled as a class B drug under the Misuse of Drugs Act in 2010, took place simultaneously. [Back]
323. United Kingdom, Home Office, Drug Misuse Declared: Findings from the 2012/13 Crime Survey for England and Wales (July 2013). [Back]
324. A. E. Vento and others, "Substance use in the club scene of Rome: a pilot study", BioMed Research International, vol. 2014, (2014), pp. 1-5. [Back]
325. EMCDDA, "Perspectives on drugs: injection of synthetic cathinones", Perspectives on Drugs Series, 27 May 2014. [Back]
326. A. Pérterfi and others, "Changes in patterns of injecting drug use in Hungary: a shift to synthetic cathinones", Drug Testing and Analysis, vol. 6, Nos. 7 and 8 (2014), pp. 825-831. [Back]
328. Marion Weigl and others, 2012 National Report (2011 Data) to the EMCDDA by the Reitox National Focal Point: Austria — New Development, Trends and In-Depth Information on Selected Issues (Vienna, Gesundheit Österreich GmbH, 2012). [Back]
329. 4-MEC is the chemical abbreviation of 4-methylethcathinone, a synthetic cathinone not under international control. [Back]
330. T. Néfau and others, "Drug analysis of residual content of used syringes: a new approach for improving knowledge of injected drugs and drug user practices", International Journal of Drug Policy, vol. 26, No. 4, pp. 412-419. [Back]
331. EMCDDA, "Perspectives on drugs: injection of synthetic cathinones", Perspectives on Drugs Series, 27 May 2014. [Back]
332. D. M. Wood and others, "Using poisons information service data to assess the acute harms associated with novel psychoactive substances", Drug Testing and Analysis, vol. 6, Nos. 7 and 8 (2014), pp. 850-860. [Back]
333. A. Helander and others, "Detection of new psychoactive substance use among emergency room patients: results from the Swedish STRIDA project", Forensic Science International, vol. 243 (2014), pp. 23-29. [Back]
334. EMCDDA website, publication search. [Back]
335. All data in the present section of this report were extracted from the UNODC early warning advisory on NPS, available at www.unodc.org/nps, unless otherwise indicated. [Back]
336. For more information, see UNODC, "Synthetic cannabinoids in herbal products" (Vienna, 2011). [Back]
337. 5-Methoxy-N,N-dipropyltryptamine (5-MeO-DPT) is a tryptamine not under international control. [Back]
338. See Recommended Methods for the Identification and Analysis of Synthetic Cannabinoid Receptor Agonists in Seized Material: Manual for Use by National Drug Analysis Laboratories (ST/NAR/48). [Back]
Notes to Chapter II:
1. Action Plan on International Cooperation on the Eradication of Illicit Drug Crops and on Alternative Development (General Assembly resolution S-20/4 E). [Back]
2. Annex II (see the online version of this report) contains an overview of the most important events that have taken place since 2001. [Back]
3. See the Political Declaration adopted by the General Assembly at its twentieth special session (General Assembly resolution S-20/2, annex), para. 18. [Back]
4. E/INCB/2005/1, para. 23. [Back]
5. See David Mansfield, "Development in a drugs environment: a strategic approach to 'alternative development'", a discussion paper by the Development-oriented Drug Control Programme (DDC)" (Eschborn, Germany, 2006). [Back]
6. United Nations International Drug Control Programme, "Alternative development as an instrument of drug abuse control", Technical Information Paper, No. 5 (1993). [Back]
7. In 1997, UNDCP and the Centre for International Crime Prevention (CICP) were merged to form the United Nations Office for Drug Control and Crime Prevention (UNODCCP), which was renamed UNODC in October 2002. [Back]
8. For example, the Alternative Livelihoods Program sponsored by the United States Agency for International Development (USAID), launched in December 2004, and the Research in Alternative Livelihoods Fund (for Afghanistan for the period 2004-2008), funded by the Department for International Development of the United Kingdom of Great Britain and Northern Ireland. [Back]
9. General Assembly resolution 68/196, para. 18 (u). [Back]
10. German Agency for International Cooperation (GIZ), "Rethinking the approach of alternative development: principles and standards of rural development in drug producing areas", 2nd ed. (2013). [Back]
11. For example, the Chapare regional development project in the Plurinational State of Bolivia, which was initiated in 1983 by USAID and the Government of the Plurinational State of Bolivia. [Back]
12. For example, the UNODC food security programme for Myanmar, sponsored by the European Union, started in January 2009, and the Phongsaly alternative livelihood and food security project of UNODC, started in January 2011. [Back]
13. UNDCP, "Alternative development as an instrument of drug abuse control". [Back]
16. Ronald D. Renard, Opium Reduction in Thailand 1970-2000: A Thirty-year Journey (Chiang Mai, Thailand, Silkworm Books, 2001), pp. 69-80. [Back]
17. David Mansfield, "Alternative development: the modern thrust of supply-side policy", in Bulletin on Narcotics, vol. LI, Nos. 1 and 2 (1999), pp. 19-43. [Back]
18. The concept of "integrated rural development" was also referred to in the United Nations Convention against Illicit Traffic in Narcotic Drugs and Psychotropic Substances of 1988, article 14, para. 3. [Back]
19. Carlos Zorro Sanchez, "Algunos desafíos del desarrollo alternativo en Colombia", Pensamiento y Cultura, vol. 8, No. 1 (2005), p. 112; Colombia, Department of National Planning, "Programa de desar-rollo alternativo", document CONPES No. 2734 (Bogota, 1994), sect. B. [Back]
20. See, for example, the Proyecto de Desarrollo Regional Chapare (19831992); Fernando B. Salazar Ortuno, "Límites de los programas de desarrollo alternativo" in De la Coca al Poder: Politicas Públicas de Sustitución de la Economía de la Coca y Pobreza en Bolivia, 19752004 (Buenos Aires, Consejo Latinoamericano de Ciencias Sociales-CLACSO, 2008), p. 245. [Back]
21. UNDCP, "Alternative development as an instrument of drug abuse control". [Back]
23. Mansfield, "Alternative development: the modern thrust of supply-side policy". [Back]
24. Renard, Opium Reduction in Thailand 1970-2000, pp. 95-97 and 109-111. [Back]
25. UNDCP, "Alternative development as an instrument of drug abuse control". [Back]
26. Mansfield, "Alternative development: the modern thrust of supply-side policy". [Back]
27. UNDCP, Alternative Development in the Andean Area: The UNDCP Experience, revised edition (United Nations publication, Sales No. E.01.XI.4). [Back]
28. Colombia, Department of National Planning, "Programa de desarrollo alternativo". [Back]
29. Alternative Development in the Andean Area: The UNDCP Experience, revised edition. [Back]
30. For example, the USAID-funded projects under the 1991 alternative development strategy in areas such as Chapare and the associated Valles Altos; and USAID/Plurinational State of Bolivia, "Alternative development strategy" (1991), pp. 2-3. [Back]
31. Afghanistan, Ministry of Counter Narcotics, "National drug control strategy: an updated five-year strategy for tackling the illicit drug problem", (Kabul, January 2006), p. 21. [Back]
32. David Mansfield and Adam Pain, "Alternative livelihoods: substance or slogan?" Briefing Paper Series (Kabul, Afghanistan Research and Evaluation Unit, October 2005), p. 10. [Back]
34. Afghanistan, Ministry of Counter Narcotics, "National drug control strategy: an updated five-year strategy for tackling the illicit drug problem", p. 40. [Back]
35. Council of the European Union, "The EU approach on alternative development", Cordrogue No. 44 (18 May 2006); Peru, Office of the President of the Council of Ministers and the National Commission for Development and Life without Drugs (DEVIDA), Estrategia Nacional de Lucha contra las Drogas 2012-2016 (February 2012); Colombia, Department of National Planning, Política Nacional de Erradicación Manual de Cultivos Ilícitos y Desarrollo Alternativo para la Consolidación Territorial, document CONPES No. 3669 (Bogota, 2010), p. 8. [Back]
36. See the methodology section in the online version of this report. [Back]
37. A first review of such statistics and a historical overview of the involvement of the OECD Development Assistance Committee in alternative development and narcotics control activities can be found in William Hynes and Deborah Alimi, "Why illicit drugs cannot be ignored in the post-2015 development agenda", document DCD/DAC/GOVNET (2014) 7, revised edition (November 2014). [Back]
38. The figures for the category "narcotics control" include "development-related" anti-narcotics activities such as educational programmes and awareness-raising campaigns to restrict distribution of illicit drugs, as well as training of police and customs officers. Not included here are donor activities to destroy crops, interdict drug supplies or train and finance military personnel in anti-narcotics activities. See the purpose codes of the OECD Creditor Reporting System Aid Activities database (valid for reporting up to and including 2014 flows), available at www.oecd.org. [Back]
39. The 28 countries of the OECD Development Assistance Committee are Australia, Austria, Belgium, Canada, Czech Republic, Denmark, Finland, France, Germany, Greece, Iceland, Ireland, Italy, Japan, the Republic of Korea, Luxembourg, the Netherlands, New Zealand, Norway, Poland, Portugal, Slovakia, Slovenia, Spain, Sweden, Switzerland, United Kingdom and the United States. In addition, the European Union is a member of the Committee. [Back]
40. The application of the "non-agricultural alternative development" category has been proscribed in OECD Creditor Reporting System purpose codes (valid for reporting up to and including 2014 flows; available at www.oecd.org), to be applied for "projects to reduce illicit drug cultivation through, for example, non-agricultural income opportunities, social and physical infrastructure". [Back]
41. Colombia, Department of National Planning, Política Nacional de Erradicación Manual de Cultivos Ilícitos y Desarrollo Alternativo para la Consolidación Territorial, p. 9. [Back]
44. Colombia, Department for Social Prosperity and the Administrative Unit for Territorial Consolidation, "Pescadores de los palafitos de la ciánaga grande pasaron de víctimas a productores", August 2013. Available at www.consolidacion.gov.co. [Back]
45. Daniel Brombacher, "Informe final: asesor�a de proyecto—recomendaciones para el establecimiento de una línea de base", report on project BOL/I79 (sustainable and integrated management of natural resources in the tropics of Cochabamba and the Yungas of La Paz) (Eschborn, GIZ, 28 April 2011), sect. 1.1. [Back]
46. Renard, Opium Reduction in Thailand 1970-2000, p. 167. [Back]
47. DEVIDA, Encuesta Anual de Evaluación de Impacto del Desarollo Alternativo 2013. [Back]
48. Transnational Institute, Bouncing Back: Relapse in the Golden Triangle (June 2014), pp. 7 and 65. [Back]
49. Regional evaluation report, alternative development in the South American Andes: report of findings, input for Alternative Development: A Global Thematic Evaluation—Final Synthesis Report (United Nations publication, Sales No. E.05.XI.13). [Back]
50. Mansfield, "Development in a drugs environment: a strategic approach to 'alternative development'", p. 5. [Back]
51. UNODC and Acción Social, Voces del Campo Joven: Crónicas de Líderes Jóvenes Campesinos, Mónica Cortés Yepes and Francisco Duque Quintero, eds. (Bogotá, 2009), p. 38. [Back]
52. Project XSPK26, implemented by UNODC in Oudomxay Province, with financial assistance from Germany. [Back]
53. UNODC, Southeast Asia Opium Survey 2014 (Bangkok, 2014), p. 60. [Back]
54. UNODC, "Morocco cannabis survey 2004: executive summary" (May 2005). [Back]
55. UNODC, "Analytical brief: coca crops and human development" (February 2014). [Back]
56. UNODC and Ministry of Counter-Narcotics of Afghanistan, Afghanistan Opium Survey 2014, February 2015. [Back]
57. Alternative Development in the Andean Area: The UNDCP Experience, revised edition, p. 7. [Back]
58. UNODC, World Drug Report 2000 (United Nations publication, Sales No. GV.E.00.0.10), p. 142. [Back]
59. Regional evaluation report, alternative development in the South American Andes: report of findings, input for Alternative Development: A Global Thematic Evaluation—Final Synthesis Report, p. 9. [Back]
60. UNDCP, "Alternative development as an instrument of drug abuse control". [Back]
61. Director General of the Public Welfare Department (1964), quoted in Renard, Opium Reduction in Thailand 1970-2000, p. 47. [Back]
62. Renard, Opium Reduction in Thailand 1970-2000. [Back]
63. UNODC, "Alternative development programme in Colombia: independent evaluation" (Vienna, November 2014). [Back]
64. Regional evaluation report, alternative development in the South American Andes: report of findings, input for Alternative Development: A Global Thematic Evaluation—Final Synthesis Report, pp. 4-5. [Back]
65. Colombia, Department of National Planning, Política Nacional de Erradicación Manual de Cultivos Ilícitos y Desarrollo Alternativo para la Consolidación Territorial, p. 29. [Back]
66. Colombia, Centre for the Coordination of Integrated Action, "Plan de consolidacion integral de la Macarena" (Bogotá, August 2008). [Back]
68. David Mansfield, Examining the Impact of IDEA-NEW on Opium Production. Nangarhar: A Case Study (2015). [Back]
69. Colombia, Centre for the Coordination of Integrated Action, "Plan de consolidación integral de la Macarena", pp. 3-5. [Back]
70. Regional evaluation report, alternative development in the South American Andes: report of findings, input for Alternative Development: A Global Thematic Evaluation—Final Synthesis Report, p. 5. [Back]
71. UNODC, The Opium Economy in Afghanistan: An International Problem (New York, 2003). [Back]
72. USAID Office of Inspector General, "Audit of USAID/Afghani-stan's incentives driving economic alternatives for the North, East, and West program", Audit Report No. F-306-12-004-P (Kabul, 2012). [Back]
73. David Mansfield, Examining the Impact of IDEA-NEW on Opium Production. Nangarhar: A Case Study (2015). [Back]
74. Brombacher and others, Evaluación de medios de vida en poblaciones productoras de hoja de coca en el Valle de los ríos Apurimac y Ene, p. 28. [Back]
75. David Mansfield, "From Bad They Made It Worse": The Concentration of Opium Poppy in Areas of Conflict in the Provinces of Helmand and Nangarhar (Kabul, Afghanistan Research and Evaluation Unit, 2014). [Back]
76. Renard, Opium Reduction in Thailand 1970-2000, p. 167. [Back]
77. UNODC, "The alternative development model in San Martin: a case study on local economic development, executive summary". [Back]
78. See http://ec.europa.eu/europeaid/documents/case-studies/myanmar_food-livelihood-security_en.pdf. [Back]
79. Renard, Opium Reduction in Thailand 1970-2000, p. 139. [Back]
80. Mae Fah Luang Foundation under Royal Patronage, Aceh sustainable alternative livelihood development project in Aceh Province, Indonesia. Information available at www.maefahluang.org. [Back]
81. Information gathered through the Administrative Unit for Territorial Consolidation (Colombia). [Back]
82. UNODC, Sharing Experiences on Alternative Development from Southeast Asia and Latin America (2009). [Back]
83. Joint UNODC-Federal Ministry for Economic Cooperation and Development expert group meeting on alternative development in the framework of preparations for the special session of the General Assembly on the world drug problem to be held in 2016 and the post-Millennium Development Goals debate, held in Berlin on 19 and 20 November 2014. [Back]
84. See E/CN.7.2013/8, para. 19. [Back]
85. GIZ, "Informe sobre el control de avance del Proyecto", report on project PER/U87, sect. 2. [Back]
86. UNODC, El Modelo de Desarrollo Alternativo de la Región San Martín: Un Estudio de Caso de Desarrollo Economico Local, chap. II, sects. 7 (c) and 7 (d); and chap. VI, sect. III. [Back]
87. UNODC, Alternative Development Programme in Colombia: independent evaluation, chap. 2 (Vienna, November 2014). [Back]
88. USAID/Peru, "USAID/Peru country development cooperation strategy 2012-2016", pp. 21-22. [Back]
89. Plurinational State of Bolivia and UNODC, "The Bolivia country program 2010-2015: capacity-building in response to drugs, organized crime, terrorism, corruption and economic crime threats in Bolivia" (La Paz, March 2010), sect. V.2. [Back]
90. UNODC, "Doi Tung: thinking outside the box" (14 March 2008). [Back]
91. Colombia, Administrative Unit for Territorial Consolidation and Division for Programmes to Combat Illicit Cultivation, "Informe ejecutivo: encuentro nacional de desarrollo alternativo—Diciembre 2013" (Bogotá, March 2014), p. 55. [Back]
92. Mae Fah Luang Foundation Under Royal Patronage, "It can be done" (n.p., n.d.), p. 4. [Back]
93. Holly Ritchie, "Beyond the value chain model: deconstructing institutions key to understanding Afghan markets" in Snapshots of an Intervention: The Unlearned Lessons of Afghanistan's Decade of Assistance (2001-11), Martine van Biljert and Saria Kuovo, eds. (Kabul, Afghanistan Analysts Network, 2012). [Back]
94. General Assembly resolution S-20/4 E, para. 15. [Back]
96. E/CN.7.2012/8, para. 41. [Back]
98. Renard, Opium Reduction in Thailand 1970-2000, p. 119. [Back]
99. Official Records of the Economic and Social Council, 2009, Supplement No. 8 (E/2009/28), chap. I, sect. C., paras. 47 (f) and 47 (g). [Back]
100. Annex, appendix, paras. 9 and 15. [Back]
101. Sandro Calvani, La Coca: Pasado y Presente—Mitos y Realidades (Ediciones Aurora, Bogotá, 2007), p. 134. [Back]
102. Renard, Opium Reduction in Thailand 1970-2000, p. 108. [Back]
103. Thai-German Highland Development Programme (TG-HDP), "Review of TG-HDP's agricultural and forestry programmes, 1984-1998, with special reference to community-based natural resource management", internal paper no. 212 (Chiang Mai, Thailand, 1998). [Back]
104. UNODC, Alternative Development Programme in Colombia: independent evaluation (Vienna, November 2014). [Back]
105. Report of GIZ on project PER/U87. [Back]
106. Lessons for Future Programming: USAID/Peru's Alternative Development Program (June 2010), submitted by Weidemann Associates, Inc., to USAID/Peru, sect. I.3. [Back]
107. UNODC, "Improving livelihoods and food security through alternative development in Lao PDR", 20 December 2012. Available at www.unodc.org/southeastasiaandpacific/en/laopdr/2012/12/alternative-development/story.html. [Back]
108. Daniel Brombacher and others, Evaluación de medios de vida en poblaciones productoras de hoja de coca en el Valle de los ríos Apurimac y Ene (VRAE) (Madrid, Cooperation Programme between the European Union and Latin America on Drug Policies (COPO-LAD); Eschborn, GIZ, 2012), p. 49. [Back]
109. UNODC and Acción Social, Organizaciones que Cambian Vidas: Programa Familias Guardabosques y Programa Proyectos Productivos (Bogotá, 2008), p. 92. [Back]
110. Ibid., sect. II.2. [Back]
111. DEVIDA and UNODC, "Perú: desempeño comercial de las empresas promovidas por el desarrollo alternativo—2012" (June 2013), pp. 17-18. [Back]
112. USAID, Lessons for Future Programming, sect. I.2.1. [Back]
113. Alternative Development: A Global Thematic Evaluation—Final Synthesis Report, p. 6. [Back]
114. Peru, Office of the President of the Council of Ministers and DEVIDA, "Consultoría: evaluación del programa presupuestal desarrollo alternativo integral y sostenible—PIRDAIS 2013 -informe final" (July 2014), p. 90. [Back]
115. Renard, Opium Reduction in Thailand 1970-2000, p. 112. [Back]
116. Mae Fah Luang Foundation under Royal Patronage, "It can be done", pp. 6-7. [Back]
117. Mae Fah Luang Foundation under Royal Patronage, Aceh sustainable alternative livelihood development project in Aceh Province, Indonesia. Information available at www.maefahluang.org. [Back]
118. UNODC, World Drug Report 2000, sect. 3.3. [Back]
119. David Palmer, Szilard Fricska and Babette Wehrmann, Towards Improved Land Governance, Land Tenure Working Paper 11 (September 2009), sect. 2.2. [Back]
120. Stig Enemark, Robin McLaren and Paul van der Molen, Land Governance in Support of The Millennium Development Goals: A New Agenda for Land Professionals (Copenhagen, International Federation of Surveyors, 2010). [Back]
121. International Assessment of Agricultural Knowledge, Science and Technology for Development, Agriculture at a Crossroads: Synthesis Report, Beverly D. McIntyre and others, eds. (Washington, D.C., 2009); United Nations High-Level Task Force on the Global Food Security Crisis, "Updated Comprehensive Framework for Action" (September 2010); and Committee on World Food Security, Global Strategic Framework for Food Security and Nutrition (second version, October 2013). [Back]
122. E/CN.7/2014/CRP.7, p. 4. [Back]
123. Action Aid International and others, "Secure and equitable land rights in the post-2015 agenda: a key issue in the future we want" (January 2015). [Back]
124. Annex, appendix, para. 18 (kk). [Back]
125. "The role of alternative development in drug control and development cooperation: international conference, 7-12 January 2002, Feldafing (Munich), Germany", Federal Ministry for Economic Cooperation and Development (Germany), German Agency for Technical Cooperation and German Foundation for International Development, eds. (2002), p. 18. [Back]
126. UNODC, "Alternative Development Programme in Colombia: independent evaluation". [Back]
127. Germany, Federal Ministry for Economic Cooperation and Development, progress report on project BOLI79 (Sustainable and Integrated Management of Natural Resources in the Tropics of Cochabamba and the Yungas of La Paz) (December 2013), sect. 5.3. [Back]
129. Francisco Thoumi, Illegal Drugs, Economy, and Society in the Andes (Baltimore, Johns Hopkins University Press, 2003), pp. 196-199. [Back]
131. For more information, see www.bioredd.org/projects. [Back]
132. Alternative Development: A Global Thematic Evaluation — Final Synthesis Report, p. 7. [Back]
133. Mae Fah Luang Foundation under Royal Patronage, "It can be done", p. 13. [Back]
134. Colombia, Administrative Unit for Territorial Consolidation, Research Center on Ecosystems and Global Change and UNODC, Contribución de los Programas Familias Guardabosques y Proyectos Productivos a la Mitigación del Cambio Climático: Captura y Almacenamiento de Carbón en sistemas Prodcutivos y Bosque Neutral (Bogotá, 2012). [Back]
135. Colombia, Departamento Nacional de Planeación, Evaluación del Programa Familias Guardabosques y Grupo Movil de Erradicación: Informe Final (Bogotá, December 2012); and UNODC, "Alternative Development Programme in Colombia: independent evaluation". [Back]
136. See E/CN.7/2013/8. [Back]
137. Colombia, Departamento Nacional de Planeación, Evaluación del Programa Familias Guardabosques y Grupo Movil de Erradicación, sect. 4.1.5. [Back]
138. Daniel Brombacher, "Informe final: asesoría de proyecto—recomendaciones para el establecimiento de una línea de base", report on project BOLI79 (sustainable and integrated management of natural resources in the tropics of Cochabamba and the Yungas of La Paz) dated 28 April 2011, sect. 1.3. [Back]
139. The project "Afghanistan: research in alternative livelihoods fund", was supported by the Department for International Development of the United Kingdom and implemented between 2004 and 2007. See r4d.dfid.gov.uk/Project/60544. [Back]
140. USAID/Peru, "USAID/Peru country development cooperation strategy 2012-2016" (Lima, 2012), p. 31. [Back]
141. Leik Boonwaat, "Achievements and lessons learned from the balanced approach to opium elimination in the Lao People's Democratic Republic (2001-2004)", paper presented at the Alternative Development Meeting on Removing Impediments to Growth in Doi Tung, Thailand (13-19 November 2004). [Back]
142. UNODC, "Thai alternative development projects showcased at international workshop", 2 December 2011. Available at www.unodc.org/southeastasiaandpacific/en/2011/12/alternative-development-chiang-mai/story.html. [Back]
143. Alternative Development: A Global Thematic Evaluation—Final Synthesis Report, p. 10. [Back]
144. UNODC, "Coffee instead of coca: Peruvian farmers reap the fruits of their labour". Available at www.unodc.org/unodc/en/alternative-development/peru—-success-stories.html. [Back]
145. Alternative Development: A Global Thematic Evaluation—Final Synthesis Report. [Back]
146. See the methodology section in the online version of this report. [Back]
147. "The alternative development model in San Martin". [Back]
148. Final Independent Project Evaluation of the Phongsaly Alternative Livelihood and Food Security Project. [Back]
149. USAID, Assessment of the Implementation of the United States Governments' Support for Plan Colombia's Illicit Crop Reduction Components (Washington, D.C., April 2009), p. 30. [Back]
151. See the methodology section in the online version of this report. [Back]
152. Report of the International Narcotics Control Board for 2002 (E/INCB/2002/1). [Back]
153. William Byrd and Christopher Ward, Drugs and Development in Afghanistan, World Bank Social Development Papers, Paper No. 18, December 2004. [Back]
155. A New Global Partnership: Eradicate Poverty and Transform Economies through Sustainable Development: The Report of the High-Level Panel of Eminent Persons on the Post-2015 Development Agenda (New York, 2013). [Back]
156. See also Tim Midgley and others, Defining and Measuring the External Stress Factors that Lead to Conflict in the Context of the Post-2015 Agenda, Saferworld Reports Series (London, Saferworld, 2014). [Back]
158. A/69/700, para. 52. [Back]
159. E/CN.7/2014/CRP.7, p. 4. [Back]
160. European Commission, The European Union's Generalised System of Preferences GSP, 2004. [Back]
161. European Commission, "Practical guide to the new GSP trade regimes for developing countries" (December 2013). [Back]
162. Dispute Settlement, European Communities—Conditions for the Granting of Tariff Preferences to [Back] Developing Countries, Dispute DS246 (20 July 2005).
163. European Communities—Conditions for the Granting of Tariff Preferences to Developing Countries. [Back]
Corruption and organized crime
 | This document has been published on 20Nov15 by the Equipo Nizkor and Derechos Human Rights. In accordance with Title 17 U.S.C. Section 107, this material is distributed without profit to those who have expressed a prior interest in receiving the included information for research and educational purposes. |